Catarroja Airbnb Market Analysis 2026: Short Term Rental Data & Vacation Rental Statistics in Valencian Community, Spain
Is Airbnb profitable in Catarroja in 2026? Explore comprehensive Airbnb analytics for Catarroja, Valencian Community, Spain to uncover income potential. This 2026 STR market report for Catarroja, based on AirROI data from February 2025 to January 2026, reveals key trends in the niche market of 18 active listings.
Whether you're considering an Airbnb investment in Catarroja, optimizing your existing vacation rental, or exploring rental arbitrage opportunities, understanding the Catarroja Airbnb data is crucial. Navigating the high regulation landscape is key to maximizing your short term rental income potential. Let's dive into the specifics.
Key Catarroja Airbnb Performance Metrics Overview
Monthly Airbnb Revenue Variations & Income Potential in Catarroja (2026)
Understanding the monthly revenue variations for Airbnb listings in Catarroja is key to maximizing your short term rental income potential. Seasonality significantly impacts earnings. Our analysis, based on data from the past 12 months, shows that the peak revenue month for STRs in Catarroja is typically September, while March often presents the lowest earnings, highlighting opportunities for strategic pricing adjustments during shoulder and low seasons. Explore the typical Airbnb income in Catarroja across different performance tiers:
- Best-in-class properties (Top 10%) achieve $2,496+ monthly, often utilizing dynamic pricing and superior guest experiences.
- Strong performing properties (Top 25%) earn $1,790 or more, indicating effective management and desirable locations/amenities.
- Typical properties (Median) generate around $943 per month, representing the average market performance.
- Entry-level properties (Bottom 25%) see earnings around $433, often with potential for optimization.
Average Monthly Airbnb Earnings Trend in Catarroja
Catarroja Airbnb Occupancy Rate Trends (2026)
Maximize your bookings by understanding the Catarroja STR occupancy trends. Seasonal demand shifts significantly influence how often properties are booked. Typically, Septembersees the highest demand (peak season occupancy), while March experiences the lowest (low season). Effective strategies, like adjusting minimum stays or offering promotions, can boost occupancy during slower periods. Here's how different property tiers perform in Catarroja:
- Best-in-class properties (Top 10%) achieve 82%+ occupancy, indicating high desirability and potentially optimized availability.
- Strong performing properties (Top 25%) maintain 70% or higher occupancy, suggesting good market fit and guest satisfaction.
- Typical properties (Median) have an occupancy rate around 34%.
- Entry-level properties (Bottom 25%) average 15% occupancy, potentially facing higher vacancy.
Average Monthly Occupancy Rate Trend in Catarroja
Average Daily Rate (ADR) Airbnb Trends in Catarroja (2026)
Effective short term rental pricing strategy in Catarroja involves understanding monthly ADR fluctuations. The Average Daily Rate (ADR) for Airbnb in Catarroja typically peaks in September and dips lowest during February. Leveraging Airbnb dynamic pricing tools or strategies based on this seasonality can significantly boost revenue. Here's a look at the typical nightly rates achieved:
- Best-in-class properties (Top 10%) command rates of $147+ per night, often due to premium features or locations.
- Strong performing properties (Top 25%) achieve nightly rates of $106 or more.
- Typical properties (Median) charge around $60 per night.
- Entry-level properties (Bottom 25%) earn around $34 per night.
Average Daily Rate (ADR) Trend by Month in Catarroja
Get Live Catarroja Market Intelligence 👇

Explore Real-time Analytics
Airbnb Seasonality Analysis & Trends in Catarroja (2026)
Peak Season (September, August, July)
- Revenue averages $1,772 per month
- Occupancy rates average 54.0%
- Daily rates average $82
Shoulder Season
- Revenue averages $1,225 per month
- Occupancy maintains around 41.0%
- Daily rates hold near $83
Low Season (February, March, April)
- Revenue drops to average $731 per month
- Occupancy decreases to average 38.6%
- Daily rates adjust to average $66
Seasonality Insights for Catarroja
- The Airbnb seasonality in Catarroja shows highly seasonal trends requiring careful strategy. While the sections above show seasonal averages, it's also insightful to look at the extremes:
- During the high season, the absolute peak month showcases Catarroja's highest earning potential, with monthly revenues capable of climbing to $2,034, occupancy reaching a high of 62.6%, and ADRs peaking at $90.
- Conversely, the slowest single month of the year, typically falling within the low season, marks the market's lowest point. In this month, revenue might dip to $624, occupancy could drop to 33.3%, and ADRs may adjust down to $65.
- Understanding both the seasonal averages and these monthly peaks and troughs in revenue, occupancy, and ADR is crucial for maximizing your Airbnb profit potential in Catarroja.
Seasonal Strategies for Maximizing Profit
- Peak Season: Maximize revenue through premium pricing and potentially longer minimum stays. Ensure high availability.
- Low Season: Offer competitive pricing, special promotions (e.g., extended stay discounts), and flexible cancellation policies. Target off-season travelers like remote workers or budget-conscious guests.
- Shoulder Seasons: Implement dynamic pricing that balances peak and low rates. Target weekend travelers or specific events. Offer slightly more flexible terms than peak season.
- Regularly analyze your own performance against these Catarroja seasonality benchmarks and adjust your pricing and availability strategy accordingly.
Best Areas for Airbnb Investment in Catarroja (2026)
Exploring the top neighborhoods for short-term rentals in Catarroja? This section highlights key areas, outlining why they are attractive for hosts and guests, along with notable local attractions. Consider these locations based on your target guest profile and investment strategy.
| Neighborhood / Area | Why Host Here? (Target Guests & Appeal) | Key Attractions & Landmarks |
|---|---|---|
| Catarroja Center | The central area of Catarroja, known for its accessibility and local atmosphere. It’s a hub for local shops, restaurants, and community events, appealing to both locals and tourists looking for an authentic experience. | Plaza de la Virgen, Mercado Municipal, Parque de la Libertad |
| Albufera Natural Park | A beautiful natural reserve just south of Catarroja, ideal for nature lovers and outdoor activities. Visitors come to enjoy the scenic landscapes, birdwatching, and unique ecosystem, making it great for eco-tourism rentals. | Albufera Lagoon, Boat tours, Birdwatching, Traditional rice fields |
| Catarroja Marina | A picturesque area by the water, popular for water sports and relaxation. The marina attracts tourists looking for leisure activities like sailing and dining by the water. | Marina de Catarroja, Waterfront restaurants, Kayaking, Fishing spots |
| Las Cauce | A charming residential area with parks and local amenities, ideal for families and longer stays. Its quiet environment and proximity to schools and parks are appealing to visitors looking for comfort. | Parque de Las Cauce, Children's playgrounds, Local cafes |
| Catarroja Historical District | Rich in history and culture, this area draws visitors interested in local heritage. It's characterized by traditional architecture and historical sites, perfect for cultural tourism. | Church of Santa María, Historical buildings, Local museums |
| Catarroja Market Area | A vibrant area bustling with activity from local markets, attracting tourists and locals alike. It's ideal for short stays and experiencing the local culinary scene. | Local food markets, Tapas bars, Craft fairs |
| Pinedo Beach | Located nearby, this beach area offers access to sun and sand, appealing to beach-goers and vacationers looking for a seaside retreat close to the city. | Pinedo Beach, Beachfront restaurants, Water sports |
| Catarroja Cycling Routes | Known for its bike-friendly paths and routes around the town and into nature. This attracts cycling enthusiasts and those looking for a healthy vacation. | Cycling trails, Bike rental shops, Scenic routes |
Understanding Airbnb License Requirements & STR Laws in Catarroja (2026)
Yes, Catarroja, Valencian Community, Spain enforces high STR regulations. Obtaining a license and ensuring compliance is almost certainly required according to current 2026 STR laws. Always verify the latest short term rental regulations and Airbnb license requirements directly with local government authorities for Catarroja to ensure full compliance before hosting.
(Source: AirROI data, 2026, based on 61% licensed listings)
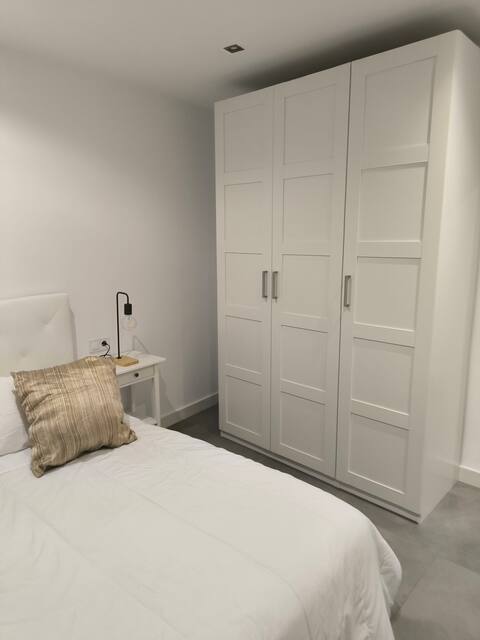
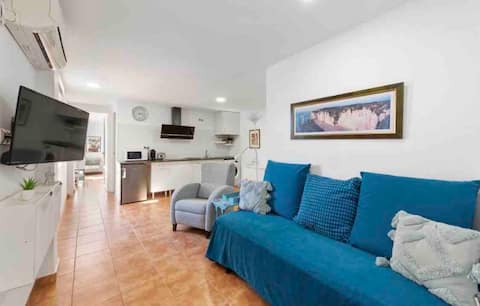
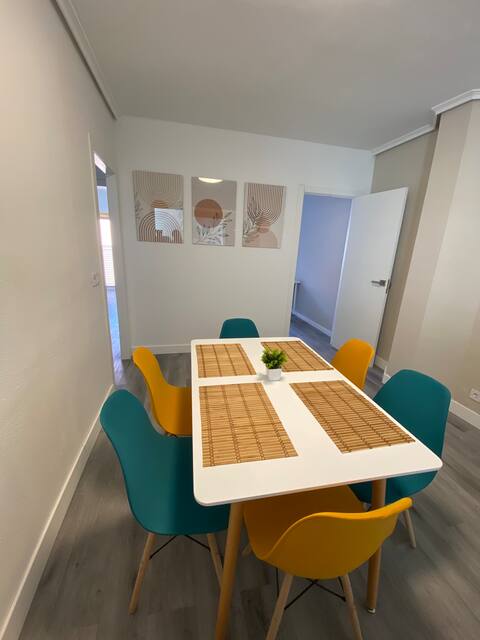
Top Performing Airbnb Properties in Catarroja (2026)
Benchmark your potential! Explore examples of top-performing Airbnb properties in Catarrojabased on Trailing Twelve Month (TTM) revenue. Analyze their characteristics, revenue, occupancy rate, and ADR to understand what drives success in this market.
Modern apartment near Valencia
Entire Place • 3 bedrooms

2 bedrooms
Entire Place • 2 bedrooms
1 bedroom with a terrace
Entire Place • N/A

Valencia close to downtown and beaches.
Entire Place • 3 bedrooms

Room with a terrace
Entire Place • N/A
Valencian Charm in Catarroja
Entire Place • 5 bedrooms
Note: Performance varies based on location, size, amenities, seasonality, and management quality. Data reflects the past 12 months.
Top Performing Airbnb Hosts in Catarroja (2026)
Learn from the best! This table showcases top-performing Airbnb hosts in Catarroja based on the number of properties managed and estimated total revenue over the past year. Analyze their scale and performance metrics.
| Host Name | Properties | Grossing Revenue | Stay Reviews | Avg Rating |
|---|---|---|---|---|
| Rocio | 3 | $66,645 | 304 | 4.75/5.0 |
| Oscar | 1 | $26,591 | 36 | 4.89/5.0 |
| Acertus | 3 | $20,792 | 23 | 4.63/5.0 |
| Eduardo | 1 | $17,130 | 34 | 4.76/5.0 |
| José María | 1 | $14,370 | 8 | 4.88/5.0 |
| Inquilino Rentable | 1 | $9,981 | 8 | 4.88/5.0 |
| David | 1 | $9,328 | 80 | 4.96/5.0 |
| Mercedes | 4 | $7,909 | 22 | 4.72/5.0 |
| María Vicenta | 1 | $4,840 | 53 | 4.74/5.0 |
| Paola | 1 | $2,390 | 20 | 4.90/5.0 |
Analyzing the strategies of top hosts, such as their property selection, pricing, and guest communication, can offer valuable lessons for optimizing your own Airbnb operations in Catarroja.
Dive Deeper: Advanced Catarroja STR Market Data (2026)
Ready to unlock more insights? AirROI provides access to advanced metrics and comprehensive Airbnb data for Catarroja. Explore detailed analytics beyond this report to refine your investment strategy, optimize pricing, and maximize your vacation rental profits.
Explore Advanced MetricsCatarroja Short-Term Rental Market Composition (2026): Property & Room Types
Room Type Distribution
Property Type Distribution
Market Composition Insights for Catarroja
- The Catarroja Airbnb market composition is heavily skewed towards Entire Home/Apt listings, which make up 61.1% of the 18 active rentals. This indicates strong guest preference for privacy and space.
- However, a notable 38.9% share for Private Rooms suggests opportunities for budget-conscious travelers or hosts renting out spare rooms.
- Looking at the property type distribution in Catarroja, Apartment/Condo properties are the most common (88.9%), reflecting the local real estate landscape.
- The presence of 5.6% Hotel/Boutique listings indicates integration with traditional hospitality.
Catarroja Airbnb Room Capacity Analysis (2026): Bedroom Distribution
Distribution of Listings by Number of Bedrooms
Room Capacity Insights for Catarroja
- The dominant room capacity in Catarroja is 3 bedrooms listings, making up 22.2% of the market. This suggests a strong demand for properties suitable for families or small groups.
- Together, 3 bedrooms and 1 bedroom properties represent 44.4% of the active Airbnb listings in Catarroja, indicating a high concentration in these sizes.
- A significant 27.8% of listings offer 3+ bedrooms, catering to larger groups and families seeking more space in Catarroja.
Catarroja Vacation Rental Guest Capacity Trends (2026)
Distribution of Listings by Guest Capacity
Guest Capacity Insights for Catarroja
- The most common guest capacity trend in Catarroja vacation rentals is listings accommodating 4 guests (27.8%). This suggests the primary traveler segment is likely small families or groups.
- Properties designed for 4 guests and 8+ guests dominate the Catarroja STR market, accounting for 44.5% of listings.
- 22.3% of properties accommodate 6+ guests, serving the market segment for larger families or group travel in Catarroja.
- On average, properties in Catarroja are equipped to host 2.9 guests.
Catarroja Airbnb Booking Patterns (2026): Available vs. Booked Days
Available Days Distribution
Booked Days Distribution
Booking Pattern Insights for Catarroja
- The most common availability pattern in Catarroja falls within the 271-366 days range, representing 55.6% of listings. This suggests many properties have significant open periods on their calendars.
- Approximately 72.3% of listings show high availability (181+ days open annually), indicating potential for increased bookings or specific owner usage patterns.
- For booked days, the 31-90 days range is most frequent in Catarroja (33.3%), reflecting common guest stay durations or potential owner blocking patterns.
- A notable 27.8% of properties secure long booking periods (181+ days booked per year), highlighting successful long-term rental strategies or significant owner usage.
Catarroja Airbnb Minimum Stay Requirements Analysis
Distribution of Listings by Minimum Night Requirement
1 Night
4 listings
22.2% of total
2 Nights
4 listings
22.2% of total
3 Nights
1 listings
5.6% of total
4-6 Nights
2 listings
11.1% of total
7-29 Nights
2 listings
11.1% of total
30+ Nights
5 listings
27.8% of total
Key Insights
- The most prevalent minimum stay requirement in Catarroja is 30+ Nights, adopted by 27.8% of listings. This highlights the market's preference for longer commitments.
- A significant segment (27.8%) caters to monthly stays (30+ nights) in Catarroja, pointing to opportunities in the extended-stay market.
Recommendations
- Align with the market by considering a 30+ Nights minimum stay, as 27.8% of Catarroja hosts use this setting.
- If feasible, allowing 1-night stays, especially midweek or during low season, could capture last-minute bookings, as only 22.2% currently do.
- Explore offering discounts for stays of 30+ nights to attract the 27.8% of the market seeking extended stays.
- Adjust minimum nights based on seasonality – potentially shorter during low season and longer during peak demand periods in Catarroja.
Catarroja Airbnb Cancellation Policy Trends Analysis (2026)
Limited
3 listings
16.7% of total
Flexible
6 listings
33.3% of total
Moderate
7 listings
38.9% of total
Firm
1 listings
5.6% of total
Strict
1 listings
5.6% of total
Cancellation Policy Insights for Catarroja
- The prevailing Airbnb cancellation policy trend in Catarroja is Moderate, used by 38.9% of listings.
- The market strongly favors guest-friendly terms, with 72.2% of listings offering Flexible or Moderate policies. This suggests guests in Catarroja may expect booking flexibility.
- Strict cancellation policies are quite rare (5.6%), potentially making listings with this policy less competitive unless justified by high demand or property type.
Recommendations for Hosts
- Consider adopting a Moderate policy to align with the 38.9% market standard in Catarroja.
- Using a Strict policy might deter some guests, as only 5.6% of listings use it. Evaluate if potential revenue protection outweighs possible lower booking rates.
- Regularly review your cancellation policy against competitors and market demand shifts in Catarroja.
Catarroja STR Booking Lead Time Analysis (2026)
Average Booking Lead Time by Month
Booking Lead Time Insights for Catarroja
- The overall average booking lead time for vacation rentals in Catarroja is 64 days.
- Guests book furthest in advance for stays during November (average 77 days), likely coinciding with peak travel demand or local events.
- The shortest booking windows occur for stays in April (average 17 days), indicating more last-minute travel plans during this time.
- Seasonally, Fall (51 days avg.) sees the longest lead times, while Spring (36 days avg.) has the shortest, reflecting typical travel planning cycles.
Recommendations for Hosts
- Use the overall average lead time (64 days) as a baseline for your pricing and availability strategy in Catarroja.
- For November stays, consider implementing length-of-stay discounts or slightly higher rates for bookings made less than 77 days out to capitalize on advance planning.
- Target marketing efforts for the Fall season well in advance (at least 51 days) to capture early planners.
- Monitor your own booking lead times against these Catarroja averages to identify opportunities for dynamic pricing adjustments.
Popular & Essential Airbnb Amenities in Catarroja (2026)
Amenity Prevalence
Amenity Insights for Catarroja
- Essential amenities in Catarroja that guests expect include: Kitchen, Wifi. Lacking these (any) could significantly impact bookings.
- Popular amenities like TV, Hot water, Hair dryer are common but not universal. Offering these can provide a competitive edge.
Recommendations for Hosts
- Ensure your listing includes all essential amenities for Catarroja: Kitchen, Wifi.
- Consider adding popular differentiators like TV or Hot water to increase appeal.
- Highlight unique or less common amenities you offer (e.g., hot tub, dedicated workspace, EV charger) in your listing description and photos.
- Regularly check competitor amenities in Catarroja to stay competitive.
Catarroja Airbnb Guest Demographics & Profile Analysis (2026)
Guest Profile Summary for Catarroja
- The typical guest profile for Airbnb in Catarroja consists of predominantly international visitors (67%), with top international origins including France, typically belonging to the Post-2000s (Gen Z/Alpha) group (50%), primarily speaking English or Spanish.
- Domestic travelers account for 32.7% of guests.
- Key international markets include Spain (32.7%) and France (17.3%).
- Top languages spoken are English (34%) followed by Spanish (32%).
- A significant demographic segment is the Post-2000s (Gen Z/Alpha) group, representing 50% of guests.
Recommendations for Hosts
- Focus marketing internationally, particularly towards travelers from France.
- Tailor amenities and listing descriptions to appeal to the dominant Post-2000s (Gen Z/Alpha) demographic (e.g., highlight fast WiFi, smart home features, local guides).
- Highlight unique local experiences or amenities relevant to the primary guest profile.
- Consider seasonal promotions aligned with peak travel times for key origin markets.
Nearby Short-Term Rental Market Comparison
How does the Catarroja Airbnb market stack up against its neighbors? Compare key performance metrics like average monthly revenue, ADR, and occupancy rates in surrounding areas to understand the broader regional STR landscape.
| Market | Active Properties | Monthly Revenue | Daily Rate | Avg. Occupancy |
|---|---|---|---|---|
| Olocau | 10 | $3,229 | $460.93 | 36% |
| Corbera | 16 | $2,781 | $231.25 | 45% |
| Picassent | 16 | $2,618 | $274.61 | 43% |
| Macastre | 15 | $2,518 | $312.89 | 34% |
| Manises | 27 | $2,511 | $201.27 | 43% |
| l'Eliana | 32 | $2,454 | $314.51 | 40% |
| Alboraia / Alboraya | 244 | $2,297 | $201.35 | 47% |
| Catral | 14 | $2,222 | $220.78 | 40% |
| Benissa | 523 | $2,182 | $303.68 | 39% |
| Bétera | 25 | $2,155 | $264.29 | 42% |