Algorfa Airbnb Market Analysis 2026: Short Term Rental Data & Vacation Rental Statistics in Valencian Community, Spain
Is Airbnb profitable in Algorfa in 2026? Explore comprehensive Airbnb analytics for Algorfa, Valencian Community, Spain to uncover income potential. This 2026 STR market report for Algorfa, based on AirROI data from February 2025 to January 2026, reveals key trends in the niche market of 30 active listings.
Whether you're considering an Airbnb investment in Algorfa, optimizing your existing vacation rental, or exploring rental arbitrage opportunities, understanding the Algorfa Airbnb data is crucial. Navigating the high regulation landscape is key to maximizing your short term rental income potential. Let's dive into the specifics.
Key Algorfa Airbnb Performance Metrics Overview
Monthly Airbnb Revenue Variations & Income Potential in Algorfa (2026)
Understanding the monthly revenue variations for Airbnb listings in Algorfa is key to maximizing your short term rental income potential. Seasonality significantly impacts earnings. Our analysis, based on data from the past 12 months, shows that the peak revenue month for STRs in Algorfa is typically August, while January often presents the lowest earnings, highlighting opportunities for strategic pricing adjustments during shoulder and low seasons. Explore the typical Airbnb income in Algorfa across different performance tiers:
- Best-in-class properties (Top 10%) achieve $4,058+ monthly, often utilizing dynamic pricing and superior guest experiences.
- Strong performing properties (Top 25%) earn $2,588 or more, indicating effective management and desirable locations/amenities.
- Typical properties (Median) generate around $1,277 per month, representing the average market performance.
- Entry-level properties (Bottom 25%) see earnings around $615, often with potential for optimization.
Average Monthly Airbnb Earnings Trend in Algorfa
Algorfa Airbnb Occupancy Rate Trends (2026)
Maximize your bookings by understanding the Algorfa STR occupancy trends. Seasonal demand shifts significantly influence how often properties are booked. Typically, Augustsees the highest demand (peak season occupancy), while January experiences the lowest (low season). Effective strategies, like adjusting minimum stays or offering promotions, can boost occupancy during slower periods. Here's how different property tiers perform in Algorfa:
- Best-in-class properties (Top 10%) achieve 69%+ occupancy, indicating high desirability and potentially optimized availability.
- Strong performing properties (Top 25%) maintain 54% or higher occupancy, suggesting good market fit and guest satisfaction.
- Typical properties (Median) have an occupancy rate around 27%.
- Entry-level properties (Bottom 25%) average 10% occupancy, potentially facing higher vacancy.
Average Monthly Occupancy Rate Trend in Algorfa
Average Daily Rate (ADR) Airbnb Trends in Algorfa (2026)
Effective short term rental pricing strategy in Algorfa involves understanding monthly ADR fluctuations. The Average Daily Rate (ADR) for Airbnb in Algorfa typically peaks in July and dips lowest during February. Leveraging Airbnb dynamic pricing tools or strategies based on this seasonality can significantly boost revenue. Here's a look at the typical nightly rates achieved:
- Best-in-class properties (Top 10%) command rates of $331+ per night, often due to premium features or locations.
- Strong performing properties (Top 25%) achieve nightly rates of $166 or more.
- Typical properties (Median) charge around $113 per night.
- Entry-level properties (Bottom 25%) earn around $87 per night.
Average Daily Rate (ADR) Trend by Month in Algorfa
Get Live Algorfa Market Intelligence 👇

Explore Real-time Analytics
Airbnb Seasonality Analysis & Trends in Algorfa (2026)
Peak Season (August, July, October)
- Revenue averages $3,000 per month
- Occupancy rates average 48.4%
- Daily rates average $169
Shoulder Season
- Revenue averages $1,774 per month
- Occupancy maintains around 32.9%
- Daily rates hold near $151
Low Season (January, November, December)
- Revenue drops to average $1,083 per month
- Occupancy decreases to average 21.4%
- Daily rates adjust to average $147
Seasonality Insights for Algorfa
- The Airbnb seasonality in Algorfa shows highly seasonal trends requiring careful strategy. While the sections above show seasonal averages, it's also insightful to look at the extremes:
- During the high season, the absolute peak month showcases Algorfa's highest earning potential, with monthly revenues capable of climbing to $3,736, occupancy reaching a high of 55.4%, and ADRs peaking at $172.
- Conversely, the slowest single month of the year, typically falling within the low season, marks the market's lowest point. In this month, revenue might dip to $870, occupancy could drop to 19.9%, and ADRs may adjust down to $135.
- Understanding both the seasonal averages and these monthly peaks and troughs in revenue, occupancy, and ADR is crucial for maximizing your Airbnb profit potential in Algorfa.
Seasonal Strategies for Maximizing Profit
- Peak Season: Maximize revenue through premium pricing and potentially longer minimum stays. Ensure high availability.
- Low Season: Offer competitive pricing, special promotions (e.g., extended stay discounts), and flexible cancellation policies. Target off-season travelers like remote workers or budget-conscious guests.
- Shoulder Seasons: Implement dynamic pricing that balances peak and low rates. Target weekend travelers or specific events. Offer slightly more flexible terms than peak season.
- Regularly analyze your own performance against these Algorfa seasonality benchmarks and adjust your pricing and availability strategy accordingly.
Best Areas for Airbnb Investment in Algorfa (2026)
Exploring the top neighborhoods for short-term rentals in Algorfa? This section highlights key areas, outlining why they are attractive for hosts and guests, along with notable local attractions. Consider these locations based on your target guest profile and investment strategy.
| Neighborhood / Area | Why Host Here? (Target Guests & Appeal) | Key Attractions & Landmarks |
|---|---|---|
| Algorfa Town Center | Charming town center with local shops and cafes, perfect for travelers looking for a small-town experience with access to Spanish culture and cuisine. | Town Square, Local Cafes, Church of Our Lady of Sorrows |
| La Finca Golf Resort | Exclusive residential area with a luxury golf resort, appealing to golf enthusiasts and those seeking a tranquil retreat close to nature. | La Finca Golf Course, Spa and Wellness Center, Fine Dining Restaurants |
| El Chaparral | Residential area known for its mix of international expats and locals. Ideal for those looking for a relaxed environment away from the hustle of the coast. | Local Bars, Nature Trails, Community Events |
| Torrevieja Beach | Nearby popular coastal city with beautiful beaches and vibrant nightlife. Attracts tourists looking for a beach holiday with lots of amenities. | Playa del Cura, Promenade, Aquopolis Water Park |
| Guardamar del Segura | Picturesque coastal town with beautiful beaches and natural parks, great for families and beach lovers looking to enjoy the Spanish sun. | Guardamar Beach, Dunes of Guardamar, Campsites and Parks |
| Orihuela Costa | Popular tourist area with numerous residential properties and proximity to beaches, shopping centers, and golf courses, appealing to a wide range of guests. | Playa Flamenca, La Zenia Boulevard, Golf Courses |
| Cabo Roig | Famous coastal area with stunning beaches and a lively dining scene, perfect for vacationers looking for sun and entertainment. | Cabo Roig Beach, Restaurants and Bars, Marina |
| Alicante City | Though a bit further, Alicante provides a vibrant city experience with historical sites, beaches, and a lively atmosphere, appealing to tourists looking for culture and leisure. | Santa Barbara Castle, Postiguet Beach, Alicante Marina |
Understanding Airbnb License Requirements & STR Laws in Algorfa (2026)
Yes, Algorfa, Valencian Community, Spain enforces high STR regulations. Obtaining a license and ensuring compliance is almost certainly required according to current 2026 STR laws. Always verify the latest short term rental regulations and Airbnb license requirements directly with local government authorities for Algorfa to ensure full compliance before hosting.
(Source: AirROI data, 2026, based on 47% licensed listings)
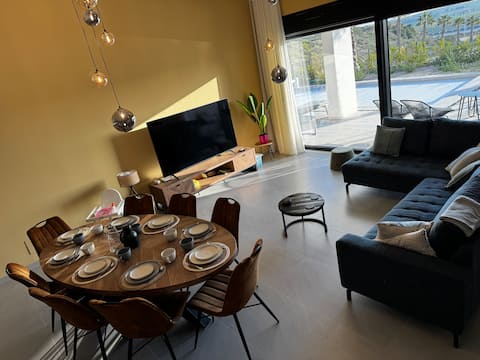
Top Performing Airbnb Properties in Algorfa (2026)
Benchmark your potential! Explore examples of top-performing Airbnb properties in Algorfabased on Trailing Twelve Month (TTM) revenue. Analyze their characteristics, revenue, occupancy rate, and ADR to understand what drives success in this market.
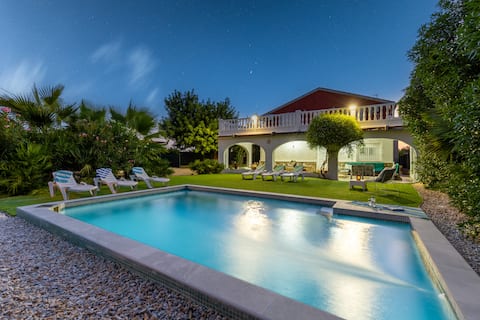
Fidalsa Divine Hiding
Entire Place • 5 bedrooms
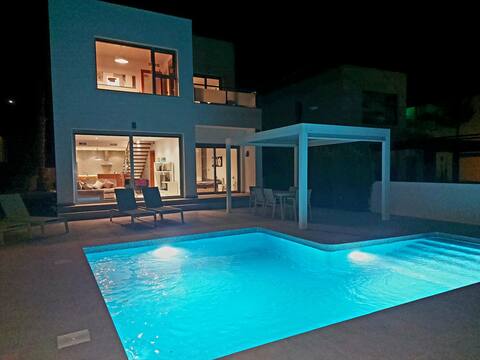
Modern Villa Frontline Golf
Entire Place • 3 bedrooms

Luxury La Finca Frontline Villa.
Entire Place • 3 bedrooms

Villa MOAI op 5* La Finca golf, Close to Alicante
Entire Place • 3 bedrooms
Casa Campo Herrero (villa on La Finca Golf)
Entire Place • 4 bedrooms

La Finca Golf Penthouse with Breathtaking View
Entire Place • 2 bedrooms
Note: Performance varies based on location, size, amenities, seasonality, and management quality. Data reflects the past 12 months.
Top Performing Airbnb Hosts in Algorfa (2026)
Learn from the best! This table showcases top-performing Airbnb hosts in Algorfa based on the number of properties managed and estimated total revenue over the past year. Analyze their scale and performance metrics.
| Host Name | Properties | Grossing Revenue | Stay Reviews | Avg Rating |
|---|---|---|---|---|
| Fidalsaholidays | 2 | $55,080 | 18 | 4.44/5.0 |
| Holidu | 1 | $44,595 | 4 | 5.00/5.0 |
| Lyndy | 1 | $43,934 | 17 | 4.76/5.0 |
| Imka | 1 | $38,899 | 53 | 4.92/5.0 |
| Stéphanie | 1 | $28,601 | 2 | Not Rated |
| Joel | 1 | $27,008 | 49 | 4.94/5.0 |
| Hilde | 1 | $25,490 | 5 | 4.80/5.0 |
| Julie | 1 | $22,123 | 14 | 4.93/5.0 |
| Andy And Veerle | 1 | $21,572 | 47 | 4.81/5.0 |
| Jac | 1 | $15,278 | 22 | 4.82/5.0 |
Analyzing the strategies of top hosts, such as their property selection, pricing, and guest communication, can offer valuable lessons for optimizing your own Airbnb operations in Algorfa.
Dive Deeper: Advanced Algorfa STR Market Data (2026)
Ready to unlock more insights? AirROI provides access to advanced metrics and comprehensive Airbnb data for Algorfa. Explore detailed analytics beyond this report to refine your investment strategy, optimize pricing, and maximize your vacation rental profits.
Explore Advanced MetricsAlgorfa Short-Term Rental Market Composition (2026): Property & Room Types
Room Type Distribution
Property Type Distribution
Market Composition Insights for Algorfa
- The Algorfa Airbnb market composition is heavily skewed towards Entire Home/Apt listings, which make up 100% of the 30 active rentals. This indicates strong guest preference for privacy and space.
- Looking at the property type distribution in Algorfa, House properties are the most common (56.7%), reflecting the local real estate landscape.
- Houses represent a significant 56.7% portion, catering likely to families or larger groups.
- Smaller segments like others (combined 3.3%) offer potential for unique stay experiences.
Algorfa Airbnb Room Capacity Analysis (2026): Bedroom Distribution
Distribution of Listings by Number of Bedrooms
Room Capacity Insights for Algorfa
- The dominant room capacity in Algorfa is 2 bedrooms listings, making up 60% of the market. This suggests a strong demand for properties suitable for couples or solo travelers.
- Together, 2 bedrooms and 3 bedrooms properties represent 86.7% of the active Airbnb listings in Algorfa, indicating a high concentration in these sizes.
- A significant 33.3% of listings offer 3+ bedrooms, catering to larger groups and families seeking more space in Algorfa.
Algorfa Vacation Rental Guest Capacity Trends (2026)
Distribution of Listings by Guest Capacity
Guest Capacity Insights for Algorfa
- The most common guest capacity trend in Algorfa vacation rentals is listings accommodating 4 guests (50%). This suggests the primary traveler segment is likely small families or groups.
- Properties designed for 4 guests and 6 guests dominate the Algorfa STR market, accounting for 80.0% of listings.
- 36.7% of properties accommodate 6+ guests, serving the market segment for larger families or group travel in Algorfa.
- On average, properties in Algorfa are equipped to host 4.9 guests.
Algorfa Airbnb Booking Patterns (2026): Available vs. Booked Days
Available Days Distribution
Booked Days Distribution
Booking Pattern Insights for Algorfa
- The most common availability pattern in Algorfa falls within the 271-366 days range, representing 66.7% of listings. This suggests many properties have significant open periods on their calendars.
- Approximately 86.7% of listings show high availability (181+ days open annually), indicating potential for increased bookings or specific owner usage patterns.
- For booked days, the 1-30 days range is most frequent in Algorfa (33.3%), reflecting common guest stay durations or potential owner blocking patterns.
- A notable 13.3% of properties secure long booking periods (181+ days booked per year), highlighting successful long-term rental strategies or significant owner usage.
Algorfa Airbnb Minimum Stay Requirements Analysis
Distribution of Listings by Minimum Night Requirement
1 Night
2 listings
6.7% of total
2 Nights
1 listings
3.3% of total
3 Nights
3 listings
10% of total
4-6 Nights
8 listings
26.7% of total
7-29 Nights
8 listings
26.7% of total
30+ Nights
8 listings
26.7% of total
Key Insights
- The most prevalent minimum stay requirement in Algorfa is 4-6 Nights, adopted by 26.7% of listings. This highlights the market's preference for longer commitments.
- Very short stays (1-2 nights) are less common (10.0%), suggesting hosts prefer slightly longer bookings to optimize turnover.
- A significant segment (26.7%) caters to monthly stays (30+ nights) in Algorfa, pointing to opportunities in the extended-stay market.
Recommendations
- Align with the market by considering a 4-6 Nights minimum stay, as 26.7% of Algorfa hosts use this setting.
- If feasible, allowing 1-night stays, especially midweek or during low season, could capture last-minute bookings, as only 6.7% currently do.
- Explore offering discounts for stays of 30+ nights to attract the 26.7% of the market seeking extended stays.
- Adjust minimum nights based on seasonality – potentially shorter during low season and longer during peak demand periods in Algorfa.
Algorfa Airbnb Cancellation Policy Trends Analysis (2026)
Super Strict 60 Days
1 listings
3.3% of total
Flexible
4 listings
13.3% of total
Moderate
6 listings
20% of total
Firm
13 listings
43.3% of total
Strict
6 listings
20% of total
Cancellation Policy Insights for Algorfa
- The prevailing Airbnb cancellation policy trend in Algorfa is Firm, used by 43.3% of listings.
- A majority (63.3%) of hosts in Algorfa utilize Firm or Strict policies, indicating a market where hosts prioritize booking security.
Recommendations for Hosts
- Consider adopting a Firm policy to align with the 43.3% market standard in Algorfa.
- Regularly review your cancellation policy against competitors and market demand shifts in Algorfa.
Algorfa STR Booking Lead Time Analysis (2026)
Average Booking Lead Time by Month
Booking Lead Time Insights for Algorfa
- The overall average booking lead time for vacation rentals in Algorfa is 95 days.
- Guests book furthest in advance for stays during August (average 133 days), likely coinciding with peak travel demand or local events.
- The shortest booking windows occur for stays in November (average 52 days), indicating more last-minute travel plans during this time.
- Seasonally, Summer (115 days avg.) sees the longest lead times, while Spring (76 days avg.) has the shortest, reflecting typical travel planning cycles.
Recommendations for Hosts
- Use the overall average lead time (95 days) as a baseline for your pricing and availability strategy in Algorfa.
- For August stays, consider implementing length-of-stay discounts or slightly higher rates for bookings made less than 133 days out to capitalize on advance planning.
- Target marketing efforts for the Summer season well in advance (at least 115 days) to capture early planners.
- Monitor your own booking lead times against these Algorfa averages to identify opportunities for dynamic pricing adjustments.
Popular & Essential Airbnb Amenities in Algorfa (2026)
Amenity Prevalence
Amenity Insights for Algorfa
- Essential amenities in Algorfa that guests expect include: Air conditioning, Kitchen, TV, Wifi, Pool. Lacking these (any) could significantly impact bookings.
- Popular amenities like Washer, Hangers, Free parking on premises are common but not universal. Offering these can provide a competitive edge.
Recommendations for Hosts
- Ensure your listing includes all essential amenities for Algorfa: Air conditioning, Kitchen, TV, Wifi, Pool.
- Prioritize adding missing essentials: Wifi, Pool.
- Consider adding popular differentiators like Washer or Hangers to increase appeal.
- Highlight unique or less common amenities you offer (e.g., hot tub, dedicated workspace, EV charger) in your listing description and photos.
- Regularly check competitor amenities in Algorfa to stay competitive.
Algorfa Airbnb Guest Demographics & Profile Analysis (2026)
Guest Profile Summary for Algorfa
- The typical guest profile for Airbnb in Algorfa consists of predominantly international visitors (97%), with top international origins including France, typically belonging to the Post-2000s (Gen Z/Alpha) group (50%), primarily speaking English or French.
- Domestic travelers account for 3.1% of guests.
- Key international markets include United Kingdom (59.4%) and France (6.3%).
- Top languages spoken are English (35.5%) followed by French (19.4%).
- A significant demographic segment is the Post-2000s (Gen Z/Alpha) group, representing 50% of guests.
Recommendations for Hosts
- Focus marketing internationally, particularly towards travelers from France.
- Tailor amenities and listing descriptions to appeal to the dominant Post-2000s (Gen Z/Alpha) demographic (e.g., highlight fast WiFi, smart home features, local guides).
- Highlight unique local experiences or amenities relevant to the primary guest profile.
- Consider seasonal promotions aligned with peak travel times for key origin markets.
Nearby Short-Term Rental Market Comparison
How does the Algorfa Airbnb market stack up against its neighbors? Compare key performance metrics like average monthly revenue, ADR, and occupancy rates in surrounding areas to understand the broader regional STR landscape.
| Market | Active Properties | Monthly Revenue | Daily Rate | Avg. Occupancy |
|---|---|---|---|---|
| Olocau | 10 | $3,229 | $460.93 | 36% |
| Corbera | 16 | $2,781 | $231.25 | 45% |
| Picassent | 16 | $2,618 | $274.61 | 43% |
| Macastre | 15 | $2,518 | $312.89 | 34% |
| Manises | 27 | $2,511 | $201.27 | 43% |
| l'Eliana | 32 | $2,454 | $314.51 | 40% |
| Alboraia / Alboraya | 244 | $2,297 | $201.35 | 47% |
| Catral | 14 | $2,222 | $220.78 | 40% |
| Benissa | 523 | $2,182 | $303.68 | 39% |
| Bétera | 25 | $2,155 | $264.29 | 42% |