Alcalá de Henares Airbnb Market Analysis 2026: Short Term Rental Data & Vacation Rental Statistics in Community of Madrid, Spain
Is Airbnb profitable in Alcalá de Henares in 2026? Explore comprehensive Airbnb analytics for Alcalá de Henares, Community of Madrid, Spain to uncover income potential. This 2026 STR market report for Alcalá de Henares, based on AirROI data from February 2025 to January 2026, reveals key trends in the niche market of 171 active listings.
Whether you're considering an Airbnb investment in Alcalá de Henares, optimizing your existing vacation rental, or exploring rental arbitrage opportunities, understanding the Alcalá de Henares Airbnb data is crucial. Navigating the high regulation landscape is key to maximizing your short term rental income potential. Let's dive into the specifics.
Key Alcalá de Henares Airbnb Performance Metrics Overview
Monthly Airbnb Revenue Variations & Income Potential in Alcalá de Henares (2026)
Understanding the monthly revenue variations for Airbnb listings in Alcalá de Henares is key to maximizing your short term rental income potential. Seasonality significantly impacts earnings. Our analysis, based on data from the past 12 months, shows that the peak revenue month for STRs in Alcalá de Henares is typically October, while January often presents the lowest earnings, highlighting opportunities for strategic pricing adjustments during shoulder and low seasons. Explore the typical Airbnb income in Alcalá de Henares across different performance tiers:
- Best-in-class properties (Top 10%) achieve $2,986+ monthly, often utilizing dynamic pricing and superior guest experiences.
- Strong performing properties (Top 25%) earn $2,106 or more, indicating effective management and desirable locations/amenities.
- Typical properties (Median) generate around $1,293 per month, representing the average market performance.
- Entry-level properties (Bottom 25%) see earnings around $604, often with potential for optimization.
Average Monthly Airbnb Earnings Trend in Alcalá de Henares
Alcalá de Henares Airbnb Occupancy Rate Trends (2026)
Maximize your bookings by understanding the Alcalá de Henares STR occupancy trends. Seasonal demand shifts significantly influence how often properties are booked. Typically, Junesees the highest demand (peak season occupancy), while January experiences the lowest (low season). Effective strategies, like adjusting minimum stays or offering promotions, can boost occupancy during slower periods. Here's how different property tiers perform in Alcalá de Henares:
- Best-in-class properties (Top 10%) achieve 83%+ occupancy, indicating high desirability and potentially optimized availability.
- Strong performing properties (Top 25%) maintain 67% or higher occupancy, suggesting good market fit and guest satisfaction.
- Typical properties (Median) have an occupancy rate around 48%.
- Entry-level properties (Bottom 25%) average 28% occupancy, potentially facing higher vacancy.
Average Monthly Occupancy Rate Trend in Alcalá de Henares
Average Daily Rate (ADR) Airbnb Trends in Alcalá de Henares (2026)
Effective short term rental pricing strategy in Alcalá de Henares involves understanding monthly ADR fluctuations. The Average Daily Rate (ADR) for Airbnb in Alcalá de Henares typically peaks in December and dips lowest during March. Leveraging Airbnb dynamic pricing tools or strategies based on this seasonality can significantly boost revenue. Here's a look at the typical nightly rates achieved:
- Best-in-class properties (Top 10%) command rates of $164+ per night, often due to premium features or locations.
- Strong performing properties (Top 25%) achieve nightly rates of $120 or more.
- Typical properties (Median) charge around $88 per night.
- Entry-level properties (Bottom 25%) earn around $47 per night.
Average Daily Rate (ADR) Trend by Month in Alcalá de Henares
Get Live Alcalá de Henares Market Intelligence 👇

Explore Real-time Analytics
Airbnb Seasonality Analysis & Trends in Alcalá de Henares (2026)
Peak Season (October, June, December)
- Revenue averages $1,796 per month
- Occupancy rates average 53.4%
- Daily rates average $100
Shoulder Season
- Revenue averages $1,535 per month
- Occupancy maintains around 48.0%
- Daily rates hold near $93
Low Season (January, February, March)
- Revenue drops to average $1,152 per month
- Occupancy decreases to average 42.3%
- Daily rates adjust to average $90
Seasonality Insights for Alcalá de Henares
- The Airbnb seasonality in Alcalá de Henares shows moderate seasonality with distinct peak and low periods. While the sections above show seasonal averages, it's also insightful to look at the extremes:
- During the high season, the absolute peak month showcases Alcalá de Henares's highest earning potential, with monthly revenues capable of climbing to $1,839, occupancy reaching a high of 57.1%, and ADRs peaking at $103.
- Conversely, the slowest single month of the year, typically falling within the low season, marks the market's lowest point. In this month, revenue might dip to $1,100, occupancy could drop to 32.6%, and ADRs may adjust down to $85.
- Understanding both the seasonal averages and these monthly peaks and troughs in revenue, occupancy, and ADR is crucial for maximizing your Airbnb profit potential in Alcalá de Henares.
Seasonal Strategies for Maximizing Profit
- Peak Season: Maximize revenue through premium pricing and potentially longer minimum stays. Ensure high availability.
- Low Season: Offer competitive pricing, special promotions (e.g., extended stay discounts), and flexible cancellation policies. Target off-season travelers like remote workers or budget-conscious guests.
- Shoulder Seasons: Implement dynamic pricing that balances peak and low rates. Target weekend travelers or specific events. Offer slightly more flexible terms than peak season.
- Regularly analyze your own performance against these Alcalá de Henares seasonality benchmarks and adjust your pricing and availability strategy accordingly.
Best Areas for Airbnb Investment in Alcalá de Henares (2026)
Exploring the top neighborhoods for short-term rentals in Alcalá de Henares? This section highlights key areas, outlining why they are attractive for hosts and guests, along with notable local attractions. Consider these locations based on your target guest profile and investment strategy.
| Neighborhood / Area | Why Host Here? (Target Guests & Appeal) | Key Attractions & Landmarks |
|---|---|---|
| City Center | The historic center of Alcalá de Henares, known for its rich cultural heritage and proximity to key attractions. It's a prime location for tourists interested in history and culture. | Cervantes Birthplace Museum, Plaza de Cervantes, Alcalá University, Cathedral of Alcalá, Archaeological Museum |
| El Ensanche | A modern neighborhood with good transport links and an increasing number of restaurants and shops. It's becoming popular among families and younger professionals. | Shopping centers, Parks and green spaces, Cafés and restaurants, Local markets |
| La Garena | A residential area that offers a quieter environment, appealing to families and those looking for a longer stay. Close to schools and amenities. | Local parks, Family-friendly activities, Nearby shopping areas |
| Profesor José García Santesmases | A growing neighborhood with new developments and easy access to the main roads, suitable for business travelers and those visiting Alcalá for work. | Business centers, Transport links to Madrid, Local dining options |
| Calle Mayor | A bustling street filled with shops, cafes, and cultural sites. Perfect for attracting tourists wanting to experience the local vibe. | Shops, Dining experiences, Street performances, Cultural events |
| Campus Universitario | Close to the university, making it ideal for students and academic visitors. Offers a dynamic atmosphere with young people. | University facilities, Student events, Local nightlife |
| Barrio de La Paloma | A picturesque neighborhood known for its charming streets and traditional Spanish architecture. Great for tourists seeking an authentic experience. | Local festivals, Artisan shops, Traditional tapas bars |
| Cuartel de Ingenieros | An area undergoing revitalization with new businesses. It appeals to those interested in history due to its military past and evolving culture. | Historical sites, New development projects, Cultural installations |
Understanding Airbnb License Requirements & STR Laws in Alcalá de Henares (2026)
Yes, Alcalá de Henares, Community of Madrid, Spain enforces high STR regulations. Obtaining a license and ensuring compliance is almost certainly required according to current 2026 STR laws. Always verify the latest short term rental regulations and Airbnb license requirements directly with local government authorities for Alcalá de Henares to ensure full compliance before hosting.
(Source: AirROI data, 2026, based on 54% licensed listings)
Top Performing Airbnb Properties in Alcalá de Henares (2026)
Benchmark your potential! Explore examples of top-performing Airbnb properties in Alcalá de Henaresbased on Trailing Twelve Month (TTM) revenue. Analyze their characteristics, revenue, occupancy rate, and ADR to understand what drives success in this market.
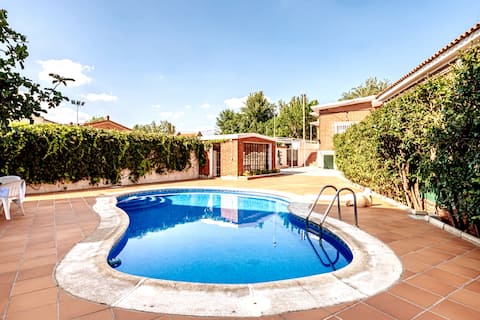
Inés's house./Chalet in Alcala de Henares
Entire Place • 6 bedrooms

Design and Relax in Alcalá I 3 Bedrooms I Private Patio
Entire Place • 3 bedrooms

Unique Views I Premium Duplex I 2 Bedrooms
Entire Place • 2 bedrooms

Sephardic Apartment, Calle Mayor, Alcalá de Henares
Entire Place • 3 bedrooms

Modern apartment just a short walk from the historic center.
Entire Place • 2 bedrooms

San Isidro Apartment
Entire Place • 3 bedrooms
Note: Performance varies based on location, size, amenities, seasonality, and management quality. Data reflects the past 12 months.
Top Performing Airbnb Hosts in Alcalá de Henares (2026)
Learn from the best! This table showcases top-performing Airbnb hosts in Alcalá de Henares based on the number of properties managed and estimated total revenue over the past year. Analyze their scale and performance metrics.
| Host Name | Properties | Grossing Revenue | Stay Reviews | Avg Rating |
|---|---|---|---|---|
| Alojamientos Gictour | 25 | $389,928 | 443 | 4.40/5.0 |
| Nando | 4 | $113,390 | 378 | 4.81/5.0 |
| David Jesus | 2 | $98,723 | 184 | 5.00/5.0 |
| Eva | 2 | $81,878 | 98 | 4.92/5.0 |
| Elena | 4 | $80,554 | 592 | 4.83/5.0 |
| Eva | 2 | $77,602 | 218 | 4.98/5.0 |
| Rocío | 5 | $76,648 | 150 | 4.68/5.0 |
| Samuel | 3 | $72,615 | 184 | 4.82/5.0 |
| Feng | 5 | $70,449 | 69 | 4.65/5.0 |
| Juli | 2 | $66,613 | 76 | 4.86/5.0 |
Analyzing the strategies of top hosts, such as their property selection, pricing, and guest communication, can offer valuable lessons for optimizing your own Airbnb operations in Alcalá de Henares.
Dive Deeper: Advanced Alcalá de Henares STR Market Data (2026)
Ready to unlock more insights? AirROI provides access to advanced metrics and comprehensive Airbnb data for Alcalá de Henares. Explore detailed analytics beyond this report to refine your investment strategy, optimize pricing, and maximize your vacation rental profits.
Explore Advanced MetricsAlcalá de Henares Short-Term Rental Market Composition (2026): Property & Room Types
Room Type Distribution
Property Type Distribution
Market Composition Insights for Alcalá de Henares
- The Alcalá de Henares Airbnb market composition is heavily skewed towards Entire Home/Apt listings, which make up 63.2% of the 171 active rentals. This indicates strong guest preference for privacy and space.
- However, a notable 36.8% share for Private Rooms suggests opportunities for budget-conscious travelers or hosts renting out spare rooms.
- Looking at the property type distribution in Alcalá de Henares, Apartment/Condo properties are the most common (75.4%), reflecting the local real estate landscape.
- Houses represent a significant 18.1% portion, catering likely to families or larger groups.
- The presence of 5.8% Hotel/Boutique listings indicates integration with traditional hospitality.
- Smaller segments like others (combined 0.6%) offer potential for unique stay experiences.
Alcalá de Henares Airbnb Room Capacity Analysis (2026): Bedroom Distribution
Distribution of Listings by Number of Bedrooms
Room Capacity Insights for Alcalá de Henares
- The dominant room capacity in Alcalá de Henares is 1 bedroom listings, making up 29.8% of the market. This suggests a strong demand for properties suitable for couples or solo travelers.
- Together, 1 bedroom and 2 bedrooms properties represent 50.3% of the active Airbnb listings in Alcalá de Henares, indicating a high concentration in these sizes.
Alcalá de Henares Vacation Rental Guest Capacity Trends (2026)
Distribution of Listings by Guest Capacity
Guest Capacity Insights for Alcalá de Henares
- The most common guest capacity trend in Alcalá de Henares vacation rentals is listings accommodating 4 guests (20.5%). This suggests the primary traveler segment is likely small families or groups.
- Properties designed for 4 guests and 2 guests dominate the Alcal�á de Henares STR market, accounting for 35.1% of listings.
- 15.8% of properties accommodate 6+ guests, serving the market segment for larger families or group travel in Alcalá de Henares.
- On average, properties in Alcalá de Henares are equipped to host 2.9 guests.
Alcalá de Henares Airbnb Booking Patterns (2026): Available vs. Booked Days
Available Days Distribution
Booked Days Distribution
Booking Pattern Insights for Alcalá de Henares
- The most common availability pattern in Alcalá de Henares falls within the 181-270 days range, representing 36.8% of listings. This suggests many properties have significant open periods on their calendars.
- Approximately 72.5% of listings show high availability (181+ days open annually), indicating potential for increased bookings or specific owner usage patterns.
- For booked days, the 91-180 days range is most frequent in Alcalá de Henares (36.3%), reflecting common guest stay durations or potential owner blocking patterns.
- A notable 31.0% of properties secure long booking periods (181+ days booked per year), highlighting successful long-term rental strategies or significant owner usage.
Alcalá de Henares Airbnb Minimum Stay Requirements Analysis
Distribution of Listings by Minimum Night Requirement
1 Night
34 listings
19.9% of total
2 Nights
61 listings
35.7% of total
3 Nights
9 listings
5.3% of total
4-6 Nights
8 listings
4.7% of total
7-29 Nights
10 listings
5.8% of total
30+ Nights
49 listings
28.7% of total
Key Insights
- The most prevalent minimum stay requirement in Alcalá de Henares is 2 Nights, adopted by 35.7% of listings. This highlights the market's preference for shorter, flexible bookings.
- A significant segment (28.7%) caters to monthly stays (30+ nights) in Alcalá de Henares, pointing to opportunities in the extended-stay market.
Recommendations
- Align with the market by considering a 2 Nights minimum stay, as 35.7% of Alcalá de Henares hosts use this setting.
- If feasible, allowing 1-night stays, especially midweek or during low season, could capture last-minute bookings, as only 19.9% currently do.
- A 2-night minimum appears standard (35.7%). Consider this for weekends or peak periods.
- Explore offering discounts for stays of 30+ nights to attract the 28.7% of the market seeking extended stays.
- Adjust minimum nights based on seasonality – potentially shorter during low season and longer during peak demand periods in Alcalá de Henares.
Alcalá de Henares Airbnb Cancellation Policy Trends Analysis (2026)
Super Strict 60 Days
1 listings
0.6% of total
Flexible
42 listings
24.7% of total
Moderate
76 listings
44.7% of total
Firm
30 listings
17.6% of total
Strict
21 listings
12.4% of total
Cancellation Policy Insights for Alcalá de Henares
- The prevailing Airbnb cancellation policy trend in Alcalá de Henares is Moderate, used by 44.7% of listings.
- There's a relatively balanced mix between guest-friendly (69.4%) and stricter (30.0%) policies, offering choices for different guest needs.
Recommendations for Hosts
- Consider adopting a Moderate policy to align with the 44.7% market standard in Alcalá de Henares.
- Using a Strict policy might deter some guests, as only 12.4% of listings use it. Evaluate if potential revenue protection outweighs possible lower booking rates.
- Regularly review your cancellation policy against competitors and market demand shifts in Alcalá de Henares.
Alcalá de Henares STR Booking Lead Time Analysis (2026)
Average Booking Lead Time by Month
Booking Lead Time Insights for Alcalá de Henares
- The overall average booking lead time for vacation rentals in Alcalá de Henares is 39 days.
- Guests book furthest in advance for stays during September (average 65 days), likely coinciding with peak travel demand or local events.
- The shortest booking windows occur for stays in February (average 24 days), indicating more last-minute travel plans during this time.
- Seasonally, Fall (49 days avg.) sees the longest lead times, while Winter (33 days avg.) has the shortest, reflecting typical travel planning cycles.
Recommendations for Hosts
- Use the overall average lead time (39 days) as a baseline for your pricing and availability strategy in Alcalá de Henares.
- For September stays, consider implementing length-of-stay discounts or slightly higher rates for bookings made less than 65 days out to capitalize on advance planning.
- Target marketing efforts for the Fall season well in advance (at least 49 days) to capture early planners.
- Monitor your own booking lead times against these Alcalá de Henares averages to identify opportunities for dynamic pricing adjustments.
Popular & Essential Airbnb Amenities in Alcalá de Henares (2026)
Amenity Prevalence
Amenity Insights for Alcalá de Henares
- Essential amenities in Alcalá de Henares that guests expect include: Wifi. Lacking these (this) could significantly impact bookings.
- Popular amenities like Heating, Washer, Hot water are common but not universal. Offering these can provide a competitive edge.
Recommendations for Hosts
- Ensure your listing includes all essential amenities for Alcalá de Henares: Wifi.
- Prioritize adding missing essentials: Wifi.
- Consider adding popular differentiators like Heating or Washer to increase appeal.
- Highlight unique or less common amenities you offer (e.g., hot tub, dedicated workspace, EV charger) in your listing description and photos.
- Regularly check competitor amenities in Alcalá de Henares to stay competitive.
Alcalá de Henares Airbnb Guest Demographics & Profile Analysis (2026)
Guest Profile Summary for Alcalá de Henares
- The typical guest profile for Airbnb in Alcalá de Henares consists of a mix of domestic (43%) and international guests, with top international origins including United States, typically belonging to the Post-2000s (Gen Z/Alpha) group (50%), primarily speaking Spanish or English.
- Domestic travelers account for 43.4% of guests.
- Key international markets include Spain (43.4%) and United States (12.5%).
- Top languages spoken are Spanish (34.7%) followed by English (32.6%).
- A significant demographic segment is the Post-2000s (Gen Z/Alpha) group, representing 50% of guests.
Recommendations for Hosts
- Balance marketing efforts between domestic and international channels based on the guest mix.
- Tailor amenities and listing descriptions to appeal to the dominant Post-2000s (Gen Z/Alpha) demographic (e.g., highlight fast WiFi, smart home features, local guides).
- Highlight unique local experiences or amenities relevant to the primary guest profile.
- Consider seasonal promotions aligned with peak travel times for key origin markets.
Nearby Short-Term Rental Market Comparison
How does the Alcalá de Henares Airbnb market stack up against its neighbors? Compare key performance metrics like average monthly revenue, ADR, and occupancy rates in surrounding areas to understand the broader regional STR landscape.
| Market | Active Properties | Monthly Revenue | Daily Rate | Avg. Occupancy |
|---|---|---|---|---|
| Robledo de Chavela | 24 | $3,250 | $290.52 | 40% |
| Ortigosa del Monte | 11 | $3,026 | $348.22 | 35% |
| Argés | 24 | $2,969 | $274.34 | 37% |
| Guadamur | 32 | $2,895 | $273.54 | 38% |
| Méntrida | 12 | $2,825 | $373.67 | 31% |
| Santa Cruz del Retamar | 13 | $2,715 | $450.25 | 27% |
| Torrelodones | 15 | $2,696 | $583.52 | 31% |
| El Espinar | 34 | $2,666 | $335.59 | 34% |
| Olías del Rey | 11 | $2,648 | $294.70 | 43% |
| Pelayos de la Presa | 13 | $2,539 | $308.49 | 34% |