Blanes Airbnb Market Analysis 2026: Short Term Rental Data & Vacation Rental Statistics in Catalonia, Spain
Is Airbnb profitable in Blanes in 2026? Explore comprehensive Airbnb analytics for Blanes, Catalonia, Spain to uncover income potential. This 2026 STR market report for Blanes, based on AirROI data from February 2025 to January 2026, reveals key trends in the market of 393 active listings.
Whether you're considering an Airbnb investment in Blanes, optimizing your existing vacation rental, or exploring rental arbitrage opportunities, understanding the Blanes Airbnb data is crucial. Navigating the high regulation landscape is key to maximizing your short term rental income potential. Let's dive into the specifics.
Key Blanes Airbnb Performance Metrics Overview
Monthly Airbnb Revenue Variations & Income Potential in Blanes (2026)
Understanding the monthly revenue variations for Airbnb listings in Blanes is key to maximizing your short term rental income potential. Seasonality significantly impacts earnings. Our analysis, based on data from the past 12 months, shows that the peak revenue month for STRs in Blanes is typically August, while February often presents the lowest earnings, highlighting opportunities for strategic pricing adjustments during shoulder and low seasons. Explore the typical Airbnb income in Blanes across different performance tiers:
- Best-in-class properties (Top 10%) achieve $4,936+ monthly, often utilizing dynamic pricing and superior guest experiences.
- Strong performing properties (Top 25%) earn $2,806 or more, indicating effective management and desirable locations/amenities.
- Typical properties (Median) generate around $1,696 per month, representing the average market performance.
- Entry-level properties (Bottom 25%) see earnings around $883, often with potential for optimization.
Average Monthly Airbnb Earnings Trend in Blanes
Blanes Airbnb Occupancy Rate Trends (2026)
Maximize your bookings by understanding the Blanes STR occupancy trends. Seasonal demand shifts significantly influence how often properties are booked. Typically, Augustsees the highest demand (peak season occupancy), while January experiences the lowest (low season). Effective strategies, like adjusting minimum stays or offering promotions, can boost occupancy during slower periods. Here's how different property tiers perform in Blanes:
- Best-in-class properties (Top 10%) achieve 77%+ occupancy, indicating high desirability and potentially optimized availability.
- Strong performing properties (Top 25%) maintain 58% or higher occupancy, suggesting good market fit and guest satisfaction.
- Typical properties (Median) have an occupancy rate around 36%.
- Entry-level properties (Bottom 25%) average 17% occupancy, potentially facing higher vacancy.
Average Monthly Occupancy Rate Trend in Blanes
Average Daily Rate (ADR) Airbnb Trends in Blanes (2026)
Effective short term rental pricing strategy in Blanes involves understanding monthly ADR fluctuations. The Average Daily Rate (ADR) for Airbnb in Blanes typically peaks in August and dips lowest during March. Leveraging Airbnb dynamic pricing tools or strategies based on this seasonality can significantly boost revenue. Here's a look at the typical nightly rates achieved:
- Best-in-class properties (Top 10%) command rates of $422+ per night, often due to premium features or locations.
- Strong performing properties (Top 25%) achieve nightly rates of $234 or more.
- Typical properties (Median) charge around $151 per night.
- Entry-level properties (Bottom 25%) earn around $108 per night.
Average Daily Rate (ADR) Trend by Month in Blanes
Get Live Blanes Market Intelligence 👇

Explore Real-time Analytics
Airbnb Seasonality Analysis & Trends in Blanes (2026)
Peak Season (August, July, September)
- Revenue averages $4,738 per month
- Occupancy rates average 57.7%
- Daily rates average $248
Shoulder Season
- Revenue averages $2,120 per month
- Occupancy maintains around 36.1%
- Daily rates hold near $212
Low Season (January, February, November)
- Revenue drops to average $1,081 per month
- Occupancy decreases to average 26.2%
- Daily rates adjust to average $210
Seasonality Insights for Blanes
- The Airbnb seasonality in Blanes shows highly seasonal trends requiring careful strategy. While the sections above show seasonal averages, it's also insightful to look at the extremes:
- During the high season, the absolute peak month showcases Blanes's highest earning potential, with monthly revenues capable of climbing to $5,846, occupancy reaching a high of 66.1%, and ADRs peaking at $261.
- Conversely, the slowest single month of the year, typically falling within the low season, marks the market's lowest point. In this month, revenue might dip to $817, occupancy could drop to 20.2%, and ADRs may adjust down to $197.
- Understanding both the seasonal averages and these monthly peaks and troughs in revenue, occupancy, and ADR is crucial for maximizing your Airbnb profit potential in Blanes.
Seasonal Strategies for Maximizing Profit
- Peak Season: Maximize revenue through premium pricing and potentially longer minimum stays. Ensure high availability.
- Low Season: Offer competitive pricing, special promotions (e.g., extended stay discounts), and flexible cancellation policies. Target off-season travelers like remote workers or budget-conscious guests.
- Shoulder Seasons: Implement dynamic pricing that balances peak and low rates. Target weekend travelers or specific events. Offer slightly more flexible terms than peak season.
- Regularly analyze your own performance against these Blanes seasonality benchmarks and adjust your pricing and availability strategy accordingly.
Best Areas for Airbnb Investment in Blanes (2026)
Exploring the top neighborhoods for short-term rentals in Blanes? This section highlights key areas, outlining why they are attractive for hosts and guests, along with notable local attractions. Consider these locations based on your target guest profile and investment strategy.
| Neighborhood / Area | Why Host Here? (Target Guests & Appeal) | Key Attractions & Landmarks |
|---|---|---|
| Platja de Blanes | The main beach area known for its golden sands and vibrant atmosphere. It attracts tourists looking for sun and sea, making it a prime location for vacation rentals. | Castell de Sant Joan, Marineland Catalunya, Jardí Botànic Marimurtra, Blanes Harbour, Blanes Market |
| Cala de Sant Francesc | A beautiful cove beach known for its clear waters and stunning natural surroundings. Appealing to travelers seeking tranquility and scenic views. | Cala de Sant Francesc Beach, Sa Palomera, Parc Natural del Montgrí, Scenic walking trails, Nearby restaurants with sea views |
| Carrer de Santa Anna | A bustling street filled with shops, cafes, and eateries. Ideal for guests who want to be in the heart of Blanes, close to amenities and a lively atmosphere. | Blanes Town Square, Café de la Plaça, Blanes Shopping Center, Local artisan shops, Annual festivals and events |
| Blanes Centre | The town center offers a mix of local culture, dining, and accessibility to transportation. Great for visitors who want to explore the town and nearby attractions easily. | Blanes Castle, Church of Santa Maria, Local markets, Restaurants and tapas bars, Cultural festivals |
| Punta de Fenals | An area known for its scenic viewpoints and proximity to natural parks, attracting nature lovers and outdoor enthusiasts. | Natural Park of Montnegre, Scenic lookouts, Hiking trails, Horseback riding, Cycling routes |
| Cala de Sa Forcanera | A lesser-known beach that provides a more secluded experience away from the crowds. Ideal for those looking for a peaceful retreat. | Secluded beach areas, Rock formations, Natural swimming spots, Quiet walking paths, Snorkeling opportunities |
| Palafolls | A short distance from Blanes, this area offers a more rural getaway with access to nature while still being close to the beach. | Palafolls Castle, Vineyards, Hiking routes, Cultural heritage sites, Local cuisine |
| Montgó Mountain | A mountainous region that offers breathtaking views of the coastline and is perfect for hikers and adventurers. | Hiking trails, Spectacular coastal views, Picnic areas, Nature observations, Flora and fauna |
Understanding Airbnb License Requirements & STR Laws in Blanes (2026)
Yes, Blanes, Catalonia, Spain enforces high STR regulations. Obtaining a license and ensuring compliance is almost certainly required according to current 2026 STR laws. Always verify the latest short term rental regulations and Airbnb license requirements directly with local government authorities for Blanes to ensure full compliance before hosting.
(Source: AirROI data, 2026, based on 86% licensed listings)
Top Performing Airbnb Properties in Blanes (2026)
Benchmark your potential! Explore examples of top-performing Airbnb properties in Blanesbased on Trailing Twelve Month (TTM) revenue. Analyze their characteristics, revenue, occupancy rate, and ADR to understand what drives success in this market.
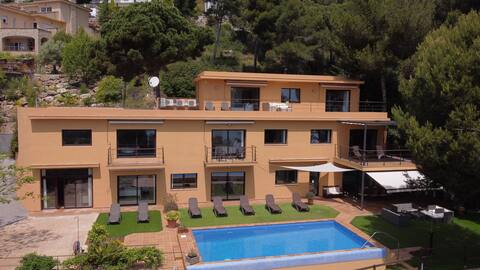
VILLA LA CALA with swimming pool & sea view
Entire Place • 8 bedrooms
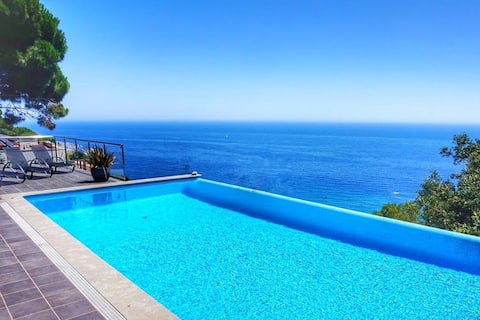
CostaBravaNatura ★Villa InfinityViews★
Entire Place • 5 bedrooms
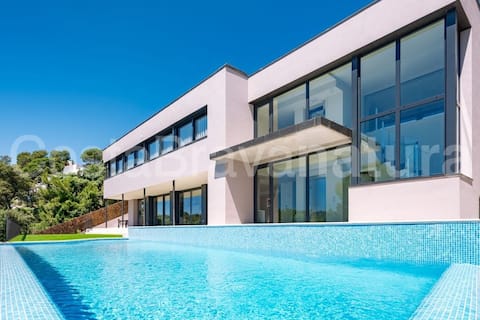
CostaBravaNatura ★ Villa Pinya de Rosa ★
Entire Place • 6 bedrooms
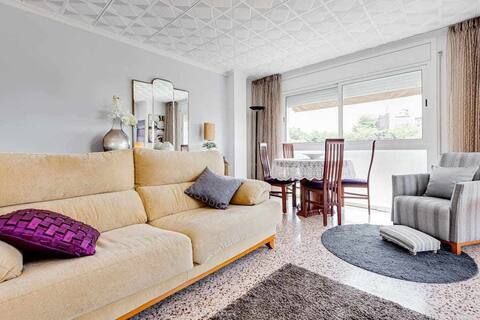
Rentalsbcn - Plaza Nuria
Entire Place • 2 bedrooms

Blanes Beach Bliss - Private Cove and Pool
Entire Place • 4 bedrooms
★ Coastal Villas - Las Brisas ★ luxury near beach
Entire Place • 7 bedrooms
Note: Performance varies based on location, size, amenities, seasonality, and management quality. Data reflects the past 12 months.
Top Performing Airbnb Hosts in Blanes (2026)
Learn from the best! This table showcases top-performing Airbnb hosts in Blanes based on the number of properties managed and estimated total revenue over the past year. Analyze their scale and performance metrics.
| Host Name | Properties | Grossing Revenue | Stay Reviews | Avg Rating |
|---|---|---|---|---|
| CoastalVillas | 16 | $631,341 | 177 | 4.72/5.0 |
| Adel | 3 | $389,107 | 115 | 4.93/5.0 |
| Mauro Gabriel | 8 | $331,037 | 72 | 4.71/5.0 |
| Justyna | 7 | $276,051 | 85 | 4.75/5.0 |
| Aleksandr | 1 | $229,862 | 63 | 4.98/5.0 |
| Carolina | 6 | $206,992 | 51 | 4.26/5.0 |
| Jordi | 26 | $180,561 | 271 | 4.68/5.0 |
| Guillem | 4 | $142,833 | 60 | 4.82/5.0 |
| Sebastien - Interhome | 9 | $122,654 | 38 | 4.24/5.0 |
| Debra | 1 | $112,176 | 34 | 4.97/5.0 |
Analyzing the strategies of top hosts, such as their property selection, pricing, and guest communication, can offer valuable lessons for optimizing your own Airbnb operations in Blanes.
Dive Deeper: Advanced Blanes STR Market Data (2026)
Ready to unlock more insights? AirROI provides access to advanced metrics and comprehensive Airbnb data for Blanes. Explore detailed analytics beyond this report to refine your investment strategy, optimize pricing, and maximize your vacation rental profits.
Explore Advanced MetricsBlanes Short-Term Rental Market Composition (2026): Property & Room Types
Room Type Distribution
Property Type Distribution
Market Composition Insights for Blanes
- The Blanes Airbnb market composition is heavily skewed towards Entire Home/Apt listings, which make up 92.4% of the 393 active rentals. This indicates strong guest preference for privacy and space.
- Looking at the property type distribution in Blanes, Apartment/Condo properties are the most common (75.1%), reflecting the local real estate landscape.
- Houses represent a significant 19.3% portion, catering likely to families or larger groups.
- Smaller segments like hotel/boutique, others, unique stays (combined 5.7%) offer potential for unique stay experiences.
Blanes Airbnb Room Capacity Analysis (2026): Bedroom Distribution
Distribution of Listings by Number of Bedrooms
Room Capacity Insights for Blanes
- The dominant room capacity in Blanes is 2 bedrooms listings, making up 32.1% of the market. This suggests a strong demand for properties suitable for couples or solo travelers.
- Together, 2 bedrooms and 1 bedroom properties represent 56.0% of the active Airbnb listings in Blanes, indicating a high concentration in these sizes.
- A significant 36.8% of listings offer 3+ bedrooms, catering to larger groups and families seeking more space in Blanes.
Blanes Vacation Rental Guest Capacity Trends (2026)
Distribution of Listings by Guest Capacity
Guest Capacity Insights for Blanes
- The most common guest capacity trend in Blanes vacation rentals is listings accommodating 4 guests (30.3%). This suggests the primary traveler segment is likely small families or groups.
- Properties designed for 4 guests and 6 guests dominate the Blanes STR market, accounting for 48.1% of listings.
- 38.4% of properties accommodate 6+ guests, serving the market segment for larger families or group travel in Blanes.
- On average, properties in Blanes are equipped to host 4.8 guests.
Blanes Airbnb Booking Patterns (2026): Available vs. Booked Days
Available Days Distribution
Booked Days Distribution
Booking Pattern Insights for Blanes
- The most common availability pattern in Blanes falls within the 271-366 days range, representing 57% of listings. This suggests many properties have significant open periods on their calendars.
- Approximately 88.8% of listings show high availability (181+ days open annually), indicating potential for increased bookings or specific owner usage patterns.
- For booked days, the 91-180 days range is most frequent in Blanes (33.3%), reflecting common guest stay durations or potential owner blocking patterns.
- A notable 11.5% of properties secure long booking periods (181+ days booked per year), highlighting successful long-term rental strategies or significant owner usage.
Blanes Airbnb Minimum Stay Requirements Analysis
Distribution of Listings by Minimum Night Requirement
1 Night
24 listings
6.1% of total
2 Nights
19 listings
4.8% of total
3 Nights
20 listings
5.1% of total
4-6 Nights
121 listings
30.8% of total
7-29 Nights
29 listings
7.4% of total
30+ Nights
180 listings
45.8% of total
Key Insights
- The most prevalent minimum stay requirement in Blanes is 30+ Nights, adopted by 45.8% of listings. This highlights the market's preference for longer commitments.
- Very short stays (1-2 nights) are less common (10.9%), suggesting hosts prefer slightly longer bookings to optimize turnover.
- A significant segment (45.8%) caters to monthly stays (30+ nights) in Blanes, pointing to opportunities in the extended-stay market.
Recommendations
- Align with the market by considering a 30+ Nights minimum stay, as 45.8% of Blanes hosts use this setting.
- If feasible, allowing 1-night stays, especially midweek or during low season, could capture last-minute bookings, as only 6.1% currently do.
- Explore offering discounts for stays of 30+ nights to attract the 45.8% of the market seeking extended stays.
- Adjust minimum nights based on seasonality – potentially shorter during low season and longer during peak demand periods in Blanes.
Blanes Airbnb Cancellation Policy Trends Analysis (2026)
Limited
6 listings
1.5% of total
Super Strict 60 Days
23 listings
5.9% of total
Super Strict 30 Days
9 listings
2.3% of total
Flexible
42 listings
10.7% of total
Moderate
73 listings
18.6% of total
Firm
180 listings
45.8% of total
Strict
60 listings
15.3% of total
Cancellation Policy Insights for Blanes
- The prevailing Airbnb cancellation policy trend in Blanes is Firm, used by 45.8% of listings.
- A majority (61.1%) of hosts in Blanes utilize Firm or Strict policies, indicating a market where hosts prioritize booking security.
Recommendations for Hosts
- Consider adopting a Firm policy to align with the 45.8% market standard in Blanes.
- Regularly review your cancellation policy against competitors and market demand shifts in Blanes.
Blanes STR Booking Lead Time Analysis (2026)
Average Booking Lead Time by Month
Booking Lead Time Insights for Blanes
- The overall average booking lead time for vacation rentals in Blanes is 57 days.
- Guests book furthest in advance for stays during August (average 88 days), likely coinciding with peak travel demand or local events.
- The shortest booking windows occur for stays in February (average 19 days), indicating more last-minute travel plans during this time.
- Seasonally, Summer (74 days avg.) sees the longest lead times, while Winter (30 days avg.) has the shortest, reflecting typical travel planning cycles.
Recommendations for Hosts
- Use the overall average lead time (57 days) as a baseline for your pricing and availability strategy in Blanes.
- For August stays, consider implementing length-of-stay discounts or slightly higher rates for bookings made less than 88 days out to capitalize on advance planning.
- Target marketing efforts for the Summer season well in advance (at least 74 days) to capture early planners.
- Monitor your own booking lead times against these Blanes averages to identify opportunities for dynamic pricing adjustments.
Popular & Essential Airbnb Amenities in Blanes (2026)
Amenity Prevalence
Amenity Insights for Blanes
- Essential amenities in Blanes that guests expect include: TV. Lacking these (this) could significantly impact bookings.
- Popular amenities like Kitchen, Wifi, Washer are common but not universal. Offering these can provide a competitive edge.
- Warning: Wifi is not universally provided but is considered essential globally. Ensure reliable Wifi is offered.
Recommendations for Hosts
- Ensure your listing includes all essential amenities for Blanes: TV.
- Prioritize adding missing essentials: TV.
- Consider adding popular differentiators like Kitchen or Wifi to increase appeal.
- Highlight unique or less common amenities you offer (e.g., hot tub, dedicated workspace, EV charger) in your listing description and photos.
- Regularly check competitor amenities in Blanes to stay competitive.
Blanes Airbnb Guest Demographics & Profile Analysis (2026)
Guest Profile Summary for Blanes
- The typical guest profile for Airbnb in Blanes consists of predominantly international visitors (85%), with top international origins including Spain, typically belonging to the Post-2000s (Gen Z/Alpha) group (50%), primarily speaking English or Spanish.
- Domestic travelers account for 15.4% of guests.
- Key international markets include France (29.4%) and Spain (15.4%).
- Top languages spoken are English (35.6%) followed by Spanish (16.3%).
- A significant demographic segment is the Post-2000s (Gen Z/Alpha) group, representing 50% of guests.
Recommendations for Hosts
- Focus marketing internationally, particularly towards travelers from Spain.
- Tailor amenities and listing descriptions to appeal to the dominant Post-2000s (Gen Z/Alpha) demographic (e.g., highlight fast WiFi, smart home features, local guides).
- Highlight unique local experiences or amenities relevant to the primary guest profile.
- Consider seasonal promotions aligned with peak travel times for key origin markets.
Nearby Short-Term Rental Market Comparison
How does the Blanes Airbnb market stack up against its neighbors? Compare key performance metrics like average monthly revenue, ADR, and occupancy rates in surrounding areas to understand the broader regional STR landscape.
| Market | Active Properties | Monthly Revenue | Daily Rate | Avg. Occupancy |
|---|---|---|---|---|
| Vall-llobrega | 18 | $10,253 | $778.88 | 45% |
| Canyelles | 47 | $7,127 | $1152.36 | 35% |
| Cornellà del Terri | 15 | $6,458 | $584.61 | 40% |
| Vallirana | 10 | $5,639 | $350.46 | 57% |
| Tiana | 15 | $5,135 | $362.37 | 45% |
| Sant Vicenç de Montalt | 40 | $5,005 | $422.72 | 39% |
| Amer | 11 | $4,949 | $462.57 | 38% |
| Sant Andreu de Llavaneres | 45 | $4,931 | $450.05 | 41% |
| Teià | 25 | $4,821 | $394.46 | 40% |
| Premià de Dalt | 31 | $4,548 | $337.99 | 47% |