Segovia Airbnb Market Analysis 2026: Short Term Rental Data & Vacation Rental Statistics in Castile and León, Spain
Is Airbnb profitable in Segovia in 2026? Explore comprehensive Airbnb analytics for Segovia, Castile and León, Spain to uncover income potential. This 2026 STR market report for Segovia, based on AirROI data from February 2025 to January 2026, reveals key trends in the niche market of 112 active listings.
Whether you're considering an Airbnb investment in Segovia, optimizing your existing vacation rental, or exploring rental arbitrage opportunities, understanding the Segovia Airbnb data is crucial. Navigating the high regulation landscape is key to maximizing your short term rental income potential. Let's dive into the specifics.
Key Segovia Airbnb Performance Metrics Overview
Monthly Airbnb Revenue Variations & Income Potential in Segovia (2026)
Understanding the monthly revenue variations for Airbnb listings in Segovia is key to maximizing your short term rental income potential. Seasonality significantly impacts earnings. Our analysis, based on data from the past 12 months, shows that the peak revenue month for STRs in Segovia is typically August, while January often presents the lowest earnings, highlighting opportunities for strategic pricing adjustments during shoulder and low seasons. Explore the typical Airbnb income in Segovia across different performance tiers:
- Best-in-class properties (Top 10%) achieve $3,831+ monthly, often utilizing dynamic pricing and superior guest experiences.
- Strong performing properties (Top 25%) earn $2,614 or more, indicating effective management and desirable locations/amenities.
- Typical properties (Median) generate around $1,730 per month, representing the average market performance.
- Entry-level properties (Bottom 25%) see earnings around $792, often with potential for optimization.
Average Monthly Airbnb Earnings Trend in Segovia
Segovia Airbnb Occupancy Rate Trends (2026)
Maximize your bookings by understanding the Segovia STR occupancy trends. Seasonal demand shifts significantly influence how often properties are booked. Typically, Octobersees the highest demand (peak season occupancy), while January experiences the lowest (low season). Effective strategies, like adjusting minimum stays or offering promotions, can boost occupancy during slower periods. Here's how different property tiers perform in Segovia:
- Best-in-class properties (Top 10%) achieve 75%+ occupancy, indicating high desirability and potentially optimized availability.
- Strong performing properties (Top 25%) maintain 59% or higher occupancy, suggesting good market fit and guest satisfaction.
- Typical properties (Median) have an occupancy rate around 42%.
- Entry-level properties (Bottom 25%) average 25% occupancy, potentially facing higher vacancy.
Average Monthly Occupancy Rate Trend in Segovia
Average Daily Rate (ADR) Airbnb Trends in Segovia (2026)
Effective short term rental pricing strategy in Segovia involves understanding monthly ADR fluctuations. The Average Daily Rate (ADR) for Airbnb in Segovia typically peaks in December and dips lowest during March. Leveraging Airbnb dynamic pricing tools or strategies based on this seasonality can significantly boost revenue. Here's a look at the typical nightly rates achieved:
- Best-in-class properties (Top 10%) command rates of $276+ per night, often due to premium features or locations.
- Strong performing properties (Top 25%) achieve nightly rates of $172 or more.
- Typical properties (Median) charge around $121 per night.
- Entry-level properties (Bottom 25%) earn around $78 per night.
Average Daily Rate (ADR) Trend by Month in Segovia
Get Live Segovia Market Intelligence 👇

Explore Real-time Analytics
Airbnb Seasonality Analysis & Trends in Segovia (2026)
Peak Season (August, October, May)
- Revenue averages $2,445 per month
- Occupancy rates average 50.8%
- Daily rates average $146
Shoulder Season
- Revenue averages $2,040 per month
- Occupancy maintains around 43.3%
- Daily rates hold near $145
Low Season (January, February, March)
- Revenue drops to average $1,404 per month
- Occupancy decreases to average 33.5%
- Daily rates adjust to average $137
Seasonality Insights for Segovia
- The Airbnb seasonality in Segovia shows moderate seasonality with distinct peak and low periods. While the sections above show seasonal averages, it's also insightful to look at the extremes:
- During the high season, the absolute peak month showcases Segovia's highest earning potential, with monthly revenues capable of climbing to $2,545, occupancy reaching a high of 51.3%, and ADRs peaking at $152.
- Conversely, the slowest single month of the year, typically falling within the low season, marks the market's lowest point. In this month, revenue might dip to $1,278, occupancy could drop to 26.2%, and ADRs may adjust down to $132.
- Understanding both the seasonal averages and these monthly peaks and troughs in revenue, occupancy, and ADR is crucial for maximizing your Airbnb profit potential in Segovia.
Seasonal Strategies for Maximizing Profit
- Peak Season: Maximize revenue through premium pricing and potentially longer minimum stays. Ensure high availability.
- Low Season: Offer competitive pricing, special promotions (e.g., extended stay discounts), and flexible cancellation policies. Target off-season travelers like remote workers or budget-conscious guests.
- Shoulder Seasons: Implement dynamic pricing that balances peak and low rates. Target weekend travelers or specific events. Offer slightly more flexible terms than peak season.
- Regularly analyze your own performance against these Segovia seasonality benchmarks and adjust your pricing and availability strategy accordingly.
Best Areas for Airbnb Investment in Segovia (2026)
Exploring the top neighborhoods for short-term rentals in Segovia? This section highlights key areas, outlining why they are attractive for hosts and guests, along with notable local attractions. Consider these locations based on your target guest profile and investment strategy.
| Neighborhood / Area | Why Host Here? (Target Guests & Appeal) | Key Attractions & Landmarks |
|---|---|---|
| Historic Center | The heart of Segovia, known for its rich history, stunning architecture, and iconic landmarks. Attracts tourists who want to explore the Roman aqueduct, the Alcázar, and the stunning cathedral. | Aqueduct of Segovia, Alcázar of Segovia, Segovia Cathedral, Plaza Mayor, Old City Walls, Casa de Orellana |
| La Granja de San Ildefonso | Famous for its royal palace and beautiful gardens. This area is perfect for those interested in nature and royal history, making it popular among tourists and visitors. | Royal Palace of La Granja, La Granja Gardens, Royal Glass Factory, Sierra de Guadarrama National Park |
| San Lorenzo | A charming neighborhood known for its local atmosphere, traditional eateries, and proximity to the historic center. Ideal for families and those who want a more local experience. | San Lorenzo Park, Monastery of San Antonio El Real, Local Tapas Bars, Traditional Markets |
| Segovia Old Town | Characterized by its medieval architecture and narrow streets, this area is perfect for those looking for a more intimate and historical glimpse of Segovia. | Calle de Juan Bravo, Plaza de la Merced, Church of San Martin, Museum of Segovia |
| Torrecaballeros | A nearby village offering a quieter and more rural experience, ideal for those looking to escape the city while still being accessible to Segovia. | Natural Environment, Hiking Trails, Local Wineries |
| Judería | The historic Jewish quarter of Segovia, filled with winding streets and rich cultural heritage. It offers a unique perspective on Segovia's diverse history. | Old Synagogue, Jewish History Museum, Typical Jewish Cuisine |
| Monasterio San Antonio El Real | A lesser-known area with a historic monastery, great for those seeking tranquility and a unique cultural experience away from the bustling tourist spots. | Monastery, Surrounding Gardens, Local Artisans |
| Coca | A small town near Segovia known for its impressive castle and historic setting, attractive for visitors interested in castles and rural tourism. | Coca Castle, Historic Church, Rural Tourism Opportunities |
Understanding Airbnb License Requirements & STR Laws in Segovia (2026)
Yes, Segovia, Castile and León, Spain enforces high STR regulations. Obtaining a license and ensuring compliance is almost certainly required according to current 2026 STR laws. Always verify the latest short term rental regulations and Airbnb license requirements directly with local government authorities for Segovia to ensure full compliance before hosting.
(Source: AirROI data, 2026, based on 54% licensed listings)
Top Performing Airbnb Properties in Segovia (2026)
Benchmark your potential! Explore examples of top-performing Airbnb properties in Segoviabased on Trailing Twelve Month (TTM) revenue. Analyze their characteristics, revenue, occupancy rate, and ADR to understand what drives success in this market.

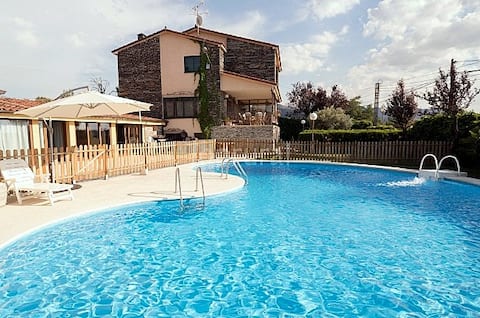
Chalet for 15 people, 2000 m garden and swimming pool
Entire Place • 5 bedrooms
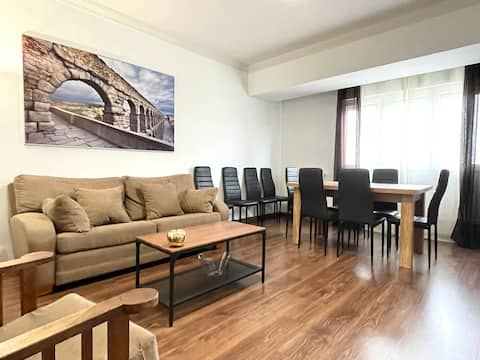
Centrally located and comfortable duplex
Entire Place • 6 bedrooms
Finca El Olivo
Entire Place • 5 bedrooms

AM 1 Segovia VUT
Entire Place • 2 bedrooms

AM 6 Segovia VUT
Entire Place • 2 bedrooms

AM 5 Segovia VUT
Entire Place • 2 bedrooms
Note: Performance varies based on location, size, amenities, seasonality, and management quality. Data reflects the past 12 months.
Top Performing Airbnb Hosts in Segovia (2026)
Learn from the best! This table showcases top-performing Airbnb hosts in Segovia based on the number of properties managed and estimated total revenue over the past year. Analyze their scale and performance metrics.
| Host Name | Properties | Grossing Revenue | Stay Reviews | Avg Rating |
|---|---|---|---|---|
| Yolanda | 9 | $296,573 | 2420 | 4.74/5.0 |
| Amapartmentsegovia | 6 | $285,191 | 198 | 4.85/5.0 |
| César | 1 | $128,603 | 255 | 4.93/5.0 |
| Enrique | 4 | $105,259 | 699 | 4.79/5.0 |
| Andrés & María | 5 | $92,419 | 160 | 4.94/5.0 |
| Carmen | 4 | $85,528 | 155 | 4.88/5.0 |
| Toño | 3 | $81,243 | 141 | 4.80/5.0 |
| Almanso Rents Sl | 4 | $72,203 | 80 | 4.47/5.0 |
| Jose | 3 | $70,015 | 777 | 4.81/5.0 |
| Yolanda | 2 | $66,780 | 35 | 4.96/5.0 |
Analyzing the strategies of top hosts, such as their property selection, pricing, and guest communication, can offer valuable lessons for optimizing your own Airbnb operations in Segovia.
Dive Deeper: Advanced Segovia STR Market Data (2026)
Ready to unlock more insights? AirROI provides access to advanced metrics and comprehensive Airbnb data for Segovia. Explore detailed analytics beyond this report to refine your investment strategy, optimize pricing, and maximize your vacation rental profits.
Explore Advanced MetricsSegovia Short-Term Rental Market Composition (2026): Property & Room Types
Room Type Distribution
Property Type Distribution
Market Composition Insights for Segovia
- The Segovia Airbnb market composition is heavily skewed towards Entire Home/Apt listings, which make up 75% of the 112 active rentals. This indicates strong guest preference for privacy and space.
- Looking at the property type distribution in Segovia, Apartment/Condo properties are the most common (69.6%), reflecting the local real estate landscape.
- Houses represent a significant 25% portion, catering likely to families or larger groups.
- The presence of 5.4% Hotel/Boutique listings indicates integration with traditional hospitality.
Segovia Airbnb Room Capacity Analysis (2026): Bedroom Distribution
Distribution of Listings by Number of Bedrooms
Room Capacity Insights for Segovia
- The dominant room capacity in Segovia is 1 bedroom listings, making up 31.3% of the market. This suggests a strong demand for properties suitable for couples or solo travelers.
- Together, 1 bedroom and 3 bedrooms properties represent 52.7% of the active Airbnb listings in Segovia, indicating a high concentration in these sizes.
- A significant 34.8% of listings offer 3+ bedrooms, catering to larger groups and families seeking more space in Segovia.
Segovia Vacation Rental Guest Capacity Trends (2026)
Distribution of Listings by Guest Capacity
Guest Capacity Insights for Segovia
- The most common guest capacity trend in Segovia vacation rentals is listings accommodating 4 guests (23.2%). This suggests the primary traveler segment is likely small families or groups.
- Properties designed for 4 guests and 6 guests dominate the Segovia STR market, accounting for 38.4% of listings.
- 27.7% of properties accommodate 6+ guests, serving the market segment for larger families or group travel in Segovia.
- On average, properties in Segovia are equipped to host 3.8 guests.
Segovia Airbnb Booking Patterns (2026): Available vs. Booked Days
Available Days Distribution
Booked Days Distribution
Booking Pattern Insights for Segovia
- The most common availability pattern in Segovia falls within the 271-366 days range, representing 39.3% of listings. This suggests many properties have significant open periods on their calendars.
- Approximately 69.7% of listings show high availability (181+ days open annually), indicating potential for increased bookings or specific owner usage patterns.
- For booked days, the 91-180 days range is most frequent in Segovia (33%), reflecting common guest stay durations or potential owner blocking patterns.
- A notable 31.3% of properties secure long booking periods (181+ days booked per year), highlighting successful long-term rental strategies or significant owner usage.
Segovia Airbnb Minimum Stay Requirements Analysis
Distribution of Listings by Minimum Night Requirement
1 Night
39 listings
35.1% of total
2 Nights
28 listings
25.2% of total
3 Nights
1 listings
0.9% of total
7-29 Nights
1 listings
0.9% of total
30+ Nights
42 listings
37.8% of total
Key Insights
- The most prevalent minimum stay requirement in Segovia is 30+ Nights, adopted by 37.8% of listings. This highlights the market's preference for longer commitments.
- A strong majority (60.3%) of the Segovia Airbnb data shows acceptance of very short stays (1-2 nights), indicating a dynamic, high-turnover market.
- A significant segment (37.8%) caters to monthly stays (30+ nights) in Segovia, pointing to opportunities in the extended-stay market.
Recommendations
- Align with the market by considering a 30+ Nights minimum stay, as 37.8% of Segovia hosts use this setting.
- Explore offering discounts for stays of 30+ nights to attract the 37.8% of the market seeking extended stays.
- Adjust minimum nights based on seasonality – potentially shorter during low season and longer during peak demand periods in Segovia.
Segovia Airbnb Cancellation Policy Trends Analysis (2026)
Limited
5 listings
4.5% of total
Super Strict 30 Days
1 listings
0.9% of total
Flexible
36 listings
32.1% of total
Moderate
37 listings
33% of total
Firm
27 listings
24.1% of total
Strict
6 listings
5.4% of total
Cancellation Policy Insights for Segovia
- The prevailing Airbnb cancellation policy trend in Segovia is Moderate, used by 33% of listings.
- There's a relatively balanced mix between guest-friendly (65.1%) and stricter (29.5%) policies, offering choices for different guest needs.
- Strict cancellation policies are quite rare (5.4%), potentially making listings with this policy less competitive unless justified by high demand or property type.
Recommendations for Hosts
- Consider adopting a Moderate policy to align with the 33% market standard in Segovia.
- Using a Strict policy might deter some guests, as only 5.4% of listings use it. Evaluate if potential revenue protection outweighs possible lower booking rates.
- Regularly review your cancellation policy against competitors and market demand shifts in Segovia.
Segovia STR Booking Lead Time Analysis (2026)
Average Booking Lead Time by Month
Booking Lead Time Insights for Segovia
- The overall average booking lead time for vacation rentals in Segovia is 52 days.
- Guests book furthest in advance for stays during May (average 74 days), likely coinciding with peak travel demand or local events.
- The shortest booking windows occur for stays in February (average 31 days), indicating more last-minute travel plans during this time.
- Seasonally, Spring (56 days avg.) sees the longest lead times, while Winter (39 days avg.) has the shortest, reflecting typical travel planning cycles.
Recommendations for Hosts
- Use the overall average lead time (52 days) as a baseline for your pricing and availability strategy in Segovia.
- For May stays, consider implementing length-of-stay discounts or slightly higher rates for bookings made less than 74 days out to capitalize on advance planning.
- Target marketing efforts for the Spring season well in advance (at least 56 days) to capture early planners.
- Monitor your own booking lead times against these Segovia averages to identify opportunities for dynamic pricing adjustments.
Popular & Essential Airbnb Amenities in Segovia (2026)
Amenity Prevalence
Amenity Insights for Segovia
- Popular amenities like Heating, Wifi, Kitchen are common but not universal. Offering these can provide a competitive edge.
- Warning: Wifi is not universally provided but is considered essential globally. Ensure reliable Wifi is offered.
Recommendations for Hosts
- Consider adding popular differentiators like Heating or Wifi to increase appeal.
- Highlight unique or less common amenities you offer (e.g., hot tub, dedicated workspace, EV charger) in your listing description and photos.
- Regularly check competitor amenities in Segovia to stay competitive.
Segovia Airbnb Guest Demographics & Profile Analysis (2026)
Guest Profile Summary for Segovia
- The typical guest profile for Airbnb in Segovia consists of a mix of domestic (47%) and international guests, with top international origins including United States, typically belonging to the Post-2000s (Gen Z/Alpha) group (50%), primarily speaking English or Spanish.
- Domestic travelers account for 47.0% of guests.
- Key international markets include Spain (47%) and United States (15.2%).
- Top languages spoken are English (37%) followed by Spanish (34.1%).
- A significant demographic segment is the Post-2000s (Gen Z/Alpha) group, representing 50% of guests.
Recommendations for Hosts
- Balance marketing efforts between domestic and international channels based on the guest mix.
- Tailor amenities and listing descriptions to appeal to the dominant Post-2000s (Gen Z/Alpha) demographic (e.g., highlight fast WiFi, smart home features, local guides).
- Highlight unique local experiences or amenities relevant to the primary guest profile.
- Consider seasonal promotions aligned with peak travel times for key origin markets.
Nearby Short-Term Rental Market Comparison
How does the Segovia Airbnb market stack up against its neighbors? Compare key performance metrics like average monthly revenue, ADR, and occupancy rates in surrounding areas to understand the broader regional STR landscape.
| Market | Active Properties | Monthly Revenue | Daily Rate | Avg. Occupancy |
|---|---|---|---|---|
| Robledo de Chavela | 24 | $3,250 | $290.52 | 40% |
| Ortigosa del Monte | 11 | $3,026 | $348.22 | 35% |
| Argés | 24 | $2,969 | $274.34 | 37% |
| Guadamur | 32 | $2,895 | $273.54 | 38% |
| Méntrida | 12 | $2,825 | $373.67 | 31% |
| Santa Cruz del Retamar | 13 | $2,715 | $450.25 | 27% |
| Torrelodones | 15 | $2,696 | $583.52 | 31% |
| El Espinar | 34 | $2,666 | $335.59 | 34% |
| Olías del Rey | 11 | $2,648 | $294.70 | 43% |
| Pelayos de la Presa | 13 | $2,539 | $308.49 | 34% |