Caravia Airbnb Market Analysis 2025: Short Term Rental Data & Vacation Rental Statistics in Caravia, Spain
Is Airbnb profitable in Caravia in 2025? Explore comprehensive Airbnb analytics for Caravia, Caravia, Spain to uncover income potential. This 2025 STR market report for Caravia, based on AirROI data from June 2024 to May 2025, reveals key trends in the niche market of 27 active listings.
Whether you're considering an Airbnb investment in Caravia, optimizing your existing vacation rental, or exploring rental arbitrage opportunities, understanding the Caravia Airbnb data is crucial. Navigating the high regulation landscape is key to maximizing your short term rental income potential. Let's dive into the specifics.
Key Caravia Airbnb Performance Metrics Overview
Monthly Airbnb Revenue Variations & Income Potential in Caravia (2025)
Understanding the monthly revenue variations for Airbnb listings in Caravia is key to maximizing your short term rental income potential. Seasonality significantly impacts earnings. Our analysis, based on data from the past 12 months, shows that the peak revenue month for STRs in Caravia is typically August, while January often presents the lowest earnings, highlighting opportunities for strategic pricing adjustments during shoulder and low seasons. Explore the typical Airbnb income in Caravia across different performance tiers:
- Best-in-class properties (Top 10%) achieve $3,211+ monthly, often utilizing dynamic pricing and superior guest experiences.
- Strong performing properties (Top 25%) earn $2,313 or more, indicating effective management and desirable locations/amenities.
- Typical properties (Median) generate around $1,216 per month, representing the average market performance.
- Entry-level properties (Bottom 25%) see earnings around $734, often with potential for optimization.
Average Monthly Airbnb Earnings Trend in Caravia
Caravia Airbnb Occupancy Rate Trends (2025)
Maximize your bookings by understanding the Caravia STR occupancy trends. Seasonal demand shifts significantly influence how often properties are booked. Typically, Julysees the highest demand (peak season occupancy), while January experiences the lowest (low season). Effective strategies, like adjusting minimum stays or offering promotions, can boost occupancy during slower periods. Here's how different property tiers perform in Caravia:
- Best-in-class properties (Top 10%) achieve 69%+ occupancy, indicating high desirability and potentially optimized availability.
- Strong performing properties (Top 25%) maintain 44% or higher occupancy, suggesting good market fit and guest satisfaction.
- Typical properties (Median) have an occupancy rate around 29%.
- Entry-level properties (Bottom 25%) average 18% occupancy, potentially facing higher vacancy.
Average Monthly Occupancy Rate Trend in Caravia
Average Daily Rate (ADR) Airbnb Trends in Caravia (2025)
Effective short term rental pricing strategy in Caravia involves understanding monthly ADR fluctuations. The Average Daily Rate (ADR) for Airbnb in Caravia typically peaks in May and dips lowest during November. Leveraging Airbnb dynamic pricing tools or strategies based on this seasonality can significantly boost revenue. Here's a look at the typical nightly rates achieved:
- Best-in-class properties (Top 10%) command rates of $498+ per night, often due to premium features or locations.
- Strong performing properties (Top 25%) achieve nightly rates of $234 or more.
- Typical properties (Median) charge around $148 per night.
- Entry-level properties (Bottom 25%) earn around $93 per night.
Average Daily Rate (ADR) Trend by Month in Caravia
Get Live Caravia Market Intelligence 👇

Explore Real-time Analytics
Airbnb Seasonality Analysis & Trends in Caravia (2025)
Peak Season (August, July, September)
- Revenue averages $2,952 per month
- Occupancy rates average 55.1%
- Daily rates average $211
Shoulder Season
- Revenue averages $1,318 per month
- Occupancy maintains around 31.6%
- Daily rates hold near $203
Low Season (January, May, December)
- Revenue drops to average $784 per month
- Occupancy decreases to average 16.8%
- Daily rates adjust to average $206
Seasonality Insights for Caravia
- The Airbnb seasonality in Caravia shows highly seasonal trends requiring careful strategy. While the sections above show seasonal averages, it's also insightful to look at the extremes:
- During the high season, the absolute peak month showcases Caravia's highest earning potential, with monthly revenues capable of climbing to $3,999, occupancy reaching a high of 63.2%, and ADRs peaking at $218.
- Conversely, the slowest single month of the year, typically falling within the low season, marks the market's lowest point. In this month, revenue might dip to $598, occupancy could drop to 13.3%, and ADRs may adjust down to $198.
- Understanding both the seasonal averages and these monthly peaks and troughs in revenue, occupancy, and ADR is crucial for maximizing your Airbnb profit potential in Caravia.
Seasonal Strategies for Maximizing Profit
- Peak Season: Maximize revenue through premium pricing and potentially longer minimum stays. Ensure high availability.
- Low Season: Offer competitive pricing, special promotions (e.g., extended stay discounts), and flexible cancellation policies. Target off-season travelers like remote workers or budget-conscious guests.
- Shoulder Seasons: Implement dynamic pricing that balances peak and low rates. Target weekend travelers or specific events. Offer slightly more flexible terms than peak season.
- Regularly analyze your own performance against these Caravia seasonality benchmarks and adjust your pricing and availability strategy accordingly.
Best Areas for Airbnb Investment in Caravia (2025)
Exploring the top neighborhoods for short-term rentals in Caravia? This section highlights key areas, outlining why they are attractive for hosts and guests, along with notable local attractions. Consider these locations based on your target guest profile and investment strategy.
| Neighborhood / Area | Why Host Here? (Target Guests & Appeal) | Key Attractions & Landmarks |
|---|---|---|
| Caravia Beach | A stunning coastal area with beautiful sandy beaches, ideal for sunbathers and water sports enthusiasts. Attracts families and beachgoers seeking a relaxing getaway. | Caravia Beach, Playa de La Griega, Cliffs of San Esteban, Water sports activities, Beachfront restaurants |
| Pueblo de Caravia | Charming village atmosphere that draws tourists looking for culture and local experiences. Ideal for travelers who want to experience authentic Asturias. | Local artisan shops, Asturian cuisine restaurants, Cultural festivals, Natural parks nearby, Historic architecture |
| La Isla | A scenic coastal area known for its natural beauty and tranquility. Perfect for those looking for a peaceful escape while still being close to nature. | Natural landscapes, Hiking trails, Secluded beaches, Birdwatching spots, Fishing areas |
| Colunga | Nearby town that serves as a gateway to the Jurassic Coast. It appeals to families and history enthusiasts looking to explore geological experiences. | Jurassic Museum of Asturias, Beaches of Colunga, Coves and cliffs, Nearby traditional villages, Local gastronomy |
| Villaviciosa | A picturesque town known for its cider production and lush surroundings. Attractive for visitors interested in culinary tourism and local traditions. | Cider houses, Sierra del Sueve mountains, Villaviciosa estuary, Cultural heritage, Local markets |
| Llastres | A small fishing village with beautiful views, seafood restaurants, and traditional Asturian culture. Ideal for those wanting an authentic coastal experience. | Llastres beach, Fish market, Seafront promenade, Traditional architecture, Local seafood restaurants |
| El Fito | Known for its scenic lookout points and hiking trails. Perfect for nature lovers and active travelers looking to explore the natural environment of Asturias. | Mirador del Fito, Hiking routes, Biodiversity, Outdoor activities, Scenic views |
| Cangas de Onís | A historical town known for its Roman bridge and as a gateway to the Picos de Europa. Attracts visitors interested in adventure sports and nature. | Roman bridge, Torre de la Iglesia, Picos de Europa National Park, Outdoor activities, Local cuisine |
Understanding Airbnb License Requirements & STR Laws in Caravia (2025)
Yes, Caravia, Caravia, Spain enforces high STR regulations. Obtaining a license and ensuring compliance is almost certainly required according to current 2025 STR laws. Always verify the latest short term rental regulations and Airbnb license requirements directly with local government authorities for Caravia to ensure full compliance before hosting.
(Source: AirROI data, 2025, based on 33% licensed listings)
Top Performing Airbnb Properties in Caravia (2025)
Benchmark your potential! Explore examples of top-performing Airbnb properties in Caraviabased on Trailing Twelve Month (TTM) revenue. Analyze their characteristics, revenue, occupancy rate, and ADR to understand what drives success in this market.
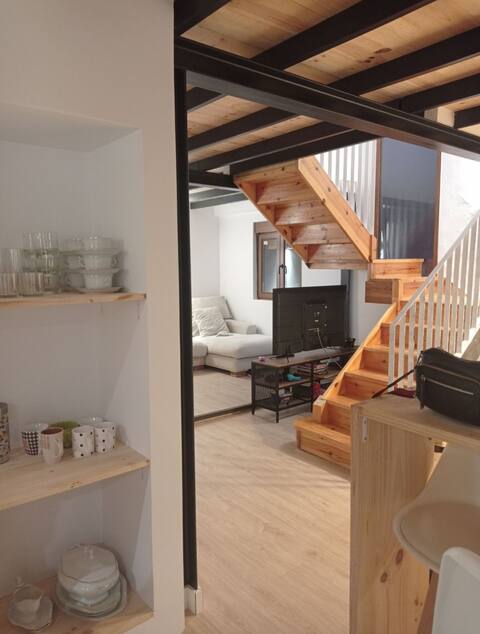
Fabulous designed flat close to sea and mountain
Entire Place • 2 bedrooms
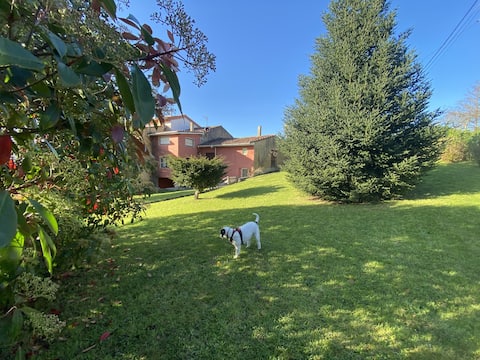
Cottage style house with garden between beach and mountain
Entire Place • 4 bedrooms
La Casina de Pichi
Entire Place • 4 bedrooms

Casa vacacional Ris
Entire Place • 3 bedrooms
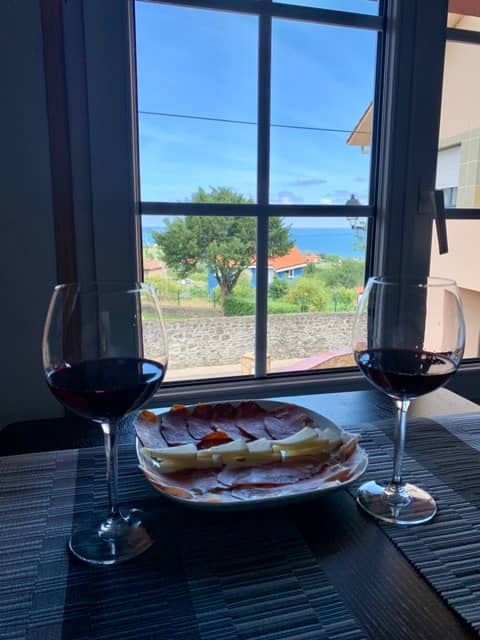
Casa TODAH, Playas and mountains
Entire Place • 2 bedrooms
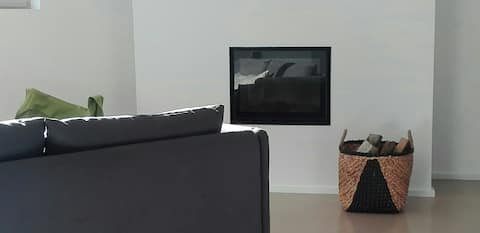
Nice townhouse between beaches and mountains
Entire Place • 2 bedrooms
Note: Performance varies based on location, size, amenities, seasonality, and management quality. Data reflects the past 12 months.
Top Performing Airbnb Hosts in Caravia (2025)
Learn from the best! This table showcases top-performing Airbnb hosts in Caravia based on the number of properties managed and estimated total revenue over the past year. Analyze their scale and performance metrics.
| Host Name | Properties | Grossing Revenue | Stay Reviews | Avg Rating |
|---|---|---|---|---|
| Julian | 2 | $40,169 | 21 | 4.91/5.0 |
| Montserrat | 2 | $31,542 | 78 | 4.87/5.0 |
| Cristina | 1 | $30,739 | 69 | 4.90/5.0 |
| Host #385640017 | 2 | $28,548 | 0 | Not Rated |
| Covadonga | 1 | $23,500 | 22 | 4.91/5.0 |
| Host #42315723 | 1 | $19,513 | 0 | Not Rated |
| Juan Carlos | 1 | $19,281 | 26 | 4.77/5.0 |
| Maria Jose | 1 | $18,549 | 12 | 4.92/5.0 |
| R2R Consulting | 3 | $17,510 | 38 | 4.17/5.0 |
| Federico | 1 | $16,504 | 6 | 5.00/5.0 |
Analyzing the strategies of top hosts, such as their property selection, pricing, and guest communication, can offer valuable lessons for optimizing your own Airbnb operations in Caravia.
Dive Deeper: Advanced Caravia STR Market Data (2025)
Ready to unlock more insights? AirROI provides access to advanced metrics and comprehensive Airbnb data for Caravia. Explore detailed analytics beyond this report to refine your investment strategy, optimize pricing, and maximize your vacation rental profits.
Explore Advanced MetricsCaravia Short-Term Rental Market Composition (2025): Property & Room Types
Room Type Distribution
Property Type Distribution
Market Composition Insights for Caravia
- The Caravia Airbnb market composition is heavily skewed towards Entire Home/Apt listings, which make up 100% of the 27 active rentals. This indicates strong guest preference for privacy and space.
- Looking at the property type distribution in Caravia, House properties are the most common (63%), reflecting the local real estate landscape.
- Houses represent a significant 63% portion, catering likely to families or larger groups.
Caravia Airbnb Room Capacity Analysis (2025): Bedroom Distribution
Distribution of Listings by Number of Bedrooms
Room Capacity Insights for Caravia
- The dominant room capacity in Caravia is 2 bedrooms listings, making up 33.3% of the market. This suggests a strong demand for properties suitable for couples or solo travelers.
- Together, 2 bedrooms and 3 bedrooms properties represent 62.9% of the active Airbnb listings in Caravia, indicating a high concentration in these sizes.
- A significant 48.1% of listings offer 3+ bedrooms, catering to larger groups and families seeking more space in Caravia.
Caravia Vacation Rental Guest Capacity Trends (2025)
Distribution of Listings by Guest Capacity
Guest Capacity Insights for Caravia
- The most common guest capacity trend in Caravia vacation rentals is listings accommodating 6 guests (25.9%). This suggests the primary traveler segment is likely larger groups.
- Properties designed for 6 guests and 4 guests dominate the Caravia STR market, accounting for 48.1% of listings.
- 48.1% of properties accommodate 6+ guests, serving the market segment for larger families or group travel in Caravia.
- On average, properties in Caravia are equipped to host 5.1 guests.
Caravia Airbnb Booking Patterns (2025): Available vs. Booked Days
Available Days Distribution
Booked Days Distribution
Booking Pattern Insights for Caravia
- The most common availability pattern in Caravia falls within the 271-366 days range, representing 70.4% of listings. This suggests many properties have significant open periods on their calendars.
- Approximately 92.6% of listings show high availability (181+ days open annually), indicating potential for increased bookings or specific owner usage patterns.
- For booked days, the 31-90 days range is most frequent in Caravia (51.9%), reflecting common guest stay durations or potential owner blocking patterns.
- A notable 7.4% of properties secure long booking periods (181+ days booked per year), highlighting successful long-term rental strategies or significant owner usage.
Caravia Airbnb Minimum Stay Requirements Analysis
Distribution of Listings by Minimum Night Requirement
1 Night
1 listings
3.8% of total
2 Nights
7 listings
26.9% of total
3 Nights
5 listings
19.2% of total
4-6 Nights
8 listings
30.8% of total
30+ Nights
5 listings
19.2% of total
Key Insights
- The most prevalent minimum stay requirement in Caravia is 4-6 Nights, adopted by 30.8% of listings. This highlights the market's preference for longer commitments.
- A significant segment (19.2%) caters to monthly stays (30+ nights) in Caravia, pointing to opportunities in the extended-stay market.
Recommendations
- Align with the market by considering a 4-6 Nights minimum stay, as 30.8% of Caravia hosts use this setting.
- If feasible, allowing 1-night stays, especially midweek or during low season, could capture last-minute bookings, as only 3.8% currently do.
- Explore offering discounts for stays of 30+ nights to attract the 19.2% of the market seeking extended stays.
- Adjust minimum nights based on seasonality – potentially shorter during low season and longer during peak demand periods in Caravia.
Caravia Airbnb Cancellation Policy Trends Analysis (2025)
Flexible
3 listings
13.6% of total
Moderate
6 listings
27.3% of total
Firm
10 listings
45.5% of total
Strict
3 listings
13.6% of total
Cancellation Policy Insights for Caravia
- The prevailing Airbnb cancellation policy trend in Caravia is Firm, used by 45.5% of listings.
- A majority (59.1%) of hosts in Caravia utilize Firm or Strict policies, indicating a market where hosts prioritize booking security.
Recommendations for Hosts
- Consider adopting a Firm policy to align with the 45.5% market standard in Caravia.
- Using a Strict policy might deter some guests, as only 13.6% of listings use it. Evaluate if potential revenue protection outweighs possible lower booking rates.
- Regularly review your cancellation policy against competitors and market demand shifts in Caravia.
Caravia STR Booking Lead Time Analysis (2025)
Average Booking Lead Time by Month
Booking Lead Time Insights for Caravia
- The overall average booking lead time for vacation rentals in Caravia is 36 days.
- Guests book furthest in advance for stays during June (average 77 days), likely coinciding with peak travel demand or local events.
- The shortest booking windows occur for stays in February (average 9 days), indicating more last-minute travel plans during this time.
- Seasonally, Summer (61 days avg.) sees the longest lead times, while Winter (17 days avg.) has the shortest, reflecting typical travel planning cycles.
Recommendations for Hosts
- Use the overall average lead time (36 days) as a baseline for your pricing and availability strategy in Caravia.
- For June stays, consider implementing length-of-stay discounts or slightly higher rates for bookings made less than 77 days out to capitalize on advance planning.
- During February, focus on last-minute booking availability and promotions, as guests book with very short notice (9 days avg.).
- Target marketing efforts for the Summer season well in advance (at least 61 days) to capture early planners.
- Monitor your own booking lead times against these Caravia averages to identify opportunities for dynamic pricing adjustments.
Popular & Essential Airbnb Amenities in Caravia (2025)
Amenity Prevalence
Amenity Insights for Caravia
- Essential amenities in Caravia that guests expect include: Kitchen, Heating, TV. Lacking these (any) could significantly impact bookings.
- Popular amenities like Hot water, Washer, Free parking on premises are common but not universal. Offering these can provide a competitive edge.
Recommendations for Hosts
- Ensure your listing includes all essential amenities for Caravia: Kitchen, Heating, TV.
- Prioritize adding missing essentials: TV.
- Consider adding popular differentiators like Hot water or Washer to increase appeal.
- Highlight unique or less common amenities you offer (e.g., hot tub, dedicated workspace, EV charger) in your listing description and photos.
- Regularly check competitor amenities in Caravia to stay competitive.
Caravia Airbnb Guest Demographics & Profile Analysis (2025)
Guest Profile Summary for Caravia
- The typical guest profile for Airbnb in Caravia consists of primarily domestic travelers (73%), often arriving from nearby Madrid, typically belonging to the Post-2000s (Gen Z/Alpha) group (50%), primarily speaking Spanish or English.
- Domestic travelers account for 73.0% of guests.
- Key international markets include Spain (73%) and France (7.9%).
- Top languages spoken are Spanish (42.6%) followed by English (36.2%).
- A significant demographic segment is the Post-2000s (Gen Z/Alpha) group, representing 50% of guests.
Recommendations for Hosts
- Target domestic marketing efforts towards travelers from Madrid and Barcelona.
- Tailor amenities and listing descriptions to appeal to the dominant Post-2000s (Gen Z/Alpha) demographic (e.g., highlight fast WiFi, smart home features, local guides).
- Highlight unique local experiences or amenities relevant to the primary guest profile.
- Consider seasonal promotions aligned with peak travel times for key origin markets.
Nearby Short-Term Rental Market Comparison
How does the Caravia Airbnb market stack up against its neighbors? Compare key performance metrics like average monthly revenue, ADR, and occupancy rates in surrounding areas to understand the broader regional STR landscape.
| Market | Active Properties | Monthly Revenue | Daily Rate | Avg. Occupancy |
|---|---|---|---|---|
| Molledo | 13 | $1,489 | $225.86 | 32% |
| Llanera | 17 | $1,451 | $218.81 | 36% |
| Hermandad de Campoo de Suso | 32 | $1,382 | $361.15 | 19% |
| Villaviciosa | 236 | $1,311 | $192.65 | 38% |
| Mazcuerras | 27 | $1,307 | $211.46 | 34% |
| Camaleño | 86 | $1,227 | $131.02 | 43% |
| Reocín | 40 | $1,191 | $159.70 | 40% |
| Candamo | 12 | $1,162 | $194.63 | 36% |
| Cillorigo de Liébana | 67 | $1,146 | $167.63 | 35% |
| Valdáliga | 86 | $1,141 | $231.67 | 31% |