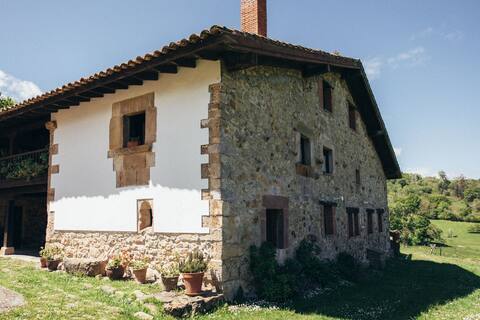
Herrerías Airbnb Market Analysis 2026: Short Term Rental Data & Vacation Rental Statistics in Cantabria, Spain
Is Airbnb profitable in Herrerías in 2026? Explore comprehensive Airbnb analytics for Herrerías, Cantabria, Spain to uncover income potential. This 2026 STR market report for Herrerías, based on AirROI data from February 2025 to January 2026, reveals key trends in the niche market of 18 active listings.
Whether you're considering an Airbnb investment in Herrerías, optimizing your existing vacation rental, or exploring rental arbitrage opportunities, understanding the Herrerías Airbnb data is crucial. Navigating the high regulation landscape is key to maximizing your short term rental income potential. Let's dive into the specifics.
Key Herrerías Airbnb Performance Metrics Overview
Monthly Airbnb Revenue Variations & Income Potential in Herrerías (2026)
Understanding the monthly revenue variations for Airbnb listings in Herrerías is key to maximizing your short term rental income potential. Seasonality significantly impacts earnings. Our analysis, based on data from the past 12 months, shows that the peak revenue month for STRs in Herrerías is typically July, while February often presents the lowest earnings, highlighting opportunities for strategic pricing adjustments during shoulder and low seasons. Explore the typical Airbnb income in Herrerías across different performance tiers:
- Best-in-class properties (Top 10%) achieve $3,529+ monthly, often utilizing dynamic pricing and superior guest experiences.
- Strong performing properties (Top 25%) earn $2,128 or more, indicating effective management and desirable locations/amenities.
- Typical properties (Median) generate around $1,214 per month, representing the average market performance.
- Entry-level properties (Bottom 25%) see earnings around $577, often with potential for optimization.
Average Monthly Airbnb Earnings Trend in Herrerías
Herrerías Airbnb Occupancy Rate Trends (2026)
Maximize your bookings by understanding the Herrerías STR occupancy trends. Seasonal demand shifts significantly influence how often properties are booked. Typically, Julysees the highest demand (peak season occupancy), while February experiences the lowest (low season). Effective strategies, like adjusting minimum stays or offering promotions, can boost occupancy during slower periods. Here's how different property tiers perform in Herrerías:
- Best-in-class properties (Top 10%) achieve 58%+ occupancy, indicating high desirability and potentially optimized availability.
- Strong performing properties (Top 25%) maintain 41% or higher occupancy, suggesting good market fit and guest satisfaction.
- Typical properties (Median) have an occupancy rate around 24%.
- Entry-level properties (Bottom 25%) average 11% occupancy, potentially facing higher vacancy.
Average Monthly Occupancy Rate Trend in Herrerías
Average Daily Rate (ADR) Airbnb Trends in Herrerías (2026)
Effective short term rental pricing strategy in Herrerías involves understanding monthly ADR fluctuations. The Average Daily Rate (ADR) for Airbnb in Herrerías typically peaks in January and dips lowest during April. Leveraging Airbnb dynamic pricing tools or strategies based on this seasonality can significantly boost revenue. Here's a look at the typical nightly rates achieved:
- Best-in-class properties (Top 10%) command rates of $361+ per night, often due to premium features or locations.
- Strong performing properties (Top 25%) achieve nightly rates of $170 or more.
- Typical properties (Median) charge around $125 per night.
- Entry-level properties (Bottom 25%) earn around $106 per night.
Average Daily Rate (ADR) Trend by Month in Herrerías
Get Live Herrerías Market Intelligence 👇
Explore Real-time Analytics
Airbnb Seasonality Analysis & Trends in Herrerías (2026)
Peak Season (July, December, August)
- Revenue averages $2,583 per month
- Occupancy rates average 46.9%
- Daily rates average $170
Shoulder Season
- Revenue averages $1,464 per month
- Occupancy maintains around 27.0%
- Daily rates hold near $163
Low Season (January, February, November)
- Revenue drops to average $597 per month
- Occupancy decreases to average 10.9%
- Daily rates adjust to average $168
Seasonality Insights for Herrerías
- The Airbnb seasonality in Herrerías shows highly seasonal trends requiring careful strategy. While the sections above show seasonal averages, it's also insightful to look at the extremes:
- During the high season, the absolute peak month showcases Herrerías's highest earning potential, with monthly revenues capable of climbing to $2,815, occupancy reaching a high of 54.3%, and ADRs peaking at $176.
- Conversely, the slowest single month of the year, typically falling within the low season, marks the market's lowest point. In this month, revenue might dip to $288, occupancy could drop to 6.4%, and ADRs may adjust down to $157.
- Understanding both the seasonal averages and these monthly peaks and troughs in revenue, occupancy, and ADR is crucial for maximizing your Airbnb profit potential in Herrerías.
Seasonal Strategies for Maximizing Profit
- Peak Season: Maximize revenue through premium pricing and potentially longer minimum stays. Ensure high availability.
- Low Season: Offer competitive pricing, special promotions (e.g., extended stay discounts), and flexible cancellation policies. Target off-season travelers like remote workers or budget-conscious guests.
- Shoulder Seasons: Implement dynamic pricing that balances peak and low rates. Target weekend travelers or specific events. Offer slightly more flexible terms than peak season.
- Regularly analyze your own performance against these Herrerías seasonality benchmarks and adjust your pricing and availability strategy accordingly.
Best Areas for Airbnb Investment in Herrerías (2026)
Exploring the top neighborhoods for short-term rentals in Herrerías? This section highlights key areas, outlining why they are attractive for hosts and guests, along with notable local attractions. Consider these locations based on your target guest profile and investment strategy.
| Neighborhood / Area | Why Host Here? (Target Guests & Appeal) | Key Attractions & Landmarks |
|---|---|---|
| Herrerías Village | Charming village known for its picturesque landscapes and proximity to the Picos de Europa National Park. Ideal for nature lovers and those seeking a tranquil escape from city life. | Picos de Europa, Cares Gorge, Herrerías Stone Bridge, Cueva del Soplao, Local hiking trails |
| Sama de Grado | A quaint area that offers visitors a taste of rural Cantabrian life with stunning views and local gastronomy. Perfect for tourists seeking an authentic experience. | Sama de Grado Park, Local markets, Traditional Cantabrian cuisine, Cultural festivals in summer, Rural tourism |
| San Vicente de la Barquera | Coastal town renowned for its beautiful beaches and stunning natural scenery. Popular for beachgoers and water sports enthusiasts. | San Vicente Beach, Historical castle, Wildlife watching, Cultural heritage sites, Local seafood restaurants |
| Potes | Picturesque town at the entrance to the Picos de Europa, known for its medieval architecture and vibrant streets. Attracts hikers and cultural enthusiasts. | Monastery of Santo Domingo, Local shops and eateries, Hiking trails, Viewpoints of the mountains, Cultural events |
| Liérganes | Fabled village known for its charming architecture and healing waters. Offers a blend of history and wellness tourism, suitable for guests seeking relaxation. | Historical architecture, Natural springs, Local legends, Riverside walks, Wellness retreats |
| Cabuérniga | A beautiful valley area surrounded by green mountain landscapes. Noted for its calm atmosphere, perfect for rural tourism and family vacations. | Cabuérniga Valley, Wildlife trails, Traditional farms, Cultural history, Local fairs and markets |
| Val de San Vicente | Region characterized by its beautiful coastline and rural charm. Great for those wanting to explore both nature and beach activities. | Beaches of Val de San Vicente, Natural parks, Surfing spots, Fishing villages, Scenic viewpoints |
| Comillas | A historic town with rich architecture and a stunning coastal view. Attracts culture lovers and beachgoers alike, offering unique local experiences. | Gaudí's El Capricho, Comillas Beach, Historical buildings, Art exhibitions, Gardens and parks |
Understanding Airbnb License Requirements & STR Laws in Herrerías (2026)
Yes, Herrerías, Cantabria, Spain enforces high STR regulations. Obtaining a license and ensuring compliance is almost certainly required according to current 2026 STR laws. Always verify the latest short term rental regulations and Airbnb license requirements directly with local government authorities for Herrerías to ensure full compliance before hosting.
(Source: AirROI data, 2026, based on 44% licensed listings)
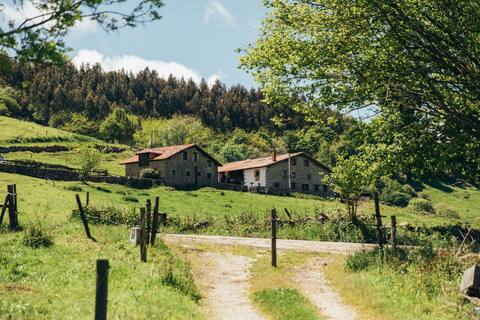
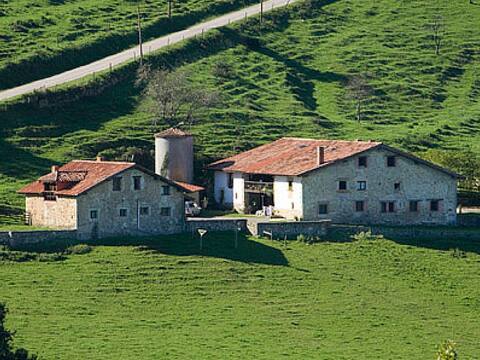
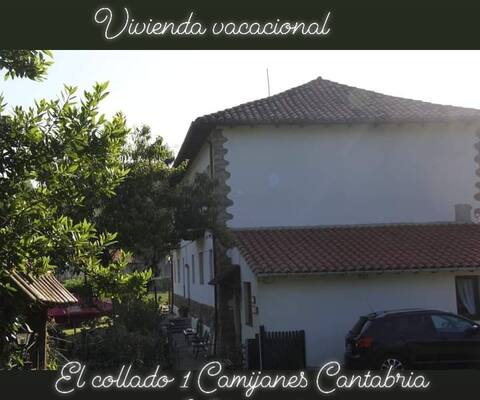
Top Performing Airbnb Properties in Herrerías (2026)
Benchmark your potential! Explore examples of top-performing Airbnb properties in Herreríasbased on Trailing Twelve Month (TTM) revenue. Analyze their characteristics, revenue, occupancy rate, and ADR to understand what drives success in this market.
Primorías Camijanes, complete set for 18 people
Entire Place • 9 bedrooms
Primorías Camijanes, 8 seats, 15km from San Vicente
Entire Place • 4 bedrooms

Country house with pool, nature reserve, relaxation
Entire Place • 3 bedrooms
Anca Manue
Entire Place • 1 bedroom

Enjoy the sea and the mountains
Entire Place • 2 bedrooms
Primorías Camijanes, group of 14 on a farm
Entire Place • 7 bedrooms
Note: Performance varies based on location, size, amenities, seasonality, and management quality. Data reflects the past 12 months.
Top Performing Airbnb Hosts in Herrerías (2026)
Learn from the best! This table showcases top-performing Airbnb hosts in Herrerías based on the number of properties managed and estimated total revenue over the past year. Analyze their scale and performance metrics.
| Host Name | Properties | Grossing Revenue | Stay Reviews | Avg Rating |
|---|---|---|---|---|
| Casas Primorías | 5 | $90,312 | 87 | 4.80/5.0 |
| Carmen | 2 | $35,075 | 57 | 4.82/5.0 |
| Gabriela | 1 | $14,808 | 50 | 4.76/5.0 |
| Santos | 2 | $13,666 | 82 | 4.92/5.0 |
| Anabel | 1 | $9,372 | 54 | 4.37/5.0 |
| Maria Elena | 1 | $6,322 | 38 | 4.68/5.0 |
| Alquileres Turísticos Amvaz S | 1 | $3,801 | 3 | 4.33/5.0 |
| Guillermo | 1 | $2,436 | 14 | 4.71/5.0 |
| Victor - Interhome | 2 | $2,340 | 12 | 4.22/5.0 |
| Patricia | 1 | $679 | 15 | 4.27/5.0 |
Analyzing the strategies of top hosts, such as their property selection, pricing, and guest communication, can offer valuable lessons for optimizing your own Airbnb operations in Herrerías.
Dive Deeper: Advanced Herrerías STR Market Data (2026)
Ready to unlock more insights? AirROI provides access to advanced metrics and comprehensive Airbnb data for Herrerías. Explore detailed analytics beyond this report to refine your investment strategy, optimize pricing, and maximize your vacation rental profits.
Explore Advanced MetricsHerrerías Short-Term Rental Market Composition (2026): Property & Room Types
Room Type Distribution
Property Type Distribution
Market Composition Insights for Herrerías
- The Herrerías Airbnb market composition is heavily skewed towards Entire Home/Apt listings, which make up 94.4% of the 18 active rentals. This indicates strong guest preference for privacy and space.
- Looking at the property type distribution in Herrerías, House properties are the most common (83.3%), reflecting the local real estate landscape.
- Houses represent a significant 83.3% portion, catering likely to families or larger groups.
- The presence of 5.6% Hotel/Boutique listings indicates integration with traditional hospitality.
Herrerías Airbnb Room Capacity Analysis (2026): Bedroom Distribution
Distribution of Listings by Number of Bedrooms
Room Capacity Insights for Herrerías
- The dominant room capacity in Herrerías is 2 bedrooms listings, making up 50% of the market. This suggests a strong demand for properties suitable for couples or solo travelers.
- Together, 2 bedrooms and 3 bedrooms properties represent 66.7% of the active Airbnb listings in Herrerías, indicating a high concentration in these sizes.
- A significant 33.4% of listings offer 3+ bedrooms, catering to larger groups and families seeking more space in Herrerías.
Herrerías Vacation Rental Guest Capacity Trends (2026)
Distribution of Listings by Guest Capacity
Guest Capacity Insights for Herrerías
- The most common guest capacity trend in Herrerías vacation rentals is listings accommodating 4 guests (27.8%). This suggests the primary traveler segment is likely small families or groups.
- Properties designed for 4 guests and 6 guests dominate the Herrerías STR market, accounting for 44.5% of listings.
- 39.0% of properties accommodate 6+ guests, serving the market segment for larger families or group travel in Herrerías.
- On average, properties in Herrerías are equipped to host 5.1 guests.
Herrerías Airbnb Booking Patterns (2026): Available vs. Booked Days
Available Days Distribution
Booked Days Distribution
Booking Pattern Insights for Herrerías
- The most common availability pattern in Herrerías falls within the 271-366 days range, representing 77.8% of listings. This suggests many properties have significant open periods on their calendars.
- Approximately 94.5% of listings show high availability (181+ days open annually), indicating potential for increased bookings or specific owner usage patterns.
- For booked days, the 1-30 days range is most frequent in Herrerías (38.9%), reflecting common guest stay durations or potential owner blocking patterns.
- A notable 5.6% of properties secure long booking periods (181+ days booked per year), highlighting successful long-term rental strategies or significant owner usage.
Herrerías Airbnb Minimum Stay Requirements Analysis
Distribution of Listings by Minimum Night Requirement
1 Night
2 listings
11.1% of total
2 Nights
1 listings
5.6% of total
3 Nights
2 listings
11.1% of total
4-6 Nights
1 listings
5.6% of total
7-29 Nights
1 listings
5.6% of total
30+ Nights
11 listings
61.1% of total
Key Insights
- The most prevalent minimum stay requirement in Herrerías is 30+ Nights, adopted by 61.1% of listings. This highlights the market's preference for longer commitments.
- Very short stays (1-2 nights) are less common (16.7%), suggesting hosts prefer slightly longer bookings to optimize turnover.
- A significant segment (61.1%) caters to monthly stays (30+ nights) in Herrerías, pointing to opportunities in the extended-stay market.
Recommendations
- Align with the market by considering a 30+ Nights minimum stay, as 61.1% of Herrerías hosts use this setting.
- If feasible, allowing 1-night stays, especially midweek or during low season, could capture last-minute bookings, as only 11.1% currently do.
- Explore offering discounts for stays of 30+ nights to attract the 61.1% of the market seeking extended stays.
- Adjust minimum nights based on seasonality – potentially shorter during low season and longer during peak demand periods in Herrerías.
Herrerías Airbnb Cancellation Policy Trends Analysis (2026)
Super Strict 60 Days
2 listings
11.1% of total
Super Strict 30 Days
1 listings
5.6% of total
Flexible
3 listings
16.7% of total
Moderate
1 listings
5.6% of total
Firm
7 listings
38.9% of total
Strict
4 listings
22.2% of total
Cancellation Policy Insights for Herrerías
- The prevailing Airbnb cancellation policy trend in Herrerías is Firm, used by 38.9% of listings.
- A majority (61.1%) of hosts in Herrerías utilize Firm or Strict policies, indicating a market where hosts prioritize booking security.
Recommendations for Hosts
- Consider adopting a Firm policy to align with the 38.9% market standard in Herrerías.
- Regularly review your cancellation policy against competitors and market demand shifts in Herrerías.
Herrerías STR Booking Lead Time Analysis (2026)
Average Booking Lead Time by Month
Booking Lead Time Insights for Herrerías
- The overall average booking lead time for vacation rentals in Herrerías is 67 days.
- Guests book furthest in advance for stays during September (average 128 days), likely coinciding with peak travel demand or local events.
- The shortest booking windows occur for stays in January (average 0 days), indicating more last-minute travel plans during this time.
- Seasonally, Summer (87 days avg.) sees the longest lead times, while Winter (39 days avg.) has the shortest, reflecting typical travel planning cycles.
Recommendations for Hosts
- Use the overall average lead time (67 days) as a baseline for your pricing and availability strategy in Herrerías.
- For September stays, consider implementing length-of-stay discounts or slightly higher rates for bookings made less than 128 days out to capitalize on advance planning.
- During January, focus on last-minute booking availability and promotions, as guests book with very short notice (0 days avg.).
- Target marketing efforts for the Summer season well in advance (at least 87 days) to capture early planners.
- Monitor your own booking lead times against these Herrerías averages to identify opportunities for dynamic pricing adjustments.
Popular & Essential Airbnb Amenities in Herrerías (2026)
Amenity Prevalence
Amenity Insights for Herrerías
- Popular amenities like Washer, TV, Kitchen are common but not universal. Offering these can provide a competitive edge.
Recommendations for Hosts
- Consider adding popular differentiators like Washer or TV to increase appeal.
- Highlight unique or less common amenities you offer (e.g., hot tub, dedicated workspace, EV charger) in your listing description and photos.
- Regularly check competitor amenities in Herrerías to stay competitive.
Herrerías Airbnb Guest Demographics & Profile Analysis (2026)
Guest Profile Summary for Herrerías
- The typical guest profile for Airbnb in Herrerías consists of primarily domestic travelers (77%), often arriving from nearby Madrid, typically belonging to the Post-2000s (Gen Z/Alpha) group (50%), primarily speaking Spanish or English.
- Domestic travelers account for 77.3% of guests.
- Key international markets include Spain (77.3%) and France (9.1%).
- Top languages spoken are Spanish (37.5%) followed by English (31.3%).
- A significant demographic segment is the Post-2000s (Gen Z/Alpha) group, representing 50% of guests.
Recommendations for Hosts
- Target domestic marketing efforts towards travelers from Madrid and Pinto.
- Tailor amenities and listing descriptions to appeal to the dominant Post-2000s (Gen Z/Alpha) demographic (e.g., highlight fast WiFi, smart home features, local guides).
- Highlight unique local experiences or amenities relevant to the primary guest profile.
- Consider seasonal promotions aligned with peak travel times for key origin markets.
Nearby Short-Term Rental Market Comparison
How does the Herrerías Airbnb market stack up against its neighbors? Compare key performance metrics like average monthly revenue, ADR, and occupancy rates in surrounding areas to understand the broader regional STR landscape.
| Market | Active Properties | Monthly Revenue | Daily Rate | Avg. Occupancy |
|---|---|---|---|---|
| Quintanilla Vivar | 14 | $2,434 | $255.43 | 37% |
| Merindad de Sotoscueva | 11 | $2,194 | $245.63 | 38% |
| Hermandad de Campoo de Suso | 30 | $2,144 | $393.46 | 24% |
| Llanera | 14 | $2,037 | $274.76 | 39% |
| Getxo | 125 | $2,016 | $179.87 | 45% |
| Villacarriedo | 26 | $2,015 | $242.29 | 37% |
| Santiurde de Toranzo | 10 | $1,942 | $238.54 | 34% |
| Aiarako kuadrilla/Cuadrilla de Ayala | 19 | $1,892 | $205.04 | 37% |
| Liérganes | 53 | $1,818 | $216.14 | 36% |
| Bareyo | 12 | $1,787 | $222.00 | 41% |