Sant Lluís Airbnb Market Analysis 2026: Short Term Rental Data & Vacation Rental Statistics in Balearic Islands, Spain
Is Airbnb profitable in Sant Lluís in 2026? Explore comprehensive Airbnb analytics for Sant Lluís, Balearic Islands, Spain to uncover income potential. This 2026 STR market report for Sant Lluís, based on AirROI data from February 2025 to January 2026, reveals key trends in the niche market of 144 active listings.
Whether you're considering an Airbnb investment in Sant Lluís, optimizing your existing vacation rental, or exploring rental arbitrage opportunities, understanding the Sant Lluís Airbnb data is crucial. Navigating the high regulation landscape is key to maximizing your short term rental income potential. Let's dive into the specifics.
Key Sant Lluís Airbnb Performance Metrics Overview
Monthly Airbnb Revenue Variations & Income Potential in Sant Lluís (2026)
Understanding the monthly revenue variations for Airbnb listings in Sant Lluís is key to maximizing your short term rental income potential. Seasonality significantly impacts earnings. Our analysis, based on data from the past 12 months, shows that the peak revenue month for STRs in Sant Lluís is typically August, while February often presents the lowest earnings, highlighting opportunities for strategic pricing adjustments during shoulder and low seasons. Explore the typical Airbnb income in Sant Lluís across different performance tiers:
- Best-in-class properties (Top 10%) achieve $10,677+ monthly, often utilizing dynamic pricing and superior guest experiences.
- Strong performing properties (Top 25%) earn $6,288 or more, indicating effective management and desirable locations/amenities.
- Typical properties (Median) generate around $3,686 per month, representing the average market performance.
- Entry-level properties (Bottom 25%) see earnings around $2,016, often with potential for optimization.
Average Monthly Airbnb Earnings Trend in Sant Lluís
Sant Lluís Airbnb Occupancy Rate Trends (2026)
Maximize your bookings by understanding the Sant Lluís STR occupancy trends. Seasonal demand shifts significantly influence how often properties are booked. Typically, Augustsees the highest demand (peak season occupancy), while January experiences the lowest (low season). Effective strategies, like adjusting minimum stays or offering promotions, can boost occupancy during slower periods. Here's how different property tiers perform in Sant Lluís:
- Best-in-class properties (Top 10%) achieve 75%+ occupancy, indicating high desirability and potentially optimized availability.
- Strong performing properties (Top 25%) maintain 60% or higher occupancy, suggesting good market fit and guest satisfaction.
- Typical properties (Median) have an occupancy rate around 40%.
- Entry-level properties (Bottom 25%) average 23% occupancy, potentially facing higher vacancy.
Average Monthly Occupancy Rate Trend in Sant Lluís
Average Daily Rate (ADR) Airbnb Trends in Sant Lluís (2026)
Effective short term rental pricing strategy in Sant Lluís involves understanding monthly ADR fluctuations. The Average Daily Rate (ADR) for Airbnb in Sant Lluís typically peaks in July and dips lowest during April. Leveraging Airbnb dynamic pricing tools or strategies based on this seasonality can significantly boost revenue. Here's a look at the typical nightly rates achieved:
- Best-in-class properties (Top 10%) command rates of $832+ per night, often due to premium features or locations.
- Strong performing properties (Top 25%) achieve nightly rates of $515 or more.
- Typical properties (Median) charge around $323 per night.
- Entry-level properties (Bottom 25%) earn around $190 per night.
Average Daily Rate (ADR) Trend by Month in Sant Lluís
Get Live Sant Lluís Market Intelligence 👇

Explore Real-time Analytics
Airbnb Seasonality Analysis & Trends in Sant Lluís (2026)
Peak Season (August, July, June)
- Revenue averages $9,443 per month
- Occupancy rates average 63.7%
- Daily rates average $514
Shoulder Season
- Revenue averages $4,229 per month
- Occupancy maintains around 43.8%
- Daily rates hold near $389
Low Season (January, February, December)
- Revenue drops to average $1,284 per month
- Occupancy decreases to average 17.2%
- Daily rates adjust to average $403
Seasonality Insights for Sant Lluís
- The Airbnb seasonality in Sant Lluís shows highly seasonal trends requiring careful strategy. While the sections above show seasonal averages, it's also insightful to look at the extremes:
- During the high season, the absolute peak month showcases Sant Lluís's highest earning potential, with monthly revenues capable of climbing to $11,180, occupancy reaching a high of 71.3%, and ADRs peaking at $534.
- Conversely, the slowest single month of the year, typically falling within the low season, marks the market's lowest point. In this month, revenue might dip to $1,137, occupancy could drop to 13.2%, and ADRs may adjust down to $358.
- Understanding both the seasonal averages and these monthly peaks and troughs in revenue, occupancy, and ADR is crucial for maximizing your Airbnb profit potential in Sant Lluís.
Seasonal Strategies for Maximizing Profit
- Peak Season: Maximize revenue through premium pricing and potentially longer minimum stays. Ensure high availability.
- Low Season: Offer competitive pricing, special promotions (e.g., extended stay discounts), and flexible cancellation policies. Target off-season travelers like remote workers or budget-conscious guests.
- Shoulder Seasons: Implement dynamic pricing that balances peak and low rates. Target weekend travelers or specific events. Offer slightly more flexible terms than peak season.
- Regularly analyze your own performance against these Sant Lluís seasonality benchmarks and adjust your pricing and availability strategy accordingly.
Best Areas for Airbnb Investment in Sant Lluís (2026)
Exploring the top neighborhoods for short-term rentals in Sant Lluís? This section highlights key areas, outlining why they are attractive for hosts and guests, along with notable local attractions. Consider these locations based on your target guest profile and investment strategy.
| Neighborhood / Area | Why Host Here? (Target Guests & Appeal) | Key Attractions & Landmarks |
|---|---|---|
| Son Bou | The longest beach in Menorca with beautiful white sand and clear waters. Popular among families and couples, making it a great spot for vacation rentals. | Son Bou Beach, Cova des Coloms, Punta Prima Beach, Playa de Binibeca, Aquarock Waterpark |
| Binibeca | A picturesque village known for its charming whitewashed buildings and stunning coastal views. Attracts tourists looking for a peaceful getaway. | Binibeca Vell, Binibeca Beach, Cala de Binibeca, Cala Torret, Fish restaurants |
| Porto Colom | A beautiful natural harbor with a quaint fishing village atmosphere. Popular with tourists seeking a relaxing retreat and good local seafood. | Cala Marçal, Cala Brafi, S'Algar, Faro de Porto Colom, Restaurants along the harbor |
| Es Castell | A charming town near the harbor, known for its dramatic cliffs and proximity to Mahón. Great for those looking for culture and authentic Menorcan experiences. | Fort of La Mola, Cala Corb, Cala Pedrera, Es Castell (Town), Local markets |
| Cap d'Artrutx | Located at the southwestern tip of Menorca, it offers beautiful beaches and stunning sunset views. Ideal for beachfront accommodation. | Cap d'Artrutx Lighthouse, Cala'n Bosch Beach, Aquarium of Cap de Cavalleria, Marina of Cala'n Bosch |
| Mahón | The capital of Menorca, known for its rich history and vibrant port. Ideal for those looking to dive into local culture and cuisine. | Mahón Harbour, Museo de Menorca, Fortaleza de la Mola, Catedral de Menorca, Local Tapas Bars |
| Alaior | A historic town with traditional Menorcan architecture and close to popular beaches. Offers a quieter experience with local charm. | Cala en Picas, Cala en Porter, Alaior town square, Archaeological sites, Local artisan shops |
| Ciutadella | A historic city with stunning architecture, known for its nightlife and beautiful beaches. A hotspot for tourists looking for both relaxation and entertainment. | Ciutadella Cathedral, Naveta des Tudons, Playa Gran, Paseo Marítimo, Nightlife at Ciutadella |
Understanding Airbnb License Requirements & STR Laws in Sant Lluís (2026)
Yes, Sant Lluís, Balearic Islands, Spain enforces high STR regulations. Obtaining a license and ensuring compliance is almost certainly required according to current 2026 STR laws. Always verify the latest short term rental regulations and Airbnb license requirements directly with local government authorities for Sant Lluís to ensure full compliance before hosting.
(Source: AirROI data, 2026, based on 84% licensed listings)
Top Performing Airbnb Properties in Sant Lluís (2026)
Benchmark your potential! Explore examples of top-performing Airbnb properties in Sant Lluísbased on Trailing Twelve Month (TTM) revenue. Analyze their characteristics, revenue, occupancy rate, and ADR to understand what drives success in this market.
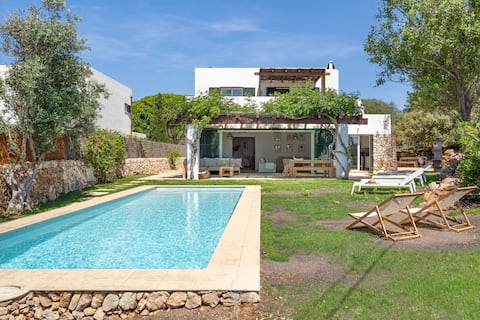
Villa Pepponi by 3 Villas Menorca
Entire Place • 4 bedrooms
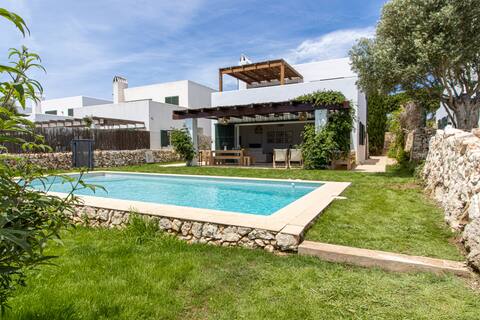
Villa Conguitos of 3 Villas Menorca
Entire Place • 4 bedrooms
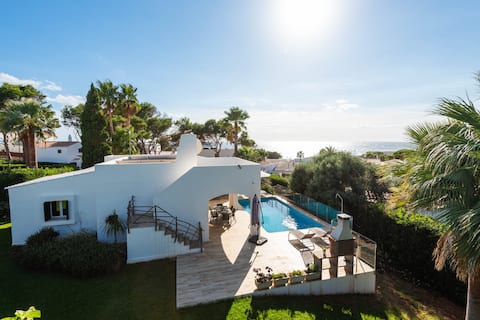
Villa Los Remos by Escape Homes
Entire Place • 3 bedrooms

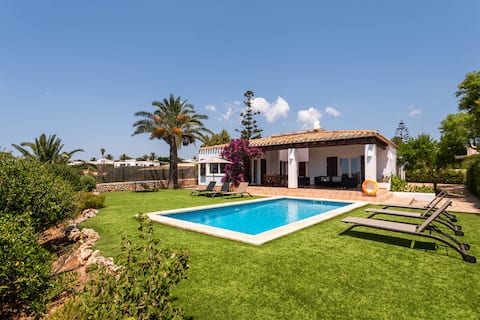
Stunning modern villa, one minute from the beach
Entire Place • 5 bedrooms
Villa Ribes by Escape Home
Entire Place • 3 bedrooms
Villa Tramuntana – Luxury Sea View Retreat
Entire Place • 4 bedrooms
Note: Performance varies based on location, size, amenities, seasonality, and management quality. Data reflects the past 12 months.
Top Performing Airbnb Hosts in Sant Lluís (2026)
Learn from the best! This table showcases top-performing Airbnb hosts in Sant Lluís based on the number of properties managed and estimated total revenue over the past year. Analyze their scale and performance metrics.
| Host Name | Properties | Grossing Revenue | Stay Reviews | Avg Rating |
|---|---|---|---|---|
| 3Villas | 9 | $640,362 | 737 | 4.78/5.0 |
| Escape Home | 5 | $495,240 | 76 | 4.62/5.0 |
| Marta | 7 | $381,537 | 50 | 4.76/5.0 |
| Menorca Habitat | 7 | $228,450 | 190 | 4.59/5.0 |
| Solmar Villas | 8 | $180,487 | 17 | 4.69/5.0 |
| Mirca | 4 | $156,998 | 410 | 4.96/5.0 |
| Richard | 4 | $136,261 | 60 | 4.49/5.0 |
| Miquel | 1 | $124,489 | 20 | 4.95/5.0 |
| Green And Blue Villas | 2 | $123,058 | 11 | 4.64/5.0 |
| Irene | 1 | $110,866 | 30 | 4.73/5.0 |
Analyzing the strategies of top hosts, such as their property selection, pricing, and guest communication, can offer valuable lessons for optimizing your own Airbnb operations in Sant Lluís.
Dive Deeper: Advanced Sant Lluís STR Market Data (2026)
Ready to unlock more insights? AirROI provides access to advanced metrics and comprehensive Airbnb data for Sant Lluís. Explore detailed analytics beyond this report to refine your investment strategy, optimize pricing, and maximize your vacation rental profits.
Explore Advanced MetricsSant Lluís Short-Term Rental Market Composition (2026): Property & Room Types
Room Type Distribution
Property Type Distribution
Market Composition Insights for Sant Lluís
- The Sant Lluís Airbnb market composition is heavily skewed towards Entire Home/Apt listings, which make up 94.4% of the 144 active rentals. This indicates strong guest preference for privacy and space.
- Looking at the property type distribution in Sant Lluís, House properties are the most common (84%), reflecting the local real estate landscape.
- Houses represent a significant 84% portion, catering likely to families or larger groups.
- Smaller segments like hotel/boutique, outdoor/unique (combined 4.9%) offer potential for unique stay experiences.
Sant Lluís Airbnb Room Capacity Analysis (2026): Bedroom Distribution
Distribution of Listings by Number of Bedrooms
Room Capacity Insights for Sant Lluís
- The dominant room capacity in Sant Lluís is 3 bedrooms listings, making up 29.9% of the market. This suggests a strong demand for properties suitable for families or small groups.
- Together, 3 bedrooms and 4 bedrooms properties represent 57.7% of the active Airbnb listings in Sant Lluís, indicating a high concentration in these sizes.
- A significant 69.5% of listings offer 3+ bedrooms, catering to larger groups and families seeking more space in Sant Lluís.
Sant Lluís Vacation Rental Guest Capacity Trends (2026)
Distribution of Listings by Guest Capacity
Guest Capacity Insights for Sant Lluís
- The most common guest capacity trend in Sant Lluís vacation rentals is listings accommodating 8+ guests (36.1%). This suggests the primary traveler segment is likely larger groups.
- Properties designed for 8+ guests and 6 guests dominate the Sant Lluís STR market, accounting for 59.7% of listings.
- 63.2% of properties accommodate 6+ guests, serving the market segment for larger families or group travel in Sant Lluís.
- On average, properties in Sant Lluís are equipped to host 5.7 guests.
Sant Lluís Airbnb Booking Patterns (2026): Available vs. Booked Days
Available Days Distribution
Booked Days Distribution
Booking Pattern Insights for Sant Lluís
- The most common availability pattern in Sant Lluís falls within the 271-366 days range, representing 45.1% of listings. This suggests many properties have significant open periods on their calendars.
- Approximately 86.8% of listings show high availability (181+ days open annually), indicating potential for increased bookings or specific owner usage patterns.
- For booked days, the 91-180 days range is most frequent in Sant Lluís (41%), reflecting common guest stay durations or potential owner blocking patterns.
- A notable 16.7% of properties secure long booking periods (181+ days booked per year), highlighting successful long-term rental strategies or significant owner usage.
Sant Lluís Airbnb Minimum Stay Requirements Analysis
Distribution of Listings by Minimum Night Requirement
1 Night
6 listings
4.2% of total
2 Nights
5 listings
3.5% of total
3 Nights
11 listings
7.6% of total
4-6 Nights
42 listings
29.2% of total
7-29 Nights
21 listings
14.6% of total
30+ Nights
59 listings
41% of total
Key Insights
- The most prevalent minimum stay requirement in Sant Lluís is 30+ Nights, adopted by 41% of listings. This highlights the market's preference for longer commitments.
- Very short stays (1-2 nights) are less common (7.7%), suggesting hosts prefer slightly longer bookings to optimize turnover.
- A significant segment (41%) caters to monthly stays (30+ nights) in Sant Lluís, pointing to opportunities in the extended-stay market.
Recommendations
- Align with the market by considering a 30+ Nights minimum stay, as 41% of Sant Lluís hosts use this setting.
- If feasible, allowing 1-night stays, especially midweek or during low season, could capture last-minute bookings, as only 4.2% currently do.
- Explore offering discounts for stays of 30+ nights to attract the 41% of the market seeking extended stays.
- Adjust minimum nights based on seasonality – potentially shorter during low season and longer during peak demand periods in Sant Lluís.
Sant Lluís Airbnb Cancellation Policy Trends Analysis (2026)
Super Strict 30 Days
12 listings
8.3% of total
Super Strict 60 Days
11 listings
7.6% of total
Limited
13 listings
9% of total
Flexible
5 listings
3.5% of total
Moderate
20 listings
13.9% of total
Firm
52 listings
36.1% of total
Strict
31 listings
21.5% of total
Cancellation Policy Insights for Sant Lluís
- The prevailing Airbnb cancellation policy trend in Sant Lluís is Firm, used by 36.1% of listings.
- A majority (57.6%) of hosts in Sant Lluís utilize Firm or Strict policies, indicating a market where hosts prioritize booking security.
Recommendations for Hosts
- Consider adopting a Firm policy to align with the 36.1% market standard in Sant Lluís.
- Regularly review your cancellation policy against competitors and market demand shifts in Sant Lluís.
Sant Lluís STR Booking Lead Time Analysis (2026)
Average Booking Lead Time by Month
Booking Lead Time Insights for Sant Lluís
- The overall average booking lead time for vacation rentals in Sant Lluís is 98 days.
- Guests book furthest in advance for stays during August (average 139 days), likely coinciding with peak travel demand or local events.
- The shortest booking windows occur for stays in December (average 14 days), indicating more last-minute travel plans during this time.
- Seasonally, Summer (114 days avg.) sees the longest lead times, while Winter (39 days avg.) has the shortest, reflecting typical travel planning cycles.
Recommendations for Hosts
- Use the overall average lead time (98 days) as a baseline for your pricing and availability strategy in Sant Lluís.
- For August stays, consider implementing length-of-stay discounts or slightly higher rates for bookings made less than 139 days out to capitalize on advance planning.
- During December, focus on last-minute booking availability and promotions, as guests book with very short notice (14 days avg.).
- Target marketing efforts for the Summer season well in advance (at least 114 days) to capture early planners.
- Monitor your own booking lead times against these Sant Lluís averages to identify opportunities for dynamic pricing adjustments.
Popular & Essential Airbnb Amenities in Sant Lluís (2026)
Amenity Prevalence
Amenity Insights for Sant Lluís
- Essential amenities in Sant Lluís that guests expect include: Kitchen, TV, Wifi. Lacking these (any) could significantly impact bookings.
- Popular amenities like Washer, Bed linens, Hair dryer are common but not universal. Offering these can provide a competitive edge.
Recommendations for Hosts
- Ensure your listing includes all essential amenities for Sant Lluís: Kitchen, TV, Wifi.
- Prioritize adding missing essentials: Kitchen, TV, Wifi.
- Consider adding popular differentiators like Washer or Bed linens to increase appeal.
- Highlight unique or less common amenities you offer (e.g., hot tub, dedicated workspace, EV charger) in your listing description and photos.
- Regularly check competitor amenities in Sant Lluís to stay competitive.
Sant Lluís Airbnb Guest Demographics & Profile Analysis (2026)
Guest Profile Summary for Sant Lluís
- The typical guest profile for Airbnb in Sant Lluís consists of predominantly international visitors (87%), with top international origins including United Kingdom, typically belonging to the Post-2000s (Gen Z/Alpha) group (50%), primarily speaking English or French.
- Domestic travelers account for 13.5% of guests.
- Key international markets include France (31.9%) and United Kingdom (26.2%).
- Top languages spoken are English (38.4%) followed by French (19.6%).
- A significant demographic segment is the Post-2000s (Gen Z/Alpha) group, representing 50% of guests.
Recommendations for Hosts
- Focus marketing internationally, particularly towards travelers from United Kingdom.
- Tailor amenities and listing descriptions to appeal to the dominant Post-2000s (Gen Z/Alpha) demographic (e.g., highlight fast WiFi, smart home features, local guides).
- Highlight unique local experiences or amenities relevant to the primary guest profile.
- Consider seasonal promotions aligned with peak travel times for key origin markets.
Nearby Short-Term Rental Market Comparison
How does the Sant Lluís Airbnb market stack up against its neighbors? Compare key performance metrics like average monthly revenue, ADR, and occupancy rates in surrounding areas to understand the broader regional STR landscape.
| Market | Active Properties | Monthly Revenue | Daily Rate | Avg. Occupancy |
|---|---|---|---|---|
| Sant Joan | 33 | $5,204 | $567.64 | 50% |
| Vilafranca de Bonany | 31 | $5,133 | $642.83 | 41% |
| Ariany | 64 | $5,090 | $743.62 | 41% |
| Santanyí | 784 | $4,593 | $506.51 | 51% |
| Felanitx | 500 | $4,451 | $589.78 | 46% |
| Son Bauló | 88 | $4,346 | $455.80 | 48% |
| Cales de Mallorca | 16 | $4,330 | $541.40 | 41% |
| Portocristo | 180 | $4,197 | $397.55 | 51% |
| sa Pobla | 164 | $4,191 | $436.15 | 51% |
| Son Servera | 193 | $4,145 | $517.10 | 48% |