Erandio Airbnb Market Analysis 2025: Short Term Rental Data & Vacation Rental Statistics in Autonomous Community of the Basque Country, Spain
Is Airbnb profitable in Erandio in 2025? Explore comprehensive Airbnb analytics for Erandio, Autonomous Community of the Basque Country, Spain to uncover income potential. This 2025 STR market report for Erandio, based on AirROI data from November 2024 to October 2025, reveals key trends in the niche market of 18 active listings.
Whether you're considering an Airbnb investment in Erandio, optimizing your existing vacation rental, or exploring rental arbitrage opportunities, understanding the Erandio Airbnb data is crucial. Navigating the high regulation landscape is key to maximizing your short term rental income potential. Let's dive into the specifics.
Key Erandio Airbnb Performance Metrics Overview
Monthly Airbnb Revenue Variations & Income Potential in Erandio (2025)
Understanding the monthly revenue variations for Airbnb listings in Erandio is key to maximizing your short term rental income potential. Seasonality significantly impacts earnings. Our analysis, based on data from the past 12 months, shows that the peak revenue month for STRs in Erandio is typically July, while February often presents the lowest earnings, highlighting opportunities for strategic pricing adjustments during shoulder and low seasons. Explore the typical Airbnb income in Erandio across different performance tiers:
- Best-in-class properties (Top 10%) achieve $5,588+ monthly, often utilizing dynamic pricing and superior guest experiences.
- Strong performing properties (Top 25%) earn $2,832 or more, indicating effective management and desirable locations/amenities.
- Typical properties (Median) generate around $2,060 per month, representing the average market performance.
- Entry-level properties (Bottom 25%) see earnings around $1,565, often with potential for optimization.
Average Monthly Airbnb Earnings Trend in Erandio
Erandio Airbnb Occupancy Rate Trends (2025)
Maximize your bookings by understanding the Erandio STR occupancy trends. Seasonal demand shifts significantly influence how often properties are booked. Typically, Julysees the highest demand (peak season occupancy), while January experiences the lowest (low season). Effective strategies, like adjusting minimum stays or offering promotions, can boost occupancy during slower periods. Here's how different property tiers perform in Erandio:
- Best-in-class properties (Top 10%) achieve 82%+ occupancy, indicating high desirability and potentially optimized availability.
- Strong performing properties (Top 25%) maintain 76% or higher occupancy, suggesting good market fit and guest satisfaction.
- Typical properties (Median) have an occupancy rate around 56%.
- Entry-level properties (Bottom 25%) average 30% occupancy, potentially facing higher vacancy.
Average Monthly Occupancy Rate Trend in Erandio
Average Daily Rate (ADR) Airbnb Trends in Erandio (2025)
Effective short term rental pricing strategy in Erandio involves understanding monthly ADR fluctuations. The Average Daily Rate (ADR) for Airbnb in Erandio typically peaks in August and dips lowest during February. Leveraging Airbnb dynamic pricing tools or strategies based on this seasonality can significantly boost revenue. Here's a look at the typical nightly rates achieved:
- Best-in-class properties (Top 10%) command rates of $434+ per night, often due to premium features or locations.
- Strong performing properties (Top 25%) achieve nightly rates of $192 or more.
- Typical properties (Median) charge around $128 per night.
- Entry-level properties (Bottom 25%) earn around $99 per night.
Average Daily Rate (ADR) Trend by Month in Erandio
Get Live Erandio Market Intelligence 👇
Explore Real-time Analytics
Airbnb Seasonality Analysis & Trends in Erandio (2025)
Peak Season (July, August, June)
- Revenue averages $4,401 per month
- Occupancy rates average 63.9%
- Daily rates average $225
Shoulder Season
- Revenue averages $2,457 per month
- Occupancy maintains around 54.9%
- Daily rates hold near $188
Low Season (January, February, March)
- Revenue drops to average $1,508 per month
- Occupancy decreases to average 39.8%
- Daily rates adjust to average $170
Seasonality Insights for Erandio
- The Airbnb seasonality in Erandio shows highly seasonal trends requiring careful strategy. While the sections above show seasonal averages, it's also insightful to look at the extremes:
- During the high season, the absolute peak month showcases Erandio's highest earning potential, with monthly revenues capable of climbing to $4,932, occupancy reaching a high of 74.2%, and ADRs peaking at $234.
- Conversely, the slowest single month of the year, typically falling within the low season, marks the market's lowest point. In this month, revenue might dip to $1,244, occupancy could drop to 36.6%, and ADRs may adjust down to $167.
- Understanding both the seasonal averages and these monthly peaks and troughs in revenue, occupancy, and ADR is crucial for maximizing your Airbnb profit potential in Erandio.
Seasonal Strategies for Maximizing Profit
- Peak Season: Maximize revenue through premium pricing and potentially longer minimum stays. Ensure high availability.
- Low Season: Offer competitive pricing, special promotions (e.g., extended stay discounts), and flexible cancellation policies. Target off-season travelers like remote workers or budget-conscious guests.
- Shoulder Seasons: Implement dynamic pricing that balances peak and low rates. Target weekend travelers or specific events. Offer slightly more flexible terms than peak season.
- Regularly analyze your own performance against these Erandio seasonality benchmarks and adjust your pricing and availability strategy accordingly.
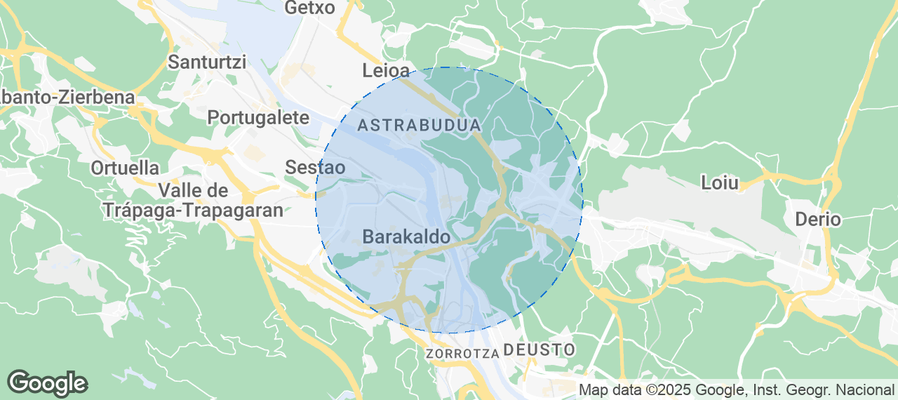
Best Areas for Airbnb Investment in Erandio (2025)
Exploring the top neighborhoods for short-term rentals in Erandio? This section highlights key areas, outlining why they are attractive for hosts and guests, along with notable local attractions. Consider these locations based on your target guest profile and investment strategy.
| Neighborhood / Area | Why Host Here? (Target Guests & Appeal) | Key Attractions & Landmarks |
|---|---|---|
| Erandio Centro | The main central area of Erandio, offering easy access to transport and local amenities. It's attractive for visitors seeking to explore the region's culture and community. | Erandio's Main Square, Local restaurants and bars, Cultural events, Transport links to Bilbao |
| Lapatza | A quiet, residential area known for its greenery and family-friendly environment. Ideal for travelers looking for a peaceful stay while being close to the city. | Parks and green spaces, Local markets, Scenic walking trails, Community events |
| Urbinaga | A blend of residential and commercial spaces, this area provides visitors with local shops and access to traditional Basque cuisine. | Local restaurants, Shopping areas, Cultural experiences, Public parks |
| Kastrexana | Located near the scenic riverbanks, this area is perfect for outdoor enthusiasts and those looking for tranquility while being close to urban life. | Riverside walks, Natural parks, Outdoor sports facilities, Local cafes |
| Rontegi | A vibrant neighborhood popular among locals, Rontegi offers an authentic experience of Basque culture and lifestyle, attracting visitors interested in cultural immersion. | Community festivals, Traditional food markets, Local art scene, Historical sites |
| Retrieve | An emerging area with new developments, it offers modern accommodations and conveniences, appealing to younger travelers and families. | Shopping centers, Modern amenities, Parks and recreational areas |
| Bilbao Airport vicinity | Ideal for travelers looking for proximity to the airport, providing easy access for those arriving or departing. It's great for short stays. | Airport proximity, Business facilities, Short-term accommodation, Transport links to Bilbao |
| Erandio's industrial zone | While primarily an industrial area, it offers unique lodging opportunities for business travelers and those visiting clients in nearby facilities. | Nearby corporate offices, Business parks, Networking opportunities, Local eateries |
Understanding Airbnb License Requirements & STR Laws in Erandio (2025)
Yes, Erandio, Autonomous Community of the Basque Country, Spain enforces high STR regulations. Obtaining a license and ensuring compliance is almost certainly required according to current 2025 STR laws. Always verify the latest short term rental regulations and Airbnb license requirements directly with local government authorities for Erandio to ensure full compliance before hosting.
(Source: AirROI data, 2025, based on 56% licensed listings)
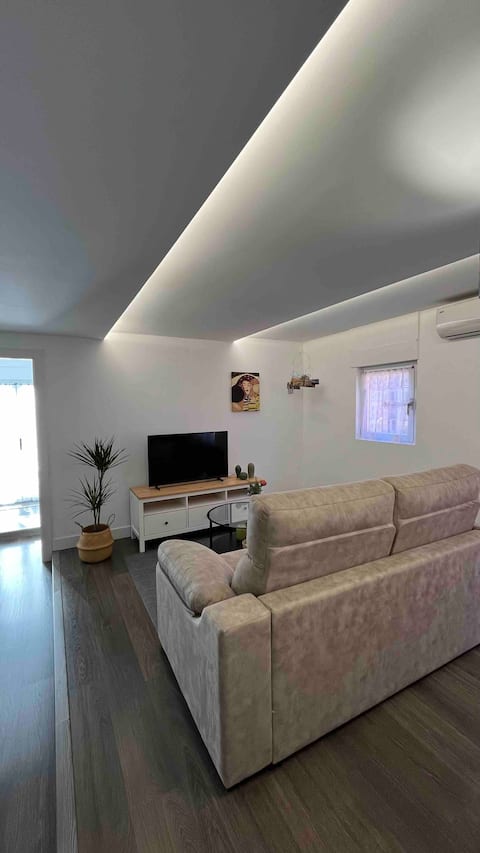
Top Performing Airbnb Properties in Erandio (2025)
Benchmark your potential! Explore examples of top-performing Airbnb properties in Erandiobased on Trailing Twelve Month (TTM) revenue. Analyze their characteristics, revenue, occupancy rate, and ADR to understand what drives success in this market.
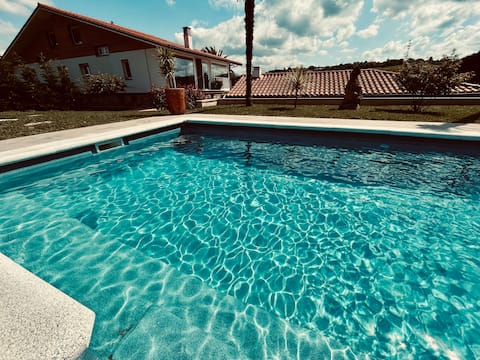
House with a pool - 7 minutes from Bilbao 7 beach
Entire Place • 4 bedrooms
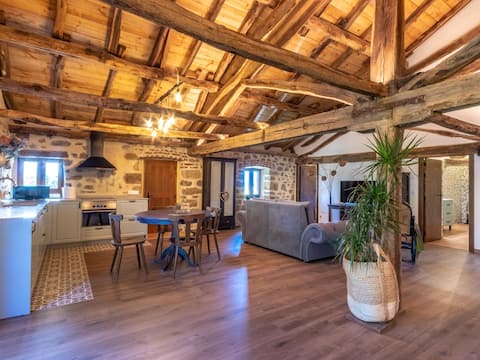
Bilbao Nature with parking by Aston Rentals
Entire Place • 3 bedrooms

Apartment in front of Bilbao River, next to metro
Entire Place • 3 bedrooms

The best stay in Bilbao.
Entire Place • 2 bedrooms

Riverside Terrace near Bilbao Metro + Bus at Door
Entire Place • 3 bedrooms
Blue Desert
Entire Place • 2 bedrooms
Note: Performance varies based on location, size, amenities, seasonality, and management quality. Data reflects the past 12 months.
Top Performing Airbnb Hosts in Erandio (2025)
Learn from the best! This table showcases top-performing Airbnb hosts in Erandio based on the number of properties managed and estimated total revenue over the past year. Analyze their scale and performance metrics.
| Host Name | Properties | Grossing Revenue | Stay Reviews | Avg Rating |
|---|---|---|---|---|
| Tania | 1 | $82,755 | 40 | 4.93/5.0 |
| Aston Rentals | 1 | $73,504 | 22 | 4.95/5.0 |
| Maria | 1 | $33,049 | 40 | 4.80/5.0 |
| Hairong | 1 | $30,064 | 224 | 4.92/5.0 |
| Shira | 1 | $29,548 | 78 | 4.87/5.0 |
| Lina | 1 | $27,894 | 120 | 4.83/5.0 |
| Leire | 1 | $27,320 | 239 | 4.92/5.0 |
| Roberto | 1 | $25,764 | 151 | 4.70/5.0 |
| Sky Blu Sondika | 3 | $23,477 | 41 | 4.04/5.0 |
| Julen | 1 | $20,363 | 238 | 4.79/5.0 |
Analyzing the strategies of top hosts, such as their property selection, pricing, and guest communication, can offer valuable lessons for optimizing your own Airbnb operations in Erandio.
Dive Deeper: Advanced Erandio STR Market Data (2025)
Ready to unlock more insights? AirROI provides access to advanced metrics and comprehensive Airbnb data for Erandio. Explore detailed analytics beyond this report to refine your investment strategy, optimize pricing, and maximize your vacation rental profits.
Explore Advanced MetricsErandio Short-Term Rental Market Composition (2025): Property & Room Types
Room Type Distribution
Property Type Distribution
Market Composition Insights for Erandio
- The Erandio Airbnb market composition is heavily skewed towards Entire Home/Apt listings, which make up 77.8% of the 18 active rentals. This indicates strong guest preference for privacy and space.
- Looking at the property type distribution in Erandio, Apartment/Condo properties are the most common (66.7%), reflecting the local real estate landscape.
- The presence of 22.2% Hotel/Boutique listings indicates integration with traditional hospitality.
Erandio Airbnb Room Capacity Analysis (2025): Bedroom Distribution
Distribution of Listings by Number of Bedrooms
Room Capacity Insights for Erandio
- The dominant room capacity in Erandio is 2 bedrooms listings, making up 38.9% of the market. This suggests a strong demand for properties suitable for couples or solo travelers.
- Together, 2 bedrooms and 1 bedroom properties represent 72.2% of the active Airbnb listings in Erandio, indicating a high concentration in these sizes.
- A significant 27.9% of listings offer 3+ bedrooms, catering to larger groups and families seeking more space in Erandio.
Erandio Vacation Rental Guest Capacity Trends (2025)
Distribution of Listings by Guest Capacity
Guest Capacity Insights for Erandio
- The most common guest capacity trend in Erandio vacation rentals is listings accommodating 4 guests (38.9%). This suggests the primary traveler segment is likely small families or groups.
- Properties designed for 4 guests and 2 guests dominate the Erandio STR market, accounting for 61.1% of listings.
- 16.7% of properties accommodate 6+ guests, serving the market segment for larger families or group travel in Erandio.
- On average, properties in Erandio are equipped to host 4.1 guests.
Erandio Airbnb Booking Patterns (2025): Available vs. Booked Days
Available Days Distribution
Booked Days Distribution
Booking Pattern Insights for Erandio
- The most common availability pattern in Erandio falls within the 271-366 days range, representing 38.9% of listings. This suggests many properties have significant open periods on their calendars.
- Approximately 66.7% of listings show high availability (181+ days open annually), indicating potential for increased bookings or specific owner usage patterns.
- For booked days, the 91-180 days range is most frequent in Erandio (27.8%), reflecting common guest stay durations or potential owner blocking patterns.
- A notable 33.4% of properties secure long booking periods (181+ days booked per year), highlighting successful long-term rental strategies or significant owner usage.
Erandio Airbnb Minimum Stay Requirements Analysis
Distribution of Listings by Minimum Night Requirement
1 Night
4 listings
22.2% of total
2 Nights
4 listings
22.2% of total
3 Nights
1 listings
5.6% of total
4-6 Nights
1 listings
5.6% of total
7-29 Nights
1 listings
5.6% of total
30+ Nights
7 listings
38.9% of total
Key Insights
- The most prevalent minimum stay requirement in Erandio is 30+ Nights, adopted by 38.9% of listings. This highlights the market's preference for longer commitments.
- A significant segment (38.9%) caters to monthly stays (30+ nights) in Erandio, pointing to opportunities in the extended-stay market.
Recommendations
- Align with the market by considering a 30+ Nights minimum stay, as 38.9% of Erandio hosts use this setting.
- If feasible, allowing 1-night stays, especially midweek or during low season, could capture last-minute bookings, as only 22.2% currently do.
- Explore offering discounts for stays of 30+ nights to attract the 38.9% of the market seeking extended stays.
- Adjust minimum nights based on seasonality – potentially shorter during low season and longer during peak demand periods in Erandio.
Erandio Airbnb Cancellation Policy Trends Analysis (2025)
Flexible
1 listings
5.6% of total
Moderate
9 listings
50% of total
Firm
4 listings
22.2% of total
Strict
4 listings
22.2% of total
Cancellation Policy Insights for Erandio
- The prevailing Airbnb cancellation policy trend in Erandio is Moderate, used by 50% of listings.
- There's a relatively balanced mix between guest-friendly (55.6%) and stricter (44.4%) policies, offering choices for different guest needs.
Recommendations for Hosts
- Consider adopting a Moderate policy to align with the 50% market standard in Erandio.
- Regularly review your cancellation policy against competitors and market demand shifts in Erandio.
Erandio STR Booking Lead Time Analysis (2025)
Average Booking Lead Time by Month
Booking Lead Time Insights for Erandio
- The overall average booking lead time for vacation rentals in Erandio is 59 days.
- Guests book furthest in advance for stays during August (average 140 days), likely coinciding with peak travel demand or local events.
- The shortest booking windows occur for stays in January (average 26 days), indicating more last-minute travel plans during this time.
- Seasonally, Summer (110 days avg.) sees the longest lead times, while Winter (36 days avg.) has the shortest, reflecting typical travel planning cycles.
Recommendations for Hosts
- Use the overall average lead time (59 days) as a baseline for your pricing and availability strategy in Erandio.
- For August stays, consider implementing length-of-stay discounts or slightly higher rates for bookings made less than 140 days out to capitalize on advance planning.
- Target marketing efforts for the Summer season well in advance (at least 110 days) to capture early planners.
- Monitor your own booking lead times against these Erandio averages to identify opportunities for dynamic pricing adjustments.
Popular & Essential Airbnb Amenities in Erandio (2025)
Amenity Prevalence
Amenity Insights for Erandio
- Essential amenities in Erandio that guests expect include: Wifi, TV. Lacking these (any) could significantly impact bookings.
- Popular amenities like Heating, Hot water, Hair dryer are common but not universal. Offering these can provide a competitive edge.
Recommendations for Hosts
- Ensure your listing includes all essential amenities for Erandio: Wifi, TV.
- Consider adding popular differentiators like Heating or Hot water to increase appeal.
- Highlight unique or less common amenities you offer (e.g., hot tub, dedicated workspace, EV charger) in your listing description and photos.
- Regularly check competitor amenities in Erandio to stay competitive.
Erandio Airbnb Guest Demographics & Profile Analysis (2025)
Guest Profile Summary for Erandio
- The typical guest profile for Airbnb in Erandio consists of predominantly international visitors (70%), with top international origins including France, typically belonging to the Post-2000s (Gen Z/Alpha) group (50%), primarily speaking English or Spanish.
- Domestic travelers account for 30.5% of guests.
- Key international markets include Spain (30.5%) and France (20.9%).
- Top languages spoken are English (36.1%) followed by Spanish (24.7%).
- A significant demographic segment is the Post-2000s (Gen Z/Alpha) group, representing 50% of guests.
Recommendations for Hosts
- Focus marketing internationally, particularly towards travelers from France.
- Tailor amenities and listing descriptions to appeal to the dominant Post-2000s (Gen Z/Alpha) demographic (e.g., highlight fast WiFi, smart home features, local guides).
- Highlight unique local experiences or amenities relevant to the primary guest profile.
- Consider seasonal promotions aligned with peak travel times for key origin markets.
Nearby Short-Term Rental Market Comparison
How does the Erandio Airbnb market stack up against its neighbors? Compare key performance metrics like average monthly revenue, ADR, and occupancy rates in surrounding areas to understand the broader regional STR landscape.
| Market | Active Properties | Monthly Revenue | Daily Rate | Avg. Occupancy |
|---|---|---|---|---|
| San Sebastián | 1,407 | $3,750 | $290.35 | 47% |
| Dima | 11 | $3,342 | $335.54 | 48% |
| Lasarte-Oria | 18 | $2,828 | $210.23 | 47% |
| Ultzama | 19 | $2,676 | $218.38 | 39% |
| Gautegiz Arteaga | 15 | $2,636 | $322.61 | 33% |
| Larraun | 17 | $2,625 | $248.32 | 39% |
| Getaria | 38 | $2,405 | $230.24 | 34% |
| Labastida/Bastida | 13 | $2,379 | $213.13 | 30% |
| Valle de Yerri/Deierri | 16 | $2,333 | $317.11 | 29% |
| Lège-Cap-Ferret | 1,249 | $2,330 | $361.84 | 36% |