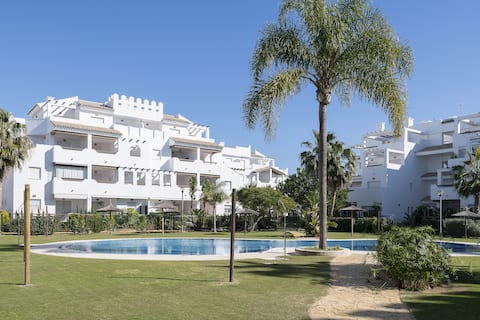
Rota Airbnb Market Analysis 2026: Short Term Rental Data & Vacation Rental Statistics in Andalusia, Spain
Is Airbnb profitable in Rota in 2026? Explore comprehensive Airbnb analytics for Rota, Andalusia, Spain to uncover income potential. This 2026 STR market report for Rota, based on AirROI data from February 2025 to January 2026, reveals key trends in the market of 344 active listings.
Whether you're considering an Airbnb investment in Rota, optimizing your existing vacation rental, or exploring rental arbitrage opportunities, understanding the Rota Airbnb data is crucial. Navigating the high regulation landscape is key to maximizing your short term rental income potential. Let's dive into the specifics.
Key Rota Airbnb Performance Metrics Overview
Monthly Airbnb Revenue Variations & Income Potential in Rota (2026)
Understanding the monthly revenue variations for Airbnb listings in Rota is key to maximizing your short term rental income potential. Seasonality significantly impacts earnings. Our analysis, based on data from the past 12 months, shows that the peak revenue month for STRs in Rota is typically August, while January often presents the lowest earnings, highlighting opportunities for strategic pricing adjustments during shoulder and low seasons. Explore the typical Airbnb income in Rota across different performance tiers:
- Best-in-class properties (Top 10%) achieve $3,406+ monthly, often utilizing dynamic pricing and superior guest experiences.
- Strong performing properties (Top 25%) earn $2,270 or more, indicating effective management and desirable locations/amenities.
- Typical properties (Median) generate around $1,348 per month, representing the average market performance.
- Entry-level properties (Bottom 25%) see earnings around $702, often with potential for optimization.
Average Monthly Airbnb Earnings Trend in Rota
Rota Airbnb Occupancy Rate Trends (2026)
Maximize your bookings by understanding the Rota STR occupancy trends. Seasonal demand shifts significantly influence how often properties are booked. Typically, Augustsees the highest demand (peak season occupancy), while January experiences the lowest (low season). Effective strategies, like adjusting minimum stays or offering promotions, can boost occupancy during slower periods. Here's how different property tiers perform in Rota:
- Best-in-class properties (Top 10%) achieve 73%+ occupancy, indicating high desirability and potentially optimized availability.
- Strong performing properties (Top 25%) maintain 51% or higher occupancy, suggesting good market fit and guest satisfaction.
- Typical properties (Median) have an occupancy rate around 31%.
- Entry-level properties (Bottom 25%) average 15% occupancy, potentially facing higher vacancy.
Average Monthly Occupancy Rate Trend in Rota
Average Daily Rate (ADR) Airbnb Trends in Rota (2026)
Effective short term rental pricing strategy in Rota involves understanding monthly ADR fluctuations. The Average Daily Rate (ADR) for Airbnb in Rota typically peaks in August and dips lowest during February. Leveraging Airbnb dynamic pricing tools or strategies based on this seasonality can significantly boost revenue. Here's a look at the typical nightly rates achieved:
- Best-in-class properties (Top 10%) command rates of $255+ per night, often due to premium features or locations.
- Strong performing properties (Top 25%) achieve nightly rates of $182 or more.
- Typical properties (Median) charge around $134 per night.
- Entry-level properties (Bottom 25%) earn around $107 per night.
Average Daily Rate (ADR) Trend by Month in Rota
Get Live Rota Market Intelligence 👇

Explore Real-time Analytics
Airbnb Seasonality Analysis & Trends in Rota (2026)
Peak Season (August, July, September)
- Revenue averages $3,167 per month
- Occupancy rates average 53.0%
- Daily rates average $193
Shoulder Season
- Revenue averages $1,337 per month
- Occupancy maintains around 32.2%
- Daily rates hold near $163
Low Season (January, February, November)
- Revenue drops to average $885 per month
- Occupancy decreases to average 25.4%
- Daily rates adjust to average $154
Seasonality Insights for Rota
- The Airbnb seasonality in Rota shows highly seasonal trends requiring careful strategy. While the sections above show seasonal averages, it's also insightful to look at the extremes:
- During the high season, the absolute peak month showcases Rota's highest earning potential, with monthly revenues capable of climbing to $4,368, occupancy reaching a high of 66.0%, and ADRs peaking at $204.
- Conversely, the slowest single month of the year, typically falling within the low season, marks the market's lowest point. In this month, revenue might dip to $671, occupancy could drop to 19.1%, and ADRs may adjust down to $151.
- Understanding both the seasonal averages and these monthly peaks and troughs in revenue, occupancy, and ADR is crucial for maximizing your Airbnb profit potential in Rota.
Seasonal Strategies for Maximizing Profit
- Peak Season: Maximize revenue through premium pricing and potentially longer minimum stays. Ensure high availability.
- Low Season: Offer competitive pricing, special promotions (e.g., extended stay discounts), and flexible cancellation policies. Target off-season travelers like remote workers or budget-conscious guests.
- Shoulder Seasons: Implement dynamic pricing that balances peak and low rates. Target weekend travelers or specific events. Offer slightly more flexible terms than peak season.
- Regularly analyze your own performance against these Rota seasonality benchmarks and adjust your pricing and availability strategy accordingly.
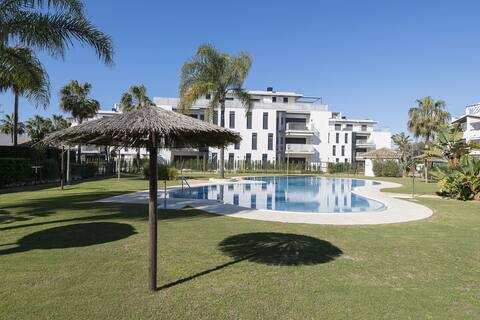
Best Areas for Airbnb Investment in Rota (2026)
Exploring the top neighborhoods for short-term rentals in Rota? This section highlights key areas, outlining why they are attractive for hosts and guests, along with notable local attractions. Consider these locations based on your target guest profile and investment strategy.
| Neighborhood / Area | Why Host Here? (Target Guests & Appeal) | Key Attractions & Landmarks |
|---|---|---|
| Costa Nao | Popular coastal destination with beautiful beaches, ideal for families and sun seekers. Visitors enjoy water sports and sunbathing on the sandy shores. | Playa de la Costilla, Playa del Chorrillo, Rota Beach, Natural Area of the Lagunas de las Madres, Marina de Rota |
| Historic Center | Charming old town with narrow streets and traditional Andalusian architecture. Perfect for travelers interested in local culture and history. | Church of Our Lady of O, Plaza de España, Castillo de Luna, Museum of Rota, Carnival Museum |
| El Rompido | Tranquil area known for its natural parks and golf courses. Great for those who want to relax away from the busy tourist spots. | Natural Park of the Marshes of Odiel, Golf El Rompido, Huelva beaches, Cerro de San Cristobal, El Granado |
| Las Cabañas | Quiet neighborhood near the beach, popular among families and those looking for a peaceful stay. Offers local dining and shopping options. | Cabañas Beach, Local seafood restaurants, Shops and small markets |
| Sanlucar de Barrameda | Famous for its wine and seafood, this area is close to Rota and offers a unique cultural experience with great dining options. | Doñana National Park, Pine forests, Local wineries, Playa de las Piletas, Sanlúcar Beach |
| Chipiona | Known for its stunning coastline and as a summer getaway close to Rota. Family-friendly with plenty of amenities. | Chipiona Lighthouse, Playa de Regla, Local ice cream shops, Kitesurfing |
| La Playa de la Costilla | Vibrant beach area with cafes and bars, perfect for those who enjoy lively environments and beach activities. | Beachfront restaurants, Bicycle rentals, Water sports, Boardwalk area |
| Marina de Rota | Popular marina area with a mix of local and international visitors. Great for those looking to enjoy nautical activities and seafood dining. | Marina activities, Seafood restaurants, Local markets, Boat tours |
Understanding Airbnb License Requirements & STR Laws in Rota (2026)
Yes, Rota, Andalusia, Spain enforces high STR regulations. Obtaining a license and ensuring compliance is almost certainly required according to current 2026 STR laws. Always verify the latest short term rental regulations and Airbnb license requirements directly with local government authorities for Rota to ensure full compliance before hosting.
(Source: AirROI data, 2026, based on 77% licensed listings)
Top Performing Airbnb Properties in Rota (2026)
Benchmark your potential! Explore examples of top-performing Airbnb properties in Rotabased on Trailing Twelve Month (TTM) revenue. Analyze their characteristics, revenue, occupancy rate, and ADR to understand what drives success in this market.
The Sunset House-Punta Candor Beach - Apartment
Entire Place • 2 bedrooms
Veracruz Apartment
Entire Place • 2 bedrooms

Great Studio
Entire Place • 5 bedrooms
Loving Rota - Apartment In Rota. Free Wifi
Entire Place • 2 bedrooms
La Casita De Candor Beach - Apartment In Rota
Entire Place • 1 bedroom

Large house with pool
Entire Place • 5 bedrooms
Note: Performance varies based on location, size, amenities, seasonality, and management quality. Data reflects the past 12 months.
Top Performing Airbnb Hosts in Rota (2026)
Learn from the best! This table showcases top-performing Airbnb hosts in Rota based on the number of properties managed and estimated total revenue over the past year. Analyze their scale and performance metrics.
| Host Name | Properties | Grossing Revenue | Stay Reviews | Avg Rating |
|---|---|---|---|---|
| MyChoice Apartments | 30 | $307,311 | 226 | 4.41/5.0 |
| Homerti | 4 | $213,282 | 18 | 4.86/5.0 |
| Lena | 5 | $96,097 | 87 | 4.52/5.0 |
| 7Escalones | 11 | $91,167 | 51 | 4.78/5.0 |
| Eneas | 2 | $74,282 | 28 | 4.95/5.0 |
| Sara | 2 | $72,062 | 31 | 4.71/5.0 |
| Jose Manuel | 4 | $71,065 | 244 | 4.62/5.0 |
| Alberto | 1 | $58,151 | 13 | 4.62/5.0 |
| Paloma | 2 | $49,070 | 93 | 4.88/5.0 |
| Julian Francisco | 2 | $44,647 | 267 | 4.93/5.0 |
Analyzing the strategies of top hosts, such as their property selection, pricing, and guest communication, can offer valuable lessons for optimizing your own Airbnb operations in Rota.
Dive Deeper: Advanced Rota STR Market Data (2026)
Ready to unlock more insights? AirROI provides access to advanced metrics and comprehensive Airbnb data for Rota. Explore detailed analytics beyond this report to refine your investment strategy, optimize pricing, and maximize your vacation rental profits.
Explore Advanced MetricsRota Short-Term Rental Market Composition (2026): Property & Room Types
Room Type Distribution
Property Type Distribution
Market Composition Insights for Rota
- The Rota Airbnb market composition is heavily skewed towards Entire Home/Apt listings, which make up 95.1% of the 344 active rentals. This indicates strong guest preference for privacy and space.
- Looking at the property type distribution in Rota, Apartment/Condo properties are the most common (75%), reflecting the local real estate landscape.
- Houses represent a significant 24.1% portion, catering likely to families or larger groups.
- Smaller segments like hotel/boutique (combined 0.9%) offer potential for unique stay experiences.
Rota Airbnb Room Capacity Analysis (2026): Bedroom Distribution
Distribution of Listings by Number of Bedrooms
Room Capacity Insights for Rota
- The dominant room capacity in Rota is 2 bedrooms listings, making up 46.2% of the market. This suggests a strong demand for properties suitable for couples or solo travelers.
- Together, 2 bedrooms and 3 bedrooms properties represent 72.1% of the active Airbnb listings in Rota, indicating a high concentration in these sizes.
- A significant 30.8% of listings offer 3+ bedrooms, catering to larger groups and families seeking more space in Rota.
Rota Vacation Rental Guest Capacity Trends (2026)
Distribution of Listings by Guest Capacity
Guest Capacity Insights for Rota
- The most common guest capacity trend in Rota vacation rentals is listings accommodating 4 guests (34.3%). This suggests the primary traveler segment is likely small families or groups.
- Properties designed for 4 guests and 6 guests dominate the Rota STR market, accounting for 59.6% of listings.
- 35.8% of properties accommodate 6+ guests, serving the market segment for larger families or group travel in Rota.
- On average, properties in Rota are equipped to host 4.7 guests.
Rota Airbnb Booking Patterns (2026): Available vs. Booked Days
Available Days Distribution
Booked Days Distribution
Booking Pattern Insights for Rota
- The most common availability pattern in Rota falls within the 271-366 days range, representing 65.7% of listings. This suggests many properties have significant open periods on their calendars.
- Approximately 91.6% of listings show high availability (181+ days open annually), indicating potential for increased bookings or specific owner usage patterns.
- For booked days, the 31-90 days range is most frequent in Rota (43%), reflecting common guest stay durations or potential owner blocking patterns.
- A notable 9.0% of properties secure long booking periods (181+ days booked per year), highlighting successful long-term rental strategies or significant owner usage.
Rota Airbnb Minimum Stay Requirements Analysis
Distribution of Listings by Minimum Night Requirement
1 Night
17 listings
4.9% of total
2 Nights
45 listings
13.1% of total
3 Nights
16 listings
4.7% of total
4-6 Nights
67 listings
19.5% of total
7-29 Nights
35 listings
10.2% of total
30+ Nights
164 listings
47.7% of total
Key Insights
- The most prevalent minimum stay requirement in Rota is 30+ Nights, adopted by 47.7% of listings. This highlights the market's preference for longer commitments.
- Very short stays (1-2 nights) are less common (18.0%), suggesting hosts prefer slightly longer bookings to optimize turnover.
- A significant segment (47.7%) caters to monthly stays (30+ nights) in Rota, pointing to opportunities in the extended-stay market.
Recommendations
- Align with the market by considering a 30+ Nights minimum stay, as 47.7% of Rota hosts use this setting.
- If feasible, allowing 1-night stays, especially midweek or during low season, could capture last-minute bookings, as only 4.9% currently do.
- Explore offering discounts for stays of 30+ nights to attract the 47.7% of the market seeking extended stays.
- Adjust minimum nights based on seasonality – potentially shorter during low season and longer during peak demand periods in Rota.
Rota Airbnb Cancellation Policy Trends Analysis (2026)
Super Strict 60 Days
4 listings
1.2% of total
Super Strict 30 Days
1 listings
0.3% of total
Flexible
53 listings
15.4% of total
Moderate
94 listings
27.3% of total
Firm
148 listings
43% of total
Strict
44 listings
12.8% of total
Cancellation Policy Insights for Rota
- The prevailing Airbnb cancellation policy trend in Rota is Firm, used by 43% of listings.
- A majority (55.8%) of hosts in Rota utilize Firm or Strict policies, indicating a market where hosts prioritize booking security.
Recommendations for Hosts
- Consider adopting a Firm policy to align with the 43% market standard in Rota.
- Using a Strict policy might deter some guests, as only 12.8% of listings use it. Evaluate if potential revenue protection outweighs possible lower booking rates.
- Regularly review your cancellation policy against competitors and market demand shifts in Rota.
Rota STR Booking Lead Time Analysis (2026)
Average Booking Lead Time by Month
Booking Lead Time Insights for Rota
- The overall average booking lead time for vacation rentals in Rota is 62 days.
- Guests book furthest in advance for stays during August (average 114 days), likely coinciding with peak travel demand or local events.
- The shortest booking windows occur for stays in March (average 28 days), indicating more last-minute travel plans during this time.
- Seasonally, Summer (89 days avg.) sees the longest lead times, while Winter (38 days avg.) has the shortest, reflecting typical travel planning cycles.
Recommendations for Hosts
- Use the overall average lead time (62 days) as a baseline for your pricing and availability strategy in Rota.
- For August stays, consider implementing length-of-stay discounts or slightly higher rates for bookings made less than 114 days out to capitalize on advance planning.
- Target marketing efforts for the Summer season well in advance (at least 89 days) to capture early planners.
- Monitor your own booking lead times against these Rota averages to identify opportunities for dynamic pricing adjustments.
Popular & Essential Airbnb Amenities in Rota (2026)
Amenity Prevalence
Amenity Insights for Rota
- Essential amenities in Rota that guests expect include: Kitchen, Washer, TV. Lacking these (any) could significantly impact bookings.
- Popular amenities like Wifi, Hangers, Hot water are common but not universal. Offering these can provide a competitive edge.
- Warning: Wifi is not universally provided but is considered essential globally. Ensure reliable Wifi is offered.
Recommendations for Hosts
- Ensure your listing includes all essential amenities for Rota: Kitchen, Washer, TV.
- Prioritize adding missing essentials: Kitchen, Washer, TV.
- Consider adding popular differentiators like Wifi or Hangers to increase appeal.
- Highlight unique or less common amenities you offer (e.g., hot tub, dedicated workspace, EV charger) in your listing description and photos.
- Regularly check competitor amenities in Rota to stay competitive.
Rota Airbnb Guest Demographics & Profile Analysis (2026)
Guest Profile Summary for Rota
- The typical guest profile for Airbnb in Rota consists of a mix of domestic (60%) and international guests, often arriving from nearby Seville, typically belonging to the Post-2000s (Gen Z/Alpha) group (50%), primarily speaking English or Spanish.
- Domestic travelers account for 60.3% of guests.
- Key international markets include Spain (60.3%) and United States (10.5%).
- Top languages spoken are English (36.2%) followed by Spanish (33.2%).
- A significant demographic segment is the Post-2000s (Gen Z/Alpha) group, representing 50% of guests.
Recommendations for Hosts
- Target domestic marketing efforts towards travelers from Seville and Madrid.
- Tailor amenities and listing descriptions to appeal to the dominant Post-2000s (Gen Z/Alpha) demographic (e.g., highlight fast WiFi, smart home features, local guides).
- Highlight unique local experiences or amenities relevant to the primary guest profile.
- Consider seasonal promotions aligned with peak travel times for key origin markets.
Nearby Short-Term Rental Market Comparison
How does the Rota Airbnb market stack up against its neighbors? Compare key performance metrics like average monthly revenue, ADR, and occupancy rates in surrounding areas to understand the broader regional STR landscape.
| Market | Active Properties | Monthly Revenue | Daily Rate | Avg. Occupancy |
|---|---|---|---|---|
| Gelves | 26 | $2,989 | $190.74 | 54% |
| Benahavís | 518 | $2,914 | $430.92 | 39% |
| El Paraíso | 13 | $2,679 | $369.93 | 45% |
| Guillena | 35 | $2,502 | $256.76 | 38% |
| Cantillana | 10 | $2,375 | $199.78 | 35% |
| Seville | 7,019 | $2,331 | $174.88 | 50% |
| Gerena | 10 | $2,307 | $277.29 | 38% |
| Marchena | 23 | $2,267 | $344.26 | 37% |
| San Roque | 293 | $2,258 | $329.56 | 39% |
| São Brás de Alportel | 128 | $2,174 | $285.02 | 43% |