Rincón de la Victoria Airbnb Market Analysis 2026: Short Term Rental Data & Vacation Rental Statistics in Andalusia, Spain
Is Airbnb profitable in Rincón de la Victoria in 2026? Explore comprehensive Airbnb analytics for Rincón de la Victoria, Andalusia, Spain to uncover income potential. This 2026 STR market report for Rincón de la Victoria, based on AirROI data from February 2025 to January 2026, reveals key trends in the market of 483 active listings.
Whether you're considering an Airbnb investment in Rincón de la Victoria, optimizing your existing vacation rental, or exploring rental arbitrage opportunities, understanding the Rincón de la Victoria Airbnb data is crucial. Navigating the high regulation landscape is key to maximizing your short term rental income potential. Let's dive into the specifics.
Key Rincón de la Victoria Airbnb Performance Metrics Overview
Monthly Airbnb Revenue Variations & Income Potential in Rincón de la Victoria (2026)
Understanding the monthly revenue variations for Airbnb listings in Rincón de la Victoria is key to maximizing your short term rental income potential. Seasonality significantly impacts earnings. Our analysis, based on data from the past 12 months, shows that the peak revenue month for STRs in Rincón de la Victoria is typically August, while January often presents the lowest earnings, highlighting opportunities for strategic pricing adjustments during shoulder and low seasons. Explore the typical Airbnb income in Rincón de la Victoria across different performance tiers:
- Best-in-class properties (Top 10%) achieve $4,798+ monthly, often utilizing dynamic pricing and superior guest experiences.
- Strong performing properties (Top 25%) earn $3,028 or more, indicating effective management and desirable locations/amenities.
- Typical properties (Median) generate around $1,850 per month, representing the average market performance.
- Entry-level properties (Bottom 25%) see earnings around $983, often with potential for optimization.
Average Monthly Airbnb Earnings Trend in Rincón de la Victoria
Rincón de la Victoria Airbnb Occupancy Rate Trends (2026)
Maximize your bookings by understanding the Rincón de la Victoria STR occupancy trends. Seasonal demand shifts significantly influence how often properties are booked. Typically, Augustsees the highest demand (peak season occupancy), while January experiences the lowest (low season). Effective strategies, like adjusting minimum stays or offering promotions, can boost occupancy during slower periods. Here's how different property tiers perform in Rincón de la Victoria:
- Best-in-class properties (Top 10%) achieve 84%+ occupancy, indicating high desirability and potentially optimized availability.
- Strong performing properties (Top 25%) maintain 67% or higher occupancy, suggesting good market fit and guest satisfaction.
- Typical properties (Median) have an occupancy rate around 44%.
- Entry-level properties (Bottom 25%) average 22% occupancy, potentially facing higher vacancy.
Average Monthly Occupancy Rate Trend in Rincón de la Victoria
Average Daily Rate (ADR) Airbnb Trends in Rincón de la Victoria (2026)
Effective short term rental pricing strategy in Rincón de la Victoria involves understanding monthly ADR fluctuations. The Average Daily Rate (ADR) for Airbnb in Rincón de la Victoria typically peaks in August and dips lowest during February. Leveraging Airbnb dynamic pricing tools or strategies based on this seasonality can significantly boost revenue. Here's a look at the typical nightly rates achieved:
- Best-in-class properties (Top 10%) command rates of $356+ per night, often due to premium features or locations.
- Strong performing properties (Top 25%) achieve nightly rates of $201 or more.
- Typical properties (Median) charge around $136 per night.
- Entry-level properties (Bottom 25%) earn around $103 per night.
Average Daily Rate (ADR) Trend by Month in Rincón de la Victoria
Get Live Rincón de la Victoria Market Intelligence 👇

Explore Real-time Analytics
Airbnb Seasonality Analysis & Trends in Rincón de la Victoria (2026)
Peak Season (August, July, September)
- Revenue averages $4,137 per month
- Occupancy rates average 60.8%
- Daily rates average $217
Shoulder Season
- Revenue averages $2,122 per month
- Occupancy maintains around 42.4%
- Daily rates hold near $180
Low Season (January, February, November)
- Revenue drops to average $1,459 per month
- Occupancy decreases to average 35.5%
- Daily rates adjust to average $172
Seasonality Insights for Rincón de la Victoria
- The Airbnb seasonality in Rincón de la Victoria shows highly seasonal trends requiring careful strategy. While the sections above show seasonal averages, it's also insightful to look at the extremes:
- During the high season, the absolute peak month showcases Rincón de la Victoria's highest earning potential, with monthly revenues capable of climbing to $4,981, occupancy reaching a high of 68.8%, and ADRs peaking at $225.
- Conversely, the slowest single month of the year, typically falling within the low season, marks the market's lowest point. In this month, revenue might dip to $1,282, occupancy could drop to 28.8%, and ADRs may adjust down to $162.
- Understanding both the seasonal averages and these monthly peaks and troughs in revenue, occupancy, and ADR is crucial for maximizing your Airbnb profit potential in Rincón de la Victoria.
Seasonal Strategies for Maximizing Profit
- Peak Season: Maximize revenue through premium pricing and potentially longer minimum stays. Ensure high availability.
- Low Season: Offer competitive pricing, special promotions (e.g., extended stay discounts), and flexible cancellation policies. Target off-season travelers like remote workers or budget-conscious guests.
- Shoulder Seasons: Implement dynamic pricing that balances peak and low rates. Target weekend travelers or specific events. Offer slightly more flexible terms than peak season.
- Regularly analyze your own performance against these Rincón de la Victoria seasonality benchmarks and adjust your pricing and availability strategy accordingly.
Best Areas for Airbnb Investment in Rincón de la Victoria (2026)
Exploring the top neighborhoods for short-term rentals in Rincón de la Victoria? This section highlights key areas, outlining why they are attractive for hosts and guests, along with notable local attractions. Consider these locations based on your target guest profile and investment strategy.
| Neighborhood / Area | Why Host Here? (Target Guests & Appeal) | Key Attractions & Landmarks |
|---|---|---|
| La Cala del Moral | A charming coastal neighborhood known for its beautiful beaches and relaxed atmosphere. Ideal for families and tourists looking for sun and leisure activities. | Beaches of La Cala, Caminito del Rey, Aquavelis Water Park, El Candado Golf Course, Nearby Malaga city attractions |
| Rincón de la Victoria Village | The heart of the town with a traditional Spanish vibe, featuring local shops, restaurants, and cultural experiences. Great for guests wanting an authentic local experience. | Faro de Rincón, Ermita de Nuestra Señora de la Virgen de la Paz, Cueva del Tesoro, Local tapas bars, Artisan markets |
| Puerto de la Torre | A more residential area offering tranquility and easy access to nature. Perfect for those looking for a quiet retreat while still being close to the beach. | Rincón de la Victoria beach, Hiking in surrounding hills, Local non-touristy restaurants, Scenic parks |
| Torre de Benagalbón | Known for its beautiful beaches and traditional Andalusian charm. Attractive for those looking for a quieter beach experience. | Torre de Benagalbón beach, Chiringuitos (beach bars), Scenic coastal paths, Local fish restaurants |
| Cerro Gordo | A mountainous area offering stunning views and outdoor activities. Attracts nature lovers and those seeking adventure. | Hiking trails, Panoramic viewpoints, Nature reserves, Stargazing spots |
| Los Montecillos | A charming area close to the coast but elevated for great views. Attractive for those seeking a mix of beach and hill environments. | Hiking trails to the coast, Quiet residential feel, Local markets, Birdwatching spots |
| Rincón Urbanizaciones | Characterized by its modern developments and proximity to amenities. A good investment area for those looking for rental condos. | Modern residential complexes, Shopping centers, Nearby parks, Sports facilities |
| Beach Promenade | The beach promenade stretches along the coast with numerous bars, restaurants, and activities. Ideal for those who want vibrant nightlife and beach access. | Beach clubs, Water sports rentals, Cultural festivals, Nightlife spots |
Understanding Airbnb License Requirements & STR Laws in Rincón de la Victoria (2026)
Yes, Rincón de la Victoria, Andalusia, Spain enforces high STR regulations. Obtaining a license and ensuring compliance is almost certainly required according to current 2026 STR laws. Always verify the latest short term rental regulations and Airbnb license requirements directly with local government authorities for Rincón de la Victoria to ensure full compliance before hosting.
(Source: AirROI data, 2026, based on 86% licensed listings)
Top Performing Airbnb Properties in Rincón de la Victoria (2026)
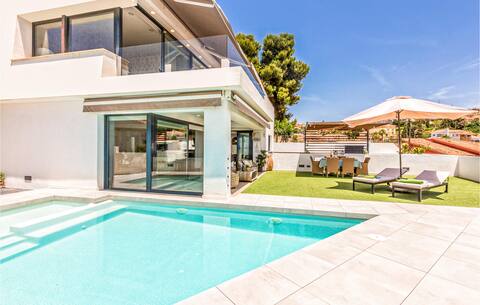
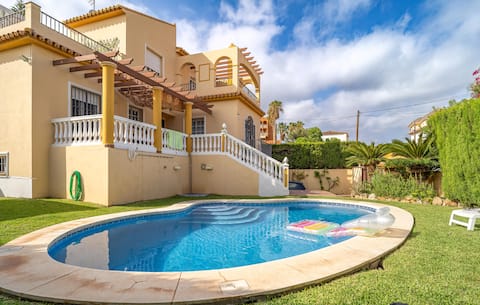
Benchmark your potential! Explore examples of top-performing Airbnb properties in Rincón de la Victoriabased on Trailing Twelve Month (TTM) revenue. Analyze their characteristics, revenue, occupancy rate, and ADR to understand what drives success in this market.

Villa Jacaranda Pool & Sea at Cala del Moral
Entire Place • N/A
Awesome home in Cala del Moral
Entire Place • 6 bedrooms
Amazing home in Rincón de la Victoria
Entire Place • 5 bedrooms

Casa Barco—Luxury Village Villa With Sea Views
Entire Place • 5 bedrooms

Villa Miramar
Entire Place • 6 bedrooms

Naim Villa Playa (100 meters from the beach)
Entire Place • 5 bedrooms
Note: Performance varies based on location, size, amenities, seasonality, and management quality. Data reflects the past 12 months.
Top Performing Airbnb Hosts in Rincón de la Victoria (2026)
Learn from the best! This table showcases top-performing Airbnb hosts in Rincón de la Victoria based on the number of properties managed and estimated total revenue over the past year. Analyze their scale and performance metrics.
| Host Name | Properties | Grossing Revenue | Stay Reviews | Avg Rating |
|---|---|---|---|---|
| Win To Win Rentals S.L | 30 | $754,906 | 826 | 4.74/5.0 |
| Carolina - Interhome | 15 | $358,973 | 51 | 4.44/5.0 |
| Mshome | 12 | $279,223 | 358 | 4.44/5.0 |
| Holidaysforu | 9 | $233,115 | 220 | 4.74/5.0 |
| Homingbook | 4 | $200,682 | 51 | 4.20/5.0 |
| Villa Jacaranda | 1 | $188,698 | 71 | 4.79/5.0 |
| Holger | 3 | $171,929 | 82 | 4.82/5.0 |
| Novasol | 1 | $157,882 | 39 | 4.72/5.0 |
| Novasol | 1 | $156,578 | 9 | 4.89/5.0 |
| MimoRooms | 6 | $143,064 | 183 | 4.56/5.0 |
Analyzing the strategies of top hosts, such as their property selection, pricing, and guest communication, can offer valuable lessons for optimizing your own Airbnb operations in Rincón de la Victoria.
Dive Deeper: Advanced Rincón de la Victoria STR Market Data (2026)
Ready to unlock more insights? AirROI provides access to advanced metrics and comprehensive Airbnb data for Rincón de la Victoria. Explore detailed analytics beyond this report to refine your investment strategy, optimize pricing, and maximize your vacation rental profits.
Explore Advanced MetricsRincón de la Victoria Short-Term Rental Market Composition (2026): Property & Room Types
Room Type Distribution
Property Type Distribution
Market Composition Insights for Rincón de la Victoria
- The Rincón de la Victoria Airbnb market composition is heavily skewed towards Entire Home/Apt listings, which make up 94% of the 483 active rentals. This indicates strong guest preference for privacy and space.
- Looking at the property type distribution in Rincón de la Victoria, Apartment/Condo properties are the most common (70.6%), reflecting the local real estate landscape.
- Houses represent a significant 24.2% portion, catering likely to families or larger groups.
- Smaller segments like hotel/boutique, others, outdoor/unique (combined 5.1%) offer potential for unique stay experiences.
Rincón de la Victoria Airbnb Room Capacity Analysis (2026): Bedroom Distribution
Distribution of Listings by Number of Bedrooms
Room Capacity Insights for Rincón de la Victoria
- The dominant room capacity in Rincón de la Victoria is 2 bedrooms listings, making up 33.1% of the market. This suggests a strong demand for properties suitable for couples or solo travelers.
- Together, 2 bedrooms and 1 bedroom properties represent 59.6% of the active Airbnb listings in Rincón de la Victoria, indicating a high concentration in these sizes.
- A significant 35.4% of listings offer 3+ bedrooms, catering to larger groups and families seeking more space in Rincón de la Victoria.
Rincón de la Victoria Vacation Rental Guest Capacity Trends (2026)
Distribution of Listings by Guest Capacity
Guest Capacity Insights for Rincón de la Victoria
- The most common guest capacity trend in Rincón de la Victoria vacation rentals is listings accommodating 4 guests (34%). This suggests the primary traveler segment is likely small families or groups.
- Properties designed for 4 guests and 6 guests dominate the Rincón de la Victoria STR market, accounting for 53.7% of listings.
- 33.6% of properties accommodate 6+ guests, serving the market segment for larger families or group travel in Rincón de la Victoria.
- On average, properties in Rincón de la Victoria are equipped to host 4.6 guests.
Rincón de la Victoria Airbnb Booking Patterns (2026): Available vs. Booked Days
Available Days Distribution
Booked Days Distribution
Booking Pattern Insights for Rincón de la Victoria
- The most common availability pattern in Rincón de la Victoria falls within the 271-366 days range, representing 46.4% of listings. This suggests many properties have significant open periods on their calendars.
- Approximately 78.5% of listings show high availability (181+ days open annually), indicating potential for increased bookings or specific owner usage patterns.
- For booked days, the 91-180 days range is most frequent in Rincón de la Victoria (33.5%), reflecting common guest stay durations or potential owner blocking patterns.
- A notable 22.0% of properties secure long booking periods (181+ days booked per year), highlighting successful long-term rental strategies or significant owner usage.
Rincón de la Victoria Airbnb Minimum Stay Requirements Analysis
Distribution of Listings by Minimum Night Requirement
1 Night
30 listings
6.2% of total
2 Nights
51 listings
10.6% of total
3 Nights
36 listings
7.5% of total
4-6 Nights
96 listings
19.9% of total
7-29 Nights
19 listings
3.9% of total
30+ Nights
251 listings
52% of total
Key Insights
- The most prevalent minimum stay requirement in Rincón de la Victoria is 30+ Nights, adopted by 52% of listings. This highlights the market's preference for longer commitments.
- Very short stays (1-2 nights) are less common (16.8%), suggesting hosts prefer slightly longer bookings to optimize turnover.
- A significant segment (52%) caters to monthly stays (30+ nights) in Rincón de la Victoria, pointing to opportunities in the extended-stay market.
Recommendations
- Align with the market by considering a 30+ Nights minimum stay, as 52% of Rincón de la Victoria hosts use this setting.
- If feasible, allowing 1-night stays, especially midweek or during low season, could capture last-minute bookings, as only 6.2% currently do.
- Explore offering discounts for stays of 30+ nights to attract the 52% of the market seeking extended stays.
- Adjust minimum nights based on seasonality – potentially shorter during low season and longer during peak demand periods in Rincón de la Victoria.
Rincón de la Victoria Airbnb Cancellation Policy Trends Analysis (2026)
Limited
7 listings
1.5% of total
Super Strict 60 Days
10 listings
2.1% of total
Super Strict 30 Days
5 listings
1% of total
Flexible
52 listings
10.8% of total
Moderate
138 listings
28.7% of total
Firm
195 listings
40.5% of total
Strict
74 listings
15.4% of total
Cancellation Policy Insights for Rincón de la Victoria
- The prevailing Airbnb cancellation policy trend in Rincón de la Victoria is Firm, used by 40.5% of listings.
- A majority (55.9%) of hosts in Rincón de la Victoria utilize Firm or Strict policies, indicating a market where hosts prioritize booking security.
Recommendations for Hosts
- Consider adopting a Firm policy to align with the 40.5% market standard in Rincón de la Victoria.
- Regularly review your cancellation policy against competitors and market demand shifts in Rincón de la Victoria.
Rincón de la Victoria STR Booking Lead Time Analysis (2026)
Average Booking Lead Time by Month
Booking Lead Time Insights for Rincón de la Victoria
- The overall average booking lead time for vacation rentals in Rincón de la Victoria is 68 days.
- Guests book furthest in advance for stays during August (average 99 days), likely coinciding with peak travel demand or local events.
- The shortest booking windows occur for stays in March (average 46 days), indicating more last-minute travel plans during this time.
- Seasonally, Summer (82 days avg.) sees the longest lead times, while Winter (54 days avg.) has the shortest, reflecting typical travel planning cycles.
Recommendations for Hosts
- Use the overall average lead time (68 days) as a baseline for your pricing and availability strategy in Rincón de la Victoria.
- For August stays, consider implementing length-of-stay discounts or slightly higher rates for bookings made less than 99 days out to capitalize on advance planning.
- Target marketing efforts for the Summer season well in advance (at least 82 days) to capture early planners.
- Monitor your own booking lead times against these Rincón de la Victoria averages to identify opportunities for dynamic pricing adjustments.
Popular & Essential Airbnb Amenities in Rincón de la Victoria (2026)
Amenity Prevalence
Amenity Insights for Rincón de la Victoria
- Essential amenities in Rincón de la Victoria that guests expect include: Wifi, TV, Kitchen. Lacking these (any) could significantly impact bookings.
- Popular amenities like Washer, Air conditioning, Refrigerator are common but not universal. Offering these can provide a competitive edge.
Recommendations for Hosts
- Ensure your listing includes all essential amenities for Rincón de la Victoria: Wifi, TV, Kitchen.
- Prioritize adding missing essentials: Wifi, TV, Kitchen.
- Consider adding popular differentiators like Washer or Air conditioning to increase appeal.
- Highlight unique or less common amenities you offer (e.g., hot tub, dedicated workspace, EV charger) in your listing description and photos.
- Regularly check competitor amenities in Rincón de la Victoria to stay competitive.
Rincón de la Victoria Airbnb Guest Demographics & Profile Analysis (2026)
Guest Profile Summary for Rincón de la Victoria
- The typical guest profile for Airbnb in Rincón de la Victoria consists of predominantly international visitors (77%), with top international origins including United Kingdom, typically belonging to the Post-2000s (Gen Z/Alpha) group (50%), primarily speaking English or Spanish.
- Domestic travelers account for 22.9% of guests.
- Key international markets include Spain (22.9%) and United Kingdom (13.4%).
- Top languages spoken are English (35.9%) followed by Spanish (19.3%).
- A significant demographic segment is the Post-2000s (Gen Z/Alpha) group, representing 50% of guests.
Recommendations for Hosts
- Focus marketing internationally, particularly towards travelers from United Kingdom.
- Tailor amenities and listing descriptions to appeal to the dominant Post-2000s (Gen Z/Alpha) demographic (e.g., highlight fast WiFi, smart home features, local guides).
- Highlight unique local experiences or amenities relevant to the primary guest profile.
- Consider seasonal promotions aligned with peak travel times for key origin markets.
Nearby Short-Term Rental Market Comparison
How does the Rincón de la Victoria Airbnb market stack up against its neighbors? Compare key performance metrics like average monthly revenue, ADR, and occupancy rates in surrounding areas to understand the broader regional STR landscape.
| Market | Active Properties | Monthly Revenue | Daily Rate | Avg. Occupancy |
|---|---|---|---|---|
| Cártama | 48 | $4,137 | $378.39 | 45% |
| Alhaurín de la Torre | 210 | $3,716 | $325.91 | 46% |
| Alhaurín el Grande | 271 | $3,613 | $310.22 | 46% |
| Casarabonela | 24 | $3,495 | $286.94 | 39% |
| Benahavís | 518 | $2,914 | $430.92 | 39% |
| Marbella | 5,279 | $2,756 | $342.36 | 42% |
| El Paraíso | 13 | $2,679 | $369.93 | 45% |
| Villanueva del Rosario | 12 | $2,590 | $310.50 | 35% |
| Gójar | 14 | $2,483 | $231.10 | 33% |
| Coín | 119 | $2,388 | $303.70 | 41% |