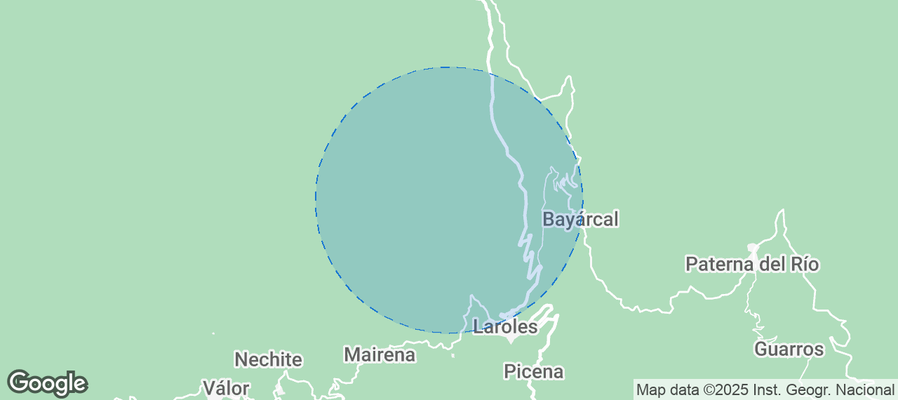
Nevada Airbnb Market Analysis 2025: Short Term Rental Data & Vacation Rental Statistics in Andalusia, Spain
Is Airbnb profitable in Nevada in 2025? Explore comprehensive Airbnb analytics for Nevada, Andalusia, Spain to uncover income potential. This 2025 STR market report for Nevada, based on AirROI data from November 2024 to October 2025, reveals key trends in the niche market of 17 active listings.
Whether you're considering an Airbnb investment in Nevada, optimizing your existing vacation rental, or exploring rental arbitrage opportunities, understanding the Nevada Airbnb data is crucial. Navigating the high regulation landscape is key to maximizing your short term rental income potential. Let's dive into the specifics.
Key Nevada Airbnb Performance Metrics Overview
Monthly Airbnb Revenue Variations & Income Potential in Nevada (2025)
Understanding the monthly revenue variations for Airbnb listings in Nevada is key to maximizing your short term rental income potential. Seasonality significantly impacts earnings. Our analysis, based on data from the past 12 months, shows that the peak revenue month for STRs in Nevada is typically July, while January often presents the lowest earnings, highlighting opportunities for strategic pricing adjustments during shoulder and low seasons. Explore the typical Airbnb income in Nevada across different performance tiers:
- Best-in-class properties (Top 10%) achieve $2,494+ monthly, often utilizing dynamic pricing and superior guest experiences.
- Strong performing properties (Top 25%) earn $1,566 or more, indicating effective management and desirable locations/amenities.
- Typical properties (Median) generate around $880 per month, representing the average market performance.
- Entry-level properties (Bottom 25%) see earnings around $453, often with potential for optimization.
Average Monthly Airbnb Earnings Trend in Nevada
Nevada Airbnb Occupancy Rate Trends (2025)
Maximize your bookings by understanding the Nevada STR occupancy trends. Seasonal demand shifts significantly influence how often properties are booked. Typically, Augustsees the highest demand (peak season occupancy), while January experiences the lowest (low season). Effective strategies, like adjusting minimum stays or offering promotions, can boost occupancy during slower periods. Here's how different property tiers perform in Nevada:
- Best-in-class properties (Top 10%) achieve 47%+ occupancy, indicating high desirability and potentially optimized availability.
- Strong performing properties (Top 25%) maintain 35% or higher occupancy, suggesting good market fit and guest satisfaction.
- Typical properties (Median) have an occupancy rate around 23%.
- Entry-level properties (Bottom 25%) average 10% occupancy, potentially facing higher vacancy.
Average Monthly Occupancy Rate Trend in Nevada
Average Daily Rate (ADR) Airbnb Trends in Nevada (2025)
Effective short term rental pricing strategy in Nevada involves understanding monthly ADR fluctuations. The Average Daily Rate (ADR) for Airbnb in Nevada typically peaks in August and dips lowest during March. Leveraging Airbnb dynamic pricing tools or strategies based on this seasonality can significantly boost revenue. Here's a look at the typical nightly rates achieved:
- Best-in-class properties (Top 10%) command rates of $294+ per night, often due to premium features or locations.
- Strong performing properties (Top 25%) achieve nightly rates of $187 or more.
- Typical properties (Median) charge around $105 per night.
- Entry-level properties (Bottom 25%) earn around $81 per night.
Average Daily Rate (ADR) Trend by Month in Nevada
Get Live Nevada Market Intelligence 👇
Explore Real-time Analytics
Airbnb Seasonality Analysis & Trends in Nevada (2025)
Peak Season (July, August, April)
- Revenue averages $2,185 per month
- Occupancy rates average 35.1%
- Daily rates average $166
Shoulder Season
- Revenue averages $1,083 per month
- Occupancy maintains around 23.0%
- Daily rates hold near $142
Low Season (January, March, June)
- Revenue drops to average $780 per month
- Occupancy decreases to average 17.4%
- Daily rates adjust to average $140
Seasonality Insights for Nevada
- The Airbnb seasonality in Nevada shows highly seasonal trends requiring careful strategy. While the sections above show seasonal averages, it's also insightful to look at the extremes:
- During the high season, the absolute peak month showcases Nevada's highest earning potential, with monthly revenues capable of climbing to $2,965, occupancy reaching a high of 38.2%, and ADRs peaking at $183.
- Conversely, the slowest single month of the year, typically falling within the low season, marks the market's lowest point. In this month, revenue might dip to $684, occupancy could drop to 17.4%, and ADRs may adjust down to $137.
- Understanding both the seasonal averages and these monthly peaks and troughs in revenue, occupancy, and ADR is crucial for maximizing your Airbnb profit potential in Nevada.
Seasonal Strategies for Maximizing Profit
- Peak Season: Maximize revenue through premium pricing and potentially longer minimum stays. Ensure high availability.
- Low Season: Offer competitive pricing, special promotions (e.g., extended stay discounts), and flexible cancellation policies. Target off-season travelers like remote workers or budget-conscious guests.
- Shoulder Seasons: Implement dynamic pricing that balances peak and low rates. Target weekend travelers or specific events. Offer slightly more flexible terms than peak season.
- Regularly analyze your own performance against these Nevada seasonality benchmarks and adjust your pricing and availability strategy accordingly.
Best Areas for Airbnb Investment in Nevada (2025)
Exploring the top neighborhoods for short-term rentals in Nevada? This section highlights key areas, outlining why they are attractive for hosts and guests, along with notable local attractions. Consider these locations based on your target guest profile and investment strategy.
| Neighborhood / Area | Why Host Here? (Target Guests & Appeal) | Key Attractions & Landmarks |
|---|---|---|
| Las Vegas Strip | World-renowned entertainment capital known for its vibrant nightlife, casinos, and shows. Attracts tourists from around the globe looking for excitement and luxury accommodations. | The Bellagio, Fremont Street Experience, High Roller, Caesars Palace, The Venetian |
| Summerlin | A master-planned community offering a suburban feel with access to parks and outdoor activities. Popular among families and those wanting a quieter stay close to the city. | Red Rock Canyon, Downtown Summerlin, Golf courses, Parks and trails, Shopping and dining options |
| Henderson | Located just southeast of Las Vegas, Henderson is known for its family-friendly atmosphere and affordability. Great for long-term rentals and visitors wanting to escape the Strip's hustle. | Lake Las Vegas, Green Valley Ranch Resort, Aviation Museums, Valley of Fire State Park, Parks and recreation areas |
| Laughlin | A small resort town along the Colorado River, known for casinos and outdoor activities. Offers a quieter alternative to Las Vegas for those seeking both gambling and nature. | Riverwalk, Bullhead City, Laughlin River Tours, Lake Mead, Casino resorts |
| Lake Tahoe | A scenic destination known for its stunning lake and outdoor activities, year-round tourism from skiing in the winter to beaches in the summer. Popular among nature lovers. | Emerald Bay State Park, Heavenly Ski Resort, Bijou Community Park, Lake Tahoe beaches, Hiking trails |
| Reno | Known as 'The Biggest Little City in the World', Reno offers a mix of casinos and outdoor adventure. Attracts visitors for gambling and proximity to Lake Tahoe. | The Strip, Reno Riverwalk, National Automobile Museum, Nevada Museum of Art, Reno Aces Baseball |
| Carson City | The state capital of Nevada, featuring historical attractions and nature nearby. Ideal for visitors interested in Nevada's history and state government. | Nevada State Museum, Carson City Mint, Washoe Lake State Park, Governor's Mansion, Virginia & Truckee Railroad |
| Mesquite | A smaller city known for golf courses and a more relaxed pace than Las Vegas. Attracts retirees and visitors looking for peaceful stays with nearby gambling options. | Mesquite Golf & Country Club, Virgin River Casino, Littlefield, Arizona, Dunes at Mesquite, Parks and recreational activities |
Understanding Airbnb License Requirements & STR Laws in Nevada (2025)
Yes, Nevada, Andalusia, Spain enforces high STR regulations. Obtaining a license and ensuring compliance is almost certainly required according to current 2025 STR laws. Always verify the latest short term rental regulations and Airbnb license requirements directly with local government authorities for Nevada to ensure full compliance before hosting.
(Source: AirROI data, 2025, based on 65% licensed listings)
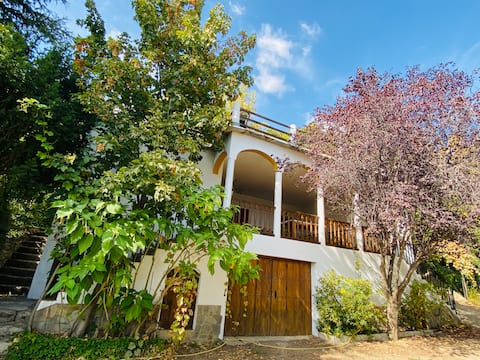
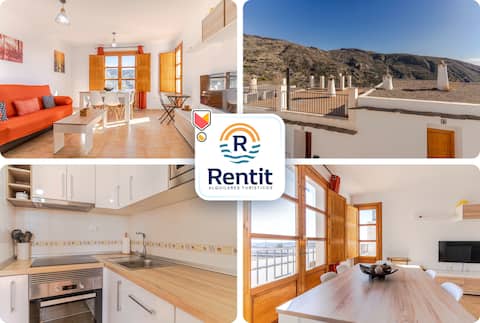
Top Performing Airbnb Properties in Nevada (2025)
Benchmark your potential! Explore examples of top-performing Airbnb properties in Nevadabased on Trailing Twelve Month (TTM) revenue. Analyze their characteristics, revenue, occupancy rate, and ADR to understand what drives success in this market.

Villa Buena Vista in La Alpujarra
Entire Place • 8 bedrooms
Tourist Housing in the heart of the Alpujarra
Entire Place • 5 bedrooms
Casa Picena: Hiking and Mountain
Entire Place • 4 bedrooms

Country house in the Alpujarra mountains
Entire Place • 4 bedrooms

A house in the Alpujarra with mountain views
Entire Place • 1 bedroom

Casa Rural Buena Vista
Entire Place • 5 bedrooms
Note: Performance varies based on location, size, amenities, seasonality, and management quality. Data reflects the past 12 months.
Top Performing Airbnb Hosts in Nevada (2025)
Learn from the best! This table showcases top-performing Airbnb hosts in Nevada based on the number of properties managed and estimated total revenue over the past year. Analyze their scale and performance metrics.
| Host Name | Properties | Grossing Revenue | Stay Reviews | Avg Rating |
|---|---|---|---|---|
| Juan | 4 | $74,043 | 28 | 4.93/5.0 |
| Orlando | 7 | $66,327 | 19 | 4.78/5.0 |
| Gabriel | 3 | $27,276 | 6 | 4.75/5.0 |
| Carmen | 1 | $8,195 | 28 | 4.89/5.0 |
| Diego | 1 | $8,131 | 50 | 4.98/5.0 |
| Juan Jesús | 1 | $1,512 | 4 | 5.00/5.0 |
Analyzing the strategies of top hosts, such as their property selection, pricing, and guest communication, can offer valuable lessons for optimizing your own Airbnb operations in Nevada.
Dive Deeper: Advanced Nevada STR Market Data (2025)
Ready to unlock more insights? AirROI provides access to advanced metrics and comprehensive Airbnb data for Nevada. Explore detailed analytics beyond this report to refine your investment strategy, optimize pricing, and maximize your vacation rental profits.
Explore Advanced MetricsNevada Short-Term Rental Market Composition (2025): Property & Room Types
Room Type Distribution
Property Type Distribution
Market Composition Insights for Nevada
- The Nevada Airbnb market composition is heavily skewed towards Entire Home/Apt listings, which make up 100% of the 17 active rentals. This indicates strong guest preference for privacy and space.
- Looking at the property type distribution in Nevada, House properties are the most common (76.5%), reflecting the local real estate landscape.
- Houses represent a significant 76.5% portion, catering likely to families or larger groups.
Nevada Airbnb Room Capacity Analysis (2025): Bedroom Distribution
Distribution of Listings by Number of Bedrooms
Room Capacity Insights for Nevada
- The dominant room capacity in Nevada is 1 bedroom listings, making up 41.2% of the market. This suggests a strong demand for properties suitable for couples or solo travelers.
- Together, 1 bedroom and 2 bedrooms properties represent 64.7% of the active Airbnb listings in Nevada, indicating a high concentration in these sizes.
- A significant 35.3% of listings offer 3+ bedrooms, catering to larger groups and families seeking more space in Nevada.
Nevada Vacation Rental Guest Capacity Trends (2025)
Distribution of Listings by Guest Capacity
Guest Capacity Insights for Nevada
- The most common guest capacity trend in Nevada vacation rentals is listings accommodating 4 guests (29.4%). This suggests the primary traveler segment is likely small families or groups.
- Properties designed for 4 guests and 8+ guests dominate the Nevada STR market, accounting for 58.8% of listings.
- 29.4% of properties accommodate 6+ guests, serving the market segment for larger families or group travel in Nevada.
- On average, properties in Nevada are equipped to host 4.7 guests.
Nevada Airbnb Booking Patterns (2025): Available vs. Booked Days
Available Days Distribution
Booked Days Distribution
Booking Pattern Insights for Nevada
- The most common availability pattern in Nevada falls within the 271-366 days range, representing 70.6% of listings. This suggests many properties have significant open periods on their calendars.
- Approximately 100.0% of listings show high availability (181+ days open annually), indicating potential for increased bookings or specific owner usage patterns.
- For booked days, the 31-90 days range is most frequent in Nevada (58.8%), reflecting common guest stay durations or potential owner blocking patterns.
Nevada Airbnb Minimum Stay Requirements Analysis
Distribution of Listings by Minimum Night Requirement
2 Nights
3 listings
17.6% of total
3 Nights
7 listings
41.2% of total
30+ Nights
7 listings
41.2% of total
Key Insights
- The most prevalent minimum stay requirement in Nevada is 3 Nights, adopted by 41.2% of listings. This highlights the market's preference for longer commitments.
- Very short stays (1-2 nights) are less common (17.6%), suggesting hosts prefer slightly longer bookings to optimize turnover.
- A significant segment (41.2%) caters to monthly stays (30+ nights) in Nevada, pointing to opportunities in the extended-stay market.
Recommendations
- Align with the market by considering a 3 Nights minimum stay, as 41.2% of Nevada hosts use this setting.
- Explore offering discounts for stays of 30+ nights to attract the 41.2% of the market seeking extended stays.
- Adjust minimum nights based on seasonality – potentially shorter during low season and longer during peak demand periods in Nevada.
Nevada Airbnb Cancellation Policy Trends Analysis (2025)
Flexible
4 listings
25% of total
Moderate
6 listings
37.5% of total
Firm
3 listings
18.8% of total
Strict
3 listings
18.8% of total
Cancellation Policy Insights for Nevada
- The prevailing Airbnb cancellation policy trend in Nevada is Moderate, used by 37.5% of listings.
- There's a relatively balanced mix between guest-friendly (62.5%) and stricter (37.6%) policies, offering choices for different guest needs.
Recommendations for Hosts
- Consider adopting a Moderate policy to align with the 37.5% market standard in Nevada.
- Regularly review your cancellation policy against competitors and market demand shifts in Nevada.
Nevada STR Booking Lead Time Analysis (2025)
Average Booking Lead Time by Month
Booking Lead Time Insights for Nevada
- The overall average booking lead time for vacation rentals in Nevada is 42 days.
- Guests book furthest in advance for stays during July (average 80 days), likely coinciding with peak travel demand or local events.
- The shortest booking windows occur for stays in November (average 15 days), indicating more last-minute travel plans during this time.
- Seasonally, Summer (66 days avg.) sees the longest lead times, while Fall (21 days avg.) has the shortest, reflecting typical travel planning cycles.
Recommendations for Hosts
- Use the overall average lead time (42 days) as a baseline for your pricing and availability strategy in Nevada.
- For July stays, consider implementing length-of-stay discounts or slightly higher rates for bookings made less than 80 days out to capitalize on advance planning.
- Target marketing efforts for the Summer season well in advance (at least 66 days) to capture early planners.
- Monitor your own booking lead times against these Nevada averages to identify opportunities for dynamic pricing adjustments.
Popular & Essential Airbnb Amenities in Nevada (2025)
Amenity Prevalence
Amenity Insights for Nevada
- Essential amenities in Nevada that guests expect include: Kitchen, TV. Lacking these (any) could significantly impact bookings.
- Popular amenities like Cooking basics, Wifi, Washer are common but not universal. Offering these can provide a competitive edge.
- Warning: Wifi is not universally provided but is considered essential globally. Ensure reliable Wifi is offered.
Recommendations for Hosts
- Ensure your listing includes all essential amenities for Nevada: Kitchen, TV.
- Consider adding popular differentiators like Cooking basics or Wifi to increase appeal.
- Highlight unique or less common amenities you offer (e.g., hot tub, dedicated workspace, EV charger) in your listing description and photos.
- Regularly check competitor amenities in Nevada to stay competitive.
Nevada Airbnb Guest Demographics & Profile Analysis (2025)
Guest Profile Summary for Nevada
- The typical guest profile for Airbnb in Nevada consists of a mix of domestic (65%) and international guests, often arriving from nearby Granada, typically belonging to the Post-2000s (Gen Z/Alpha) group (50%), primarily speaking Spanish or English.
- Domestic travelers account for 64.7% of guests.
- Key international markets include Spain (64.7%) and France (11.8%).
- Top languages spoken are Spanish (34.8%) followed by English (34.8%).
- A significant demographic segment is the Post-2000s (Gen Z/Alpha) group, representing 50% of guests.
Recommendations for Hosts
- Target domestic marketing efforts towards travelers from Granada and Albolote.
- Tailor amenities and listing descriptions to appeal to the dominant Post-2000s (Gen Z/Alpha) demographic (e.g., highlight fast WiFi, smart home features, local guides).
- Highlight unique local experiences or amenities relevant to the primary guest profile.
- Consider seasonal promotions aligned with peak travel times for key origin markets.
Nearby Short-Term Rental Market Comparison
How does the Nevada Airbnb market stack up against its neighbors? Compare key performance metrics like average monthly revenue, ADR, and occupancy rates in surrounding areas to understand the broader regional STR landscape.
| Market | Active Properties | Monthly Revenue | Daily Rate | Avg. Occupancy |
|---|---|---|---|---|
| Cártama | 48 | $3,745 | $369.51 | 43% |
| Alhaurín de la Torre | 211 | $3,649 | $318.95 | 44% |
| Alhaurín el Grande | 268 | $3,565 | $323.55 | 43% |
| Casarabonela | 24 | $3,489 | $273.64 | 38% |
| Marbella | 4,883 | $2,703 | $339.13 | 40% |
| Gójar | 14 | $2,542 | $235.10 | 34% |
| Coín | 113 | $2,414 | $302.58 | 40% |
| Ojén | 130 | $2,356 | $238.91 | 42% |
| Montoro | 11 | $2,287 | $288.65 | 27% |
| Moclinejo | 11 | $2,286 | $221.33 | 50% |