Chipiona Airbnb Market Analysis 2026: Short Term Rental Data & Vacation Rental Statistics in Andalusia, Spain
Is Airbnb profitable in Chipiona in 2026? Explore comprehensive Airbnb analytics for Chipiona, Andalusia, Spain to uncover income potential. This 2026 STR market report for Chipiona, based on AirROI data from February 2025 to January 2026, reveals key trends in the market of 213 active listings.
Whether you're considering an Airbnb investment in Chipiona, optimizing your existing vacation rental, or exploring rental arbitrage opportunities, understanding the Chipiona Airbnb data is crucial. Navigating the high regulation landscape is key to maximizing your short term rental income potential. Let's dive into the specifics.
Key Chipiona Airbnb Performance Metrics Overview
Monthly Airbnb Revenue Variations & Income Potential in Chipiona (2026)
Understanding the monthly revenue variations for Airbnb listings in Chipiona is key to maximizing your short term rental income potential. Seasonality significantly impacts earnings. Our analysis, based on data from the past 12 months, shows that the peak revenue month for STRs in Chipiona is typically August, while November often presents the lowest earnings, highlighting opportunities for strategic pricing adjustments during shoulder and low seasons. Explore the typical Airbnb income in Chipiona across different performance tiers:
- Best-in-class properties (Top 10%) achieve $2,907+ monthly, often utilizing dynamic pricing and superior guest experiences.
- Strong performing properties (Top 25%) earn $1,994 or more, indicating effective management and desirable locations/amenities.
- Typical properties (Median) generate around $1,210 per month, representing the average market performance.
- Entry-level properties (Bottom 25%) see earnings around $706, often with potential for optimization.
Average Monthly Airbnb Earnings Trend in Chipiona
Chipiona Airbnb Occupancy Rate Trends (2026)
Maximize your bookings by understanding the Chipiona STR occupancy trends. Seasonal demand shifts significantly influence how often properties are booked. Typically, Augustsees the highest demand (peak season occupancy), while January experiences the lowest (low season). Effective strategies, like adjusting minimum stays or offering promotions, can boost occupancy during slower periods. Here's how different property tiers perform in Chipiona:
- Best-in-class properties (Top 10%) achieve 58%+ occupancy, indicating high desirability and potentially optimized availability.
- Strong performing properties (Top 25%) maintain 45% or higher occupancy, suggesting good market fit and guest satisfaction.
- Typical properties (Median) have an occupancy rate around 28%.
- Entry-level properties (Bottom 25%) average 14% occupancy, potentially facing higher vacancy.
Average Monthly Occupancy Rate Trend in Chipiona
Average Daily Rate (ADR) Airbnb Trends in Chipiona (2026)
Effective short term rental pricing strategy in Chipiona involves understanding monthly ADR fluctuations. The Average Daily Rate (ADR) for Airbnb in Chipiona typically peaks in July and dips lowest during February. Leveraging Airbnb dynamic pricing tools or strategies based on this seasonality can significantly boost revenue. Here's a look at the typical nightly rates achieved:
- Best-in-class properties (Top 10%) command rates of $306+ per night, often due to premium features or locations.
- Strong performing properties (Top 25%) achieve nightly rates of $209 or more.
- Typical properties (Median) charge around $149 per night.
- Entry-level properties (Bottom 25%) earn around $113 per night.
Average Daily Rate (ADR) Trend by Month in Chipiona
Get Live Chipiona Market Intelligence 👇

Explore Real-time Analytics
Airbnb Seasonality Analysis & Trends in Chipiona (2026)
Peak Season (August, July, September)
- Revenue averages $3,232 per month
- Occupancy rates average 54.7%
- Daily rates average $210
Shoulder Season
- Revenue averages $1,186 per month
- Occupancy maintains around 26.0%
- Daily rates hold near $185
Low Season (January, February, November)
- Revenue drops to average $677 per month
- Occupancy decreases to average 16.9%
- Daily rates adjust to average $179
Seasonality Insights for Chipiona
- The Airbnb seasonality in Chipiona shows highly seasonal trends requiring careful strategy. While the sections above show seasonal averages, it's also insightful to look at the extremes:
- During the high season, the absolute peak month showcases Chipiona's highest earning potential, with monthly revenues capable of climbing to $4,417, occupancy reaching a high of 68.1%, and ADRs peaking at $216.
- Conversely, the slowest single month of the year, typically falling within the low season, marks the market's lowest point. In this month, revenue might dip to $582, occupancy could drop to 14.4%, and ADRs may adjust down to $175.
- Understanding both the seasonal averages and these monthly peaks and troughs in revenue, occupancy, and ADR is crucial for maximizing your Airbnb profit potential in Chipiona.
Seasonal Strategies for Maximizing Profit
- Peak Season: Maximize revenue through premium pricing and potentially longer minimum stays. Ensure high availability.
- Low Season: Offer competitive pricing, special promotions (e.g., extended stay discounts), and flexible cancellation policies. Target off-season travelers like remote workers or budget-conscious guests.
- Shoulder Seasons: Implement dynamic pricing that balances peak and low rates. Target weekend travelers or specific events. Offer slightly more flexible terms than peak season.
- Regularly analyze your own performance against these Chipiona seasonality benchmarks and adjust your pricing and availability strategy accordingly.
Best Areas for Airbnb Investment in Chipiona (2026)
Exploring the top neighborhoods for short-term rentals in Chipiona? This section highlights key areas, outlining why they are attractive for hosts and guests, along with notable local attractions. Consider these locations based on your target guest profile and investment strategy.
| Neighborhood / Area | Why Host Here? (Target Guests & Appeal) | Key Attractions & Landmarks |
|---|---|---|
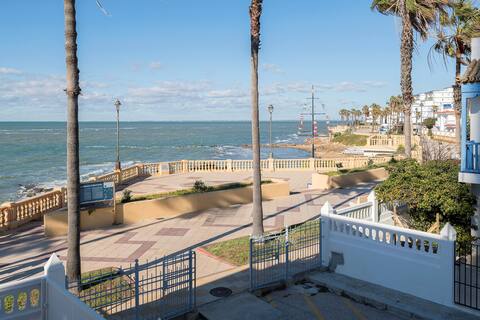
| Playa de Regla | A popular beach area known for its golden sands and local atmosphere. Ideal for families and vacationers looking for a seaside getaway with plenty of sun and sea activities. | Playa de Regla beach, San Sebastián Castle, Chapel of Our Lady of Regla |
| Centro Histórico | The historic center of Chipiona, rich in culture and heritage. Attracts visitors interested in local history and architecture, making it a great spot for charming and cultural stays. | Chipiona Lighthouse, Iglesia Nuestra Señora de la O, Museo de la ciudad |
| Paseo Marítimo | A vibrant promenade along the coast featuring restaurants, shops, and stunning views. Perfect for tourists wanting to experience the local lifestyle and enjoy evening strolls by the sea. | Paseo Marítimo, local seafood restaurants, beach bars, surf schools |
| Cruz del Mar | A residential area known for its quiet atmosphere and proximity to the beach. Good for families looking for a peaceful vacation while still being close to the beach. | Playa de la Cruz del Mar, local markets, small cafes |
| Las Canteras | A scenic neighborhood known for its fine dining and beautiful views. It’s a popular choice for couples and food enthusiasts seeking a romantic getaway. | Mediterranean restaurants, nature parks, stunning beachfront |
| Camino de la Playa | A laid-back area known for its vacation homes and proximity to the beach. Appeals to visitors looking for more private and tranquil accommodations. | quiet beaches, family-friendly activities, local parks |
| Cabo Roche | A nature lover's paradise, known for its beautiful cliffs and natural parks. Ideal for eco-tourism and outdoor activities like hiking and bird watching. | Cabo Roche cliffs, natural parks, hiking trails |
| Los Pinos | A neighborhood that offers a relaxed atmosphere and is close to nature. Attracts those looking to escape the crowded tourist areas while being just a short distance from the beach. | Los Pinos beach, nature trails, local wildlife |
Understanding Airbnb License Requirements & STR Laws in Chipiona (2026)
Yes, Chipiona, Andalusia, Spain enforces high STR regulations. Obtaining a license and ensuring compliance is almost certainly required according to current 2026 STR laws. Always verify the latest short term rental regulations and Airbnb license requirements directly with local government authorities for Chipiona to ensure full compliance before hosting.
(Source: AirROI data, 2026, based on 71% licensed listings)
Top Performing Airbnb Properties in Chipiona (2026)
Benchmark your potential! Explore examples of top-performing Airbnb properties in Chipionabased on Trailing Twelve Month (TTM) revenue. Analyze their characteristics, revenue, occupancy rate, and ADR to understand what drives success in this market.
El Paseo Del Faro - House In Chipiona. Free Wi-Fi
Entire Place • 3 bedrooms
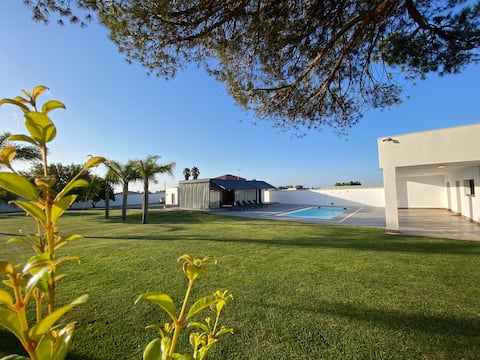
Villa Romance
Entire Place • 3 bedrooms

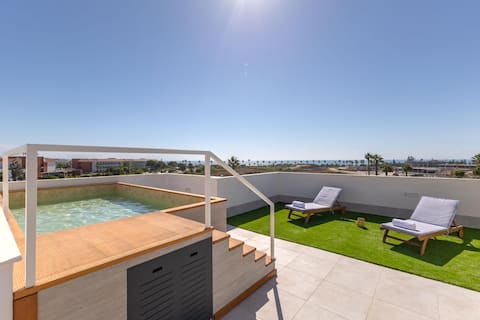
Luxury ground floor private garden pool-3min from the beach
Entire Place • 2 bedrooms

Spectacular townhouse with pool, beachfront II
Entire Place • 4 bedrooms
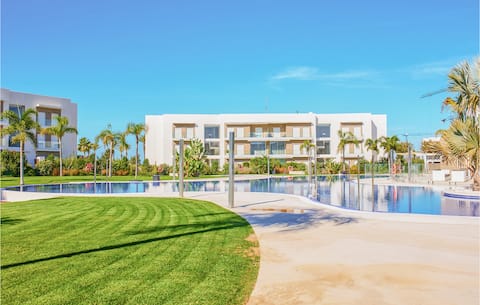
Gorgeous apartment in Chipiona
Entire Place • 2 bedrooms
Luxury beachfront penthouse with pool
Entire Place • 3 bedrooms
Note: Performance varies based on location, size, amenities, seasonality, and management quality. Data reflects the past 12 months.
Top Performing Airbnb Hosts in Chipiona (2026)
Learn from the best! This table showcases top-performing Airbnb hosts in Chipiona based on the number of properties managed and estimated total revenue over the past year. Analyze their scale and performance metrics.
| Host Name | Properties | Grossing Revenue | Stay Reviews | Avg Rating |
|---|---|---|---|---|
| Miguel | 6 | $134,523 | 35 | 4.41/5.0 |
| Homerti | 1 | $79,679 | 6 | 4.00/5.0 |
| Nati | 8 | $78,282 | 35 | 4.81/5.0 |
| Juan Luis | 4 | $50,421 | 33 | 4.93/5.0 |
| Javier | 1 | $47,926 | 5 | 5.00/5.0 |
| Julio Candido | 2 | $45,394 | 87 | 4.61/5.0 |
| Techi | 4 | $42,676 | 244 | 4.58/5.0 |
| Felipe | 2 | $42,513 | 130 | 4.91/5.0 |
| Ana María | 1 | $36,261 | 34 | 4.88/5.0 |
| Novasol | 1 | $35,638 | 13 | 4.85/5.0 |
Analyzing the strategies of top hosts, such as their property selection, pricing, and guest communication, can offer valuable lessons for optimizing your own Airbnb operations in Chipiona.
Dive Deeper: Advanced Chipiona STR Market Data (2026)
Ready to unlock more insights? AirROI provides access to advanced metrics and comprehensive Airbnb data for Chipiona. Explore detailed analytics beyond this report to refine your investment strategy, optimize pricing, and maximize your vacation rental profits.
Explore Advanced MetricsChipiona Short-Term Rental Market Composition (2026): Property & Room Types
Room Type Distribution
Property Type Distribution
Market Composition Insights for Chipiona
- The Chipiona Airbnb market composition is heavily skewed towards Entire Home/Apt listings, which make up 95.8% of the 213 active rentals. This indicates strong guest preference for privacy and space.
- Looking at the property type distribution in Chipiona, Apartment/Condo properties are the most common (71.4%), reflecting the local real estate landscape.
- Houses represent a significant 24.4% portion, catering likely to families or larger groups.
- Smaller segments like outdoor/unique, hotel/boutique (combined 4.2%) offer potential for unique stay experiences.
Chipiona Airbnb Room Capacity Analysis (2026): Bedroom Distribution
Distribution of Listings by Number of Bedrooms
Room Capacity Insights for Chipiona
- The dominant room capacity in Chipiona is 2 bedrooms listings, making up 46.9% of the market. This suggests a strong demand for properties suitable for couples or solo travelers.
- Together, 2 bedrooms and 3 bedrooms properties represent 73.7% of the active Airbnb listings in Chipiona, indicating a high concentration in these sizes.
- A significant 33.4% of listings offer 3+ bedrooms, catering to larger groups and families seeking more space in Chipiona.
Chipiona Vacation Rental Guest Capacity Trends (2026)
Distribution of Listings by Guest Capacity
Guest Capacity Insights for Chipiona
- The most common guest capacity trend in Chipiona vacation rentals is listings accommodating 6 guests (32.9%). This suggests the primary traveler segment is likely larger groups.
- Properties designed for 6 guests and 4 guests dominate the Chipiona STR market, accounting for 63.4% of listings.
- 47.9% of properties accommodate 6+ guests, serving the market segment for larger families or group travel in Chipiona.
- On average, properties in Chipiona are equipped to host 5.1 guests.
Chipiona Airbnb Booking Patterns (2026): Available vs. Booked Days
Available Days Distribution
Booked Days Distribution
Booking Pattern Insights for Chipiona
- The most common availability pattern in Chipiona falls within the 271-366 days range, representing 73.7% of listings. This suggests many properties have significant open periods on their calendars.
- Approximately 98.6% of listings show high availability (181+ days open annually), indicating potential for increased bookings or specific owner usage patterns.
- For booked days, the 31-90 days range is most frequent in Chipiona (39.4%), reflecting common guest stay durations or potential owner blocking patterns.
- A notable 1.9% of properties secure long booking periods (181+ days booked per year), highlighting successful long-term rental strategies or significant owner usage.
Chipiona Airbnb Minimum Stay Requirements Analysis
Distribution of Listings by Minimum Night Requirement
1 Night
9 listings
4.2% of total
2 Nights
29 listings
13.7% of total
3 Nights
23 listings
10.8% of total
4-6 Nights
33 listings
15.6% of total
7-29 Nights
24 listings
11.3% of total
30+ Nights
94 listings
44.3% of total
Key Insights
- The most prevalent minimum stay requirement in Chipiona is 30+ Nights, adopted by 44.3% of listings. This highlights the market's preference for longer commitments.
- Very short stays (1-2 nights) are less common (17.9%), suggesting hosts prefer slightly longer bookings to optimize turnover.
- A significant segment (44.3%) caters to monthly stays (30+ nights) in Chipiona, pointing to opportunities in the extended-stay market.
Recommendations
- Align with the market by considering a 30+ Nights minimum stay, as 44.3% of Chipiona hosts use this setting.
- If feasible, allowing 1-night stays, especially midweek or during low season, could capture last-minute bookings, as only 4.2% currently do.
- Explore offering discounts for stays of 30+ nights to attract the 44.3% of the market seeking extended stays.
- Adjust minimum nights based on seasonality – potentially shorter during low season and longer during peak demand periods in Chipiona.
Chipiona Airbnb Cancellation Policy Trends Analysis (2026)
Super Strict 60 Days
17 listings
8.1% of total
Super Strict 30 Days
7 listings
3.3% of total
Limited
2 listings
0.9% of total
Flexible
21 listings
10% of total
Moderate
37 listings
17.5% of total
Firm
86 listings
40.8% of total
Strict
41 listings
19.4% of total
Cancellation Policy Insights for Chipiona
- The prevailing Airbnb cancellation policy trend in Chipiona is Firm, used by 40.8% of listings.
- A majority (60.2%) of hosts in Chipiona utilize Firm or Strict policies, indicating a market where hosts prioritize booking security.
Recommendations for Hosts
- Consider adopting a Firm policy to align with the 40.8% market standard in Chipiona.
- Regularly review your cancellation policy against competitors and market demand shifts in Chipiona.
Chipiona STR Booking Lead Time Analysis (2026)
Average Booking Lead Time by Month
Booking Lead Time Insights for Chipiona
- The overall average booking lead time for vacation rentals in Chipiona is 67 days.
- Guests book furthest in advance for stays during August (average 123 days), likely coinciding with peak travel demand or local events.
- The shortest booking windows occur for stays in January (average 12 days), indicating more last-minute travel plans during this time.
- Seasonally, Summer (86 days avg.) sees the longest lead times, while Winter (31 days avg.) has the shortest, reflecting typical travel planning cycles.
Recommendations for Hosts
- Use the overall average lead time (67 days) as a baseline for your pricing and availability strategy in Chipiona.
- For August stays, consider implementing length-of-stay discounts or slightly higher rates for bookings made less than 123 days out to capitalize on advance planning.
- During January, focus on last-minute booking availability and promotions, as guests book with very short notice (12 days avg.).
- Target marketing efforts for the Summer season well in advance (at least 86 days) to capture early planners.
- Monitor your own booking lead times against these Chipiona averages to identify opportunities for dynamic pricing adjustments.
Popular & Essential Airbnb Amenities in Chipiona (2026)
Amenity Prevalence
Amenity Insights for Chipiona
- Essential amenities in Chipiona that guests expect include: TV. Lacking these (this) could significantly impact bookings.
- Popular amenities like Kitchen, Washer, Wifi are common but not universal. Offering these can provide a competitive edge.
- Warning: Wifi is not universally provided but is considered essential globally. Ensure reliable Wifi is offered.
Recommendations for Hosts
- Ensure your listing includes all essential amenities for Chipiona: TV.
- Prioritize adding missing essentials: TV.
- Consider adding popular differentiators like Kitchen or Washer to increase appeal.
- Highlight unique or less common amenities you offer (e.g., hot tub, dedicated workspace, EV charger) in your listing description and photos.
- Regularly check competitor amenities in Chipiona to stay competitive.
Chipiona Airbnb Guest Demographics & Profile Analysis (2026)
Guest Profile Summary for Chipiona
- The typical guest profile for Airbnb in Chipiona consists of primarily domestic travelers (72%), often arriving from nearby Seville, typically belonging to the Post-2000s (Gen Z/Alpha) group (50%), primarily speaking Spanish or English.
- Domestic travelers account for 71.5% of guests.
- Key international markets include Spain (71.5%) and Germany (6.3%).
- Top languages spoken are Spanish (38.8%) followed by English (30.6%).
- A significant demographic segment is the Post-2000s (Gen Z/Alpha) group, representing 50% of guests.
Recommendations for Hosts
- Target domestic marketing efforts towards travelers from Seville and Madrid.
- Tailor amenities and listing descriptions to appeal to the dominant Post-2000s (Gen Z/Alpha) demographic (e.g., highlight fast WiFi, smart home features, local guides).
- Highlight unique local experiences or amenities relevant to the primary guest profile.
- Consider seasonal promotions aligned with peak travel times for key origin markets.
Nearby Short-Term Rental Market Comparison
How does the Chipiona Airbnb market stack up against its neighbors? Compare key performance metrics like average monthly revenue, ADR, and occupancy rates in surrounding areas to understand the broader regional STR landscape.
| Market | Active Properties | Monthly Revenue | Daily Rate | Avg. Occupancy |
|---|---|---|---|---|
| Gelves | 26 | $2,989 | $190.74 | 54% |
| Benahavís | 518 | $2,914 | $430.92 | 39% |
| El Paraíso | 13 | $2,679 | $369.93 | 45% |
| Guillena | 35 | $2,502 | $256.76 | 38% |
| Cantillana | 10 | $2,375 | $199.78 | 35% |
| Seville | 7,019 | $2,331 | $174.88 | 50% |
| Gerena | 10 | $2,307 | $277.29 | 38% |
| Marchena | 23 | $2,267 | $344.26 | 37% |
| San Roque | 293 | $2,258 | $329.56 | 39% |
| São Brás de Alportel | 128 | $2,174 | $285.02 | 43% |