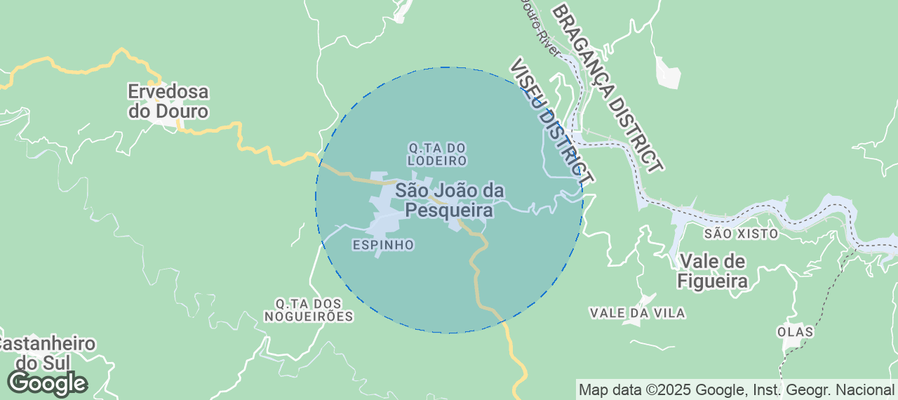
São João da Pesqueira Airbnb Market Analysis 2026: Short Term Rental Data & Vacation Rental Statistics in Viseu, Portugal
Is Airbnb profitable in São João da Pesqueira in 2026? Explore comprehensive Airbnb analytics for São João da Pesqueira, Viseu, Portugal to uncover income potential. This 2026 STR market report for São João da Pesqueira, based on AirROI data from February 2025 to January 2026, reveals key trends in the niche market of 30 active listings.
Whether you're considering an Airbnb investment in São João da Pesqueira, optimizing your existing vacation rental, or exploring rental arbitrage opportunities, understanding the São João da Pesqueira Airbnb data is crucial. Navigating the high regulation landscape is key to maximizing your short term rental income potential. Let's dive into the specifics.
Key São João da Pesqueira Airbnb Performance Metrics Overview
Monthly Airbnb Revenue Variations & Income Potential in São João da Pesqueira (2026)
Understanding the monthly revenue variations for Airbnb listings in São João da Pesqueira is key to maximizing your short term rental income potential. Seasonality significantly impacts earnings. Our analysis, based on data from the past 12 months, shows that the peak revenue month for STRs in São João da Pesqueira is typically August, while January often presents the lowest earnings, highlighting opportunities for strategic pricing adjustments during shoulder and low seasons. Explore the typical Airbnb income in São João da Pesqueira across different performance tiers:
- Best-in-class properties (Top 10%) achieve $3,680+ monthly, often utilizing dynamic pricing and superior guest experiences.
- Strong performing properties (Top 25%) earn $1,652 or more, indicating effective management and desirable locations/amenities.
- Typical properties (Median) generate around $845 per month, representing the average market performance.
- Entry-level properties (Bottom 25%) see earnings around $371, often with potential for optimization.
Average Monthly Airbnb Earnings Trend in São João da Pesqueira
São João da Pesqueira Airbnb Occupancy Rate Trends (2026)
Maximize your bookings by understanding the São João da Pesqueira STR occupancy trends. Seasonal demand shifts significantly influence how often properties are booked. Typically, Augustsees the highest demand (peak season occupancy), while January experiences the lowest (low season). Effective strategies, like adjusting minimum stays or offering promotions, can boost occupancy during slower periods. Here's how different property tiers perform in São João da Pesqueira:
- Best-in-class properties (Top 10%) achieve 55%+ occupancy, indicating high desirability and potentially optimized availability.
- Strong performing properties (Top 25%) maintain 39% or higher occupancy, suggesting good market fit and guest satisfaction.
- Typical properties (Median) have an occupancy rate around 24%.
- Entry-level properties (Bottom 25%) average 11% occupancy, potentially facing higher vacancy.
Average Monthly Occupancy Rate Trend in São João da Pesqueira
Average Daily Rate (ADR) Airbnb Trends in São João da Pesqueira (2026)
Effective short term rental pricing strategy in São João da Pesqueira involves understanding monthly ADR fluctuations. The Average Daily Rate (ADR) for Airbnb in São João da Pesqueira typically peaks in August and dips lowest during February. Leveraging Airbnb dynamic pricing tools or strategies based on this seasonality can significantly boost revenue. Here's a look at the typical nightly rates achieved:
- Best-in-class properties (Top 10%) command rates of $237+ per night, often due to premium features or locations.
- Strong performing properties (Top 25%) achieve nightly rates of $152 or more.
- Typical properties (Median) charge around $101 per night.
- Entry-level properties (Bottom 25%) earn around $77 per night.
Average Daily Rate (ADR) Trend by Month in São João da Pesqueira
Get Live São João da Pesqueira Market Intelligence 👇
Explore Real-time Analytics
Airbnb Seasonality Analysis & Trends in São João da Pesqueira (2026)
Peak Season (August, July, September)
- Revenue averages $2,960 per month
- Occupancy rates average 45.3%
- Daily rates average $171
Shoulder Season
- Revenue averages $1,496 per month
- Occupancy maintains around 23.9%
- Daily rates hold near $144
Low Season (January, November, December)
- Revenue drops to average $770 per month
- Occupancy decreases to average 16.7%
- Daily rates adjust to average $149
Seasonality Insights for São João da Pesqueira
- The Airbnb seasonality in São João da Pesqueira shows highly seasonal trends requiring careful strategy. While the sections above show seasonal averages, it's also insightful to look at the extremes:
- During the high season, the absolute peak month showcases São João da Pesqueira's highest earning potential, with monthly revenues capable of climbing to $3,853, occupancy reaching a high of 62.6%, and ADRs peaking at $181.
- Conversely, the slowest single month of the year, typically falling within the low season, marks the market's lowest point. In this month, revenue might dip to $494, occupancy could drop to 12.4%, and ADRs may adjust down to $135.
- Understanding both the seasonal averages and these monthly peaks and troughs in revenue, occupancy, and ADR is crucial for maximizing your Airbnb profit potential in São João da Pesqueira.
Seasonal Strategies for Maximizing Profit
- Peak Season: Maximize revenue through premium pricing and potentially longer minimum stays. Ensure high availability.
- Low Season: Offer competitive pricing, special promotions (e.g., extended stay discounts), and flexible cancellation policies. Target off-season travelers like remote workers or budget-conscious guests.
- Shoulder Seasons: Implement dynamic pricing that balances peak and low rates. Target weekend travelers or specific events. Offer slightly more flexible terms than peak season.
- Regularly analyze your own performance against these São João da Pesqueira seasonality benchmarks and adjust your pricing and availability strategy accordingly.
Best Areas for Airbnb Investment in São João da Pesqueira (2026)
Exploring the top neighborhoods for short-term rentals in São João da Pesqueira? This section highlights key areas, outlining why they are attractive for hosts and guests, along with notable local attractions. Consider these locations based on your target guest profile and investment strategy.
| Neighborhood / Area | Why Host Here? (Target Guests & Appeal) | Key Attractions & Landmarks |
|---|---|---|
| São João da Pesqueira Centre | The heart of the town featuring historical architecture and local restaurants. It's a charming area that attracts tourists interested in exploring the cultural heritage of the Douro Valley. | Igreja Matriz de São João da Pesqueira, Museu do Douro, Cascata de S. João, Wine Cellars, Local Artisan Shops |
| Douro Valley Vineyards | Famous for its terraced vineyards and breathtaking landscapes. Perfect for wine tourism, attracting guests looking to explore the scenic Douro wine region. | Quinta do Crasto, Quinta da Pacheca, Douro River Cruises, Wine Tastings, Hiking Trails |
| Cais da Vila | A picturesque riverside area that offers a beautiful view of the Douro River. Ideal for relaxing walks and enjoying local cafes. | River Douro Views, Boat Tours, Cafes and Restaurants, Fishing Spots |
| Santuario de Nossa Senhora da Conceição | A significant religious site that attracts visitors interested in history and spirituality. Visitors often seek accommodations near historical landmarks. | Historical Church, Pilgrimage Events, Local Markets |
| Miradouro do Torgal | A panoramic viewpoint offering stunning views of the Douro Valley. It's a popular spot for tourists looking to capture breathtaking photographs. | Scenic Views, Photography Opportunities, Picnic Areas |
| Trancoso Nearby | Proximity to the village of Trancoso, known for its medieval castle and historical significance. Offers a mix of nature and history. | Castle of Trancoso, Old Town, Cultural Festivals |
| Local Wine Estates | Home to several renowned wine estates that provide tours and tastings, attracting wine enthusiasts all year round. | Wine Tasting Tours, Grape Harvesting, Vineyard Walks |
| Natural Parks | Situated near natural parks that offer hiking, biking, and nature exploration, appealing to guests who love the outdoors. | Duarte Pacheco Natural Park, Hiking Trails, Wildlife Views |
Understanding Airbnb License Requirements & STR Laws in São João da Pesqueira (2026)
Yes, São João da Pesqueira, Viseu, Portugal enforces high STR regulations. Obtaining a license and ensuring compliance is almost certainly required according to current 2026 STR laws. Always verify the latest short term rental regulations and Airbnb license requirements directly with local government authorities for São João da Pesqueira to ensure full compliance before hosting.
(Source: AirROI data, 2026, based on 93% licensed listings)
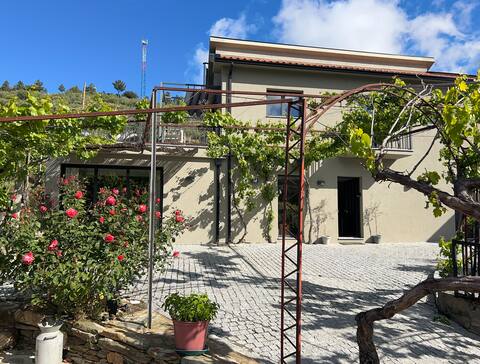
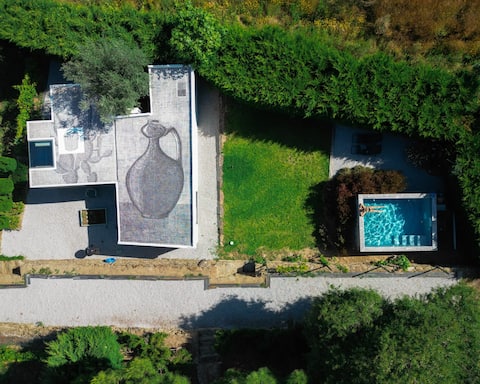
Top Performing Airbnb Properties in São João da Pesqueira (2026)
Benchmark your potential! Explore examples of top-performing Airbnb properties in São João da Pesqueirabased on Trailing Twelve Month (TTM) revenue. Analyze their characteristics, revenue, occupancy rate, and ADR to understand what drives success in this market.

Valadouro : The Villa - Swimming pool and a view
Entire Place • 5 bedrooms

Stunning Boutique Vineyard Stay
Entire Place • 5 bedrooms
Douro Valley Cottage
Entire Place • 3 bedrooms
BABhouse Villa Garden Oliveiras
Entire Place • 1 bedroom
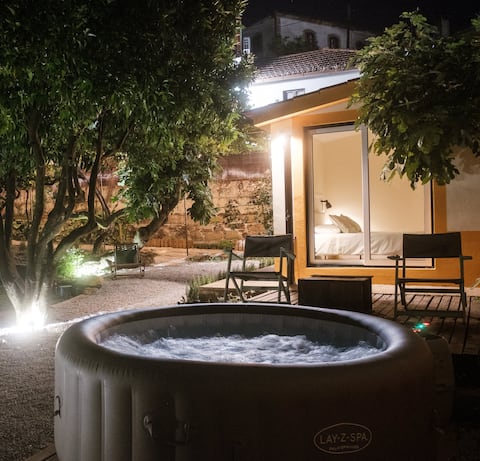
BABhouse Villa Garden Laranjeira
Entire Place • 1 bedroom

BABhouse Casa do Avô Pedoucas - Heart of Douro
Entire Place • 2 bedrooms
Note: Performance varies based on location, size, amenities, seasonality, and management quality. Data reflects the past 12 months.
Top Performing Airbnb Hosts in São João da Pesqueira (2026)
Learn from the best! This table showcases top-performing Airbnb hosts in São João da Pesqueira based on the number of properties managed and estimated total revenue over the past year. Analyze their scale and performance metrics.
| Host Name | Properties | Grossing Revenue | Stay Reviews | Avg Rating |
|---|---|---|---|---|
| Sophie | 2 | $142,763 | 165 | 4.98/5.0 |
| Leonor | 10 | $106,111 | 438 | 4.78/5.0 |
| Philippa And Paul | 1 | $98,602 | 77 | 4.97/5.0 |
| Jose | 3 | $41,130 | 55 | 4.77/5.0 |
| Antónia | 6 | $19,010 | 18 | 4.71/5.0 |
| Natalia | 3 | $16,204 | 18 | 5.00/5.0 |
| Emidio | 1 | $13,259 | 11 | 4.82/5.0 |
| Maria | 1 | $11,115 | 13 | 4.85/5.0 |
| Rita | 1 | $5,613 | 31 | 4.71/5.0 |
| Sónia | 1 | $2,258 | 64 | 4.83/5.0 |
Analyzing the strategies of top hosts, such as their property selection, pricing, and guest communication, can offer valuable lessons for optimizing your own Airbnb operations in São João da Pesqueira.
Dive Deeper: Advanced São João da Pesqueira STR Market Data (2026)
Ready to unlock more insights? AirROI provides access to advanced metrics and comprehensive Airbnb data for São João da Pesqueira. Explore detailed analytics beyond this report to refine your investment strategy, optimize pricing, and maximize your vacation rental profits.
Explore Advanced MetricsSão João da Pesqueira Short-Term Rental Market Composition (2026): Property & Room Types
Room Type Distribution
Property Type Distribution
Market Composition Insights for São João da Pesqueira
- The São João da Pesqueira Airbnb market composition is heavily skewed towards Entire Home/Apt listings, which make up 86.7% of the 30 active rentals. This indicates strong guest preference for privacy and space.
- Looking at the property type distribution in São João da Pesqueira, House properties are the most common (40%), reflecting the local real estate landscape.
- Houses represent a significant 40% portion, catering likely to families or larger groups.
- The presence of 16.7% Hotel/Boutique listings indicates integration with traditional hospitality.
São João da Pesqueira Airbnb Room Capacity Analysis (2026): Bedroom Distribution
Distribution of Listings by Number of Bedrooms
Room Capacity Insights for São João da Pesqueira
- The dominant room capacity in São João da Pesqueira is 1 bedroom listings, making up 43.3% of the market. This suggests a strong demand for properties suitable for couples or solo travelers.
- Together, 1 bedroom and 2 bedrooms properties represent 66.6% of the active Airbnb listings in São João da Pesqueira, indicating a high concentration in these sizes.
- A significant 30.1% of listings offer 3+ bedrooms, catering to larger groups and families seeking more space in São João da Pesqueira.
São João da Pesqueira Vacation Rental Guest Capacity Trends (2026)
Distribution of Listings by Guest Capacity
Guest Capacity Insights for São João da Pesqueira
- The most common guest capacity trend in São João da Pesqueira vacation rentals is listings accommodating 2 guests (33.3%). This suggests the primary traveler segment is likely couples or solo travelers.
- Properties designed for 2 guests and 4 guests dominate the São João da Pesqueira STR market, accounting for 53.3% of listings.
- 33.4% of properties accommodate 6+ guests, serving the market segment for larger families or group travel in São João da Pesqueira.
- On average, properties in São João da Pesqueira are equipped to host 4.3 guests.
São João da Pesqueira Airbnb Booking Patterns (2026): Available vs. Booked Days
Available Days Distribution
Booked Days Distribution
Booking Pattern Insights for São João da Pesqueira
- The most common availability pattern in São João da Pesqueira falls within the 271-366 days range, representing 66.7% of listings. This suggests many properties have significant open periods on their calendars.
- Approximately 96.7% of listings show high availability (181+ days open annually), indicating potential for increased bookings or specific owner usage patterns.
- For booked days, the 31-90 days range is most frequent in São João da Pesqueira (46.7%), reflecting common guest stay durations or potential owner blocking patterns.
- A notable 3.3% of properties secure long booking periods (181+ days booked per year), highlighting successful long-term rental strategies or significant owner usage.
São João da Pesqueira Airbnb Minimum Stay Requirements Analysis
Distribution of Listings by Minimum Night Requirement
1 Night
5 listings
16.7% of total
2 Nights
15 listings
50% of total
4-6 Nights
1 listings
3.3% of total
30+ Nights
9 listings
30% of total
Key Insights
- The most prevalent minimum stay requirement in São João da Pesqueira is 2 Nights, adopted by 50% of listings. This highlights the market's preference for shorter, flexible bookings.
- A strong majority (66.7%) of the São João da Pesqueira Airbnb data shows acceptance of very short stays (1-2 nights), indicating a dynamic, high-turnover market.
- A significant segment (30%) caters to monthly stays (30+ nights) in São João da Pesqueira, pointing to opportunities in the extended-stay market.
Recommendations
- Align with the market by considering a 2 Nights minimum stay, as 50% of São João da Pesqueira hosts use this setting.
- If feasible, allowing 1-night stays, especially midweek or during low season, could capture last-minute bookings, as only 16.7% currently do.
- A 2-night minimum appears standard (50%). Consider this for weekends or peak periods.
- Explore offering discounts for stays of 30+ nights to attract the 30% of the market seeking extended stays.
- Adjust minimum nights based on seasonality – potentially shorter during low season and longer during peak demand periods in São João da Pesqueira.
São João da Pesqueira Airbnb Cancellation Policy Trends Analysis (2026)
Flexible
1 listings
3.3% of total
Moderate
15 listings
50% of total
Firm
8 listings
26.7% of total
Strict
6 listings
20% of total
Cancellation Policy Insights for São João da Pesqueira
- The prevailing Airbnb cancellation policy trend in São João da Pesqueira is Moderate, used by 50% of listings.
- There's a relatively balanced mix between guest-friendly (53.3%) and stricter (46.7%) policies, offering choices for different guest needs.
Recommendations for Hosts
- Consider adopting a Moderate policy to align with the 50% market standard in São João da Pesqueira.
- Regularly review your cancellation policy against competitors and market demand shifts in São João da Pesqueira.
São João da Pesqueira STR Booking Lead Time Analysis (2026)
Average Booking Lead Time by Month
Booking Lead Time Insights for São João da Pesqueira
- The overall average booking lead time for vacation rentals in São João da Pesqueira is 49 days.
- Guests book furthest in advance for stays during October (average 82 days), likely coinciding with peak travel demand or local events.
- The shortest booking windows occur for stays in January (average 8 days), indicating more last-minute travel plans during this time.
- Seasonally, Summer (59 days avg.) sees the longest lead times, while Winter (21 days avg.) has the shortest, reflecting typical travel planning cycles.
Recommendations for Hosts
- Use the overall average lead time (49 days) as a baseline for your pricing and availability strategy in São João da Pesqueira.
- For October stays, consider implementing length-of-stay discounts or slightly higher rates for bookings made less than 82 days out to capitalize on advance planning.
- During January, focus on last-minute booking availability and promotions, as guests book with very short notice (8 days avg.).
- Target marketing efforts for the Summer season well in advance (at least 59 days) to capture early planners.
- Monitor your own booking lead times against these São João da Pesqueira averages to identify opportunities for dynamic pricing adjustments.
Popular & Essential Airbnb Amenities in São João da Pesqueira (2026)
Amenity Prevalence
Amenity Insights for São João da Pesqueira
- Essential amenities in São João da Pesqueira that guests expect include: Wifi. Lacking these (this) could significantly impact bookings.
- Popular amenities like Fire extinguisher, Bed linens, First aid kit are common but not universal. Offering these can provide a competitive edge.
Recommendations for Hosts
- Ensure your listing includes all essential amenities for São João da Pesqueira: Wifi.
- Consider adding popular differentiators like Fire extinguisher or Bed linens to increase appeal.
- Highlight unique or less common amenities you offer (e.g., hot tub, dedicated workspace, EV charger) in your listing description and photos.
- Regularly check competitor amenities in São João da Pesqueira to stay competitive.
São João da Pesqueira Airbnb Guest Demographics & Profile Analysis (2026)
Guest Profile Summary for São João da Pesqueira
- The typical guest profile for Airbnb in São João da Pesqueira consists of predominantly international visitors (82%), with top international origins including France, typically belonging to the Post-2000s (Gen Z/Alpha) group (50%), primarily speaking English or French.
- Domestic travelers account for 18.5% of guests.
- Key international markets include Portugal (18.5%) and France (13.8%).
- Top languages spoken are English (40.2%) followed by French (22.3%).
- A significant demographic segment is the Post-2000s (Gen Z/Alpha) group, representing 50% of guests.
Recommendations for Hosts
- Focus marketing internationally, particularly towards travelers from France.
- Tailor amenities and listing descriptions to appeal to the dominant Post-2000s (Gen Z/Alpha) demographic (e.g., highlight fast WiFi, smart home features, local guides).
- Highlight unique local experiences or amenities relevant to the primary guest profile.
- Consider seasonal promotions aligned with peak travel times for key origin markets.
Nearby Short-Term Rental Market Comparison
How does the São João da Pesqueira Airbnb market stack up against its neighbors? Compare key performance metrics like average monthly revenue, ADR, and occupancy rates in surrounding areas to understand the broader regional STR landscape.
| Market | Active Properties | Monthly Revenue | Daily Rate | Avg. Occupancy |
|---|---|---|---|---|
| Penhalonga e Paços de Gaiolo | 23 | $4,304 | $357.04 | 40% |
| Sande e São Lourenço do Douro | 19 | $3,009 | $319.97 | 37% |
| Armamar | 66 | $2,578 | $266.43 | 36% |
| Alpendorada, Várzea e Torrão | 19 | $2,503 | $264.40 | 35% |
| Vila Boa de Quires e Maureles | 10 | $2,316 | $202.63 | 48% |
| Alijó | 69 | $2,072 | $250.65 | 30% |
| Cinfães | 16 | $2,059 | $253.86 | 28% |
| Portomarín | 12 | $2,006 | $181.90 | 49% |
| Barreiros | 10 | $1,928 | $192.32 | 39% |
| Mesão Frio | 58 | $1,896 | $182.28 | 42% |