Grândola Airbnb Market Analysis 2026: Short Term Rental Data & Vacation Rental Statistics in Setúbal, Portugal
Is Airbnb profitable in Grândola in 2026? Explore comprehensive Airbnb analytics for Grândola, Setúbal, Portugal to uncover income potential. This 2026 STR market report for Grândola, based on AirROI data from February 2025 to January 2026, reveals key trends in the market of 333 active listings.
Whether you're considering an Airbnb investment in Grândola, optimizing your existing vacation rental, or exploring rental arbitrage opportunities, understanding the Grândola Airbnb data is crucial. Navigating the high regulation landscape is key to maximizing your short term rental income potential. Let's dive into the specifics.
Key Grândola Airbnb Performance Metrics Overview
Monthly Airbnb Revenue Variations & Income Potential in Grândola (2026)
Understanding the monthly revenue variations for Airbnb listings in Grândola is key to maximizing your short term rental income potential. Seasonality significantly impacts earnings. Our analysis, based on data from the past 12 months, shows that the peak revenue month for STRs in Grândola is typically August, while February often presents the lowest earnings, highlighting opportunities for strategic pricing adjustments during shoulder and low seasons. Explore the typical Airbnb income in Grândola across different performance tiers:
- Best-in-class properties (Top 10%) achieve $9,907+ monthly, often utilizing dynamic pricing and superior guest experiences.
- Strong performing properties (Top 25%) earn $4,950 or more, indicating effective management and desirable locations/amenities.
- Typical properties (Median) generate around $2,331 per month, representing the average market performance.
- Entry-level properties (Bottom 25%) see earnings around $1,041, often with potential for optimization.
Average Monthly Airbnb Earnings Trend in Grândola
Grândola Airbnb Occupancy Rate Trends (2026)
Maximize your bookings by understanding the Grândola STR occupancy trends. Seasonal demand shifts significantly influence how often properties are booked. Typically, Augustsees the highest demand (peak season occupancy), while January experiences the lowest (low season). Effective strategies, like adjusting minimum stays or offering promotions, can boost occupancy during slower periods. Here's how different property tiers perform in Grândola:
- Best-in-class properties (Top 10%) achieve 66%+ occupancy, indicating high desirability and potentially optimized availability.
- Strong performing properties (Top 25%) maintain 48% or higher occupancy, suggesting good market fit and guest satisfaction.
- Typical properties (Median) have an occupancy rate around 28%.
- Entry-level properties (Bottom 25%) average 13% occupancy, potentially facing higher vacancy.
Average Monthly Occupancy Rate Trend in Grândola
Average Daily Rate (ADR) Airbnb Trends in Grândola (2026)
Effective short term rental pricing strategy in Grândola involves understanding monthly ADR fluctuations. The Average Daily Rate (ADR) for Airbnb in Grândola typically peaks in August and dips lowest during February. Leveraging Airbnb dynamic pricing tools or strategies based on this seasonality can significantly boost revenue. Here's a look at the typical nightly rates achieved:
- Best-in-class properties (Top 10%) command rates of $945+ per night, often due to premium features or locations.
- Strong performing properties (Top 25%) achieve nightly rates of $508 or more.
- Typical properties (Median) charge around $258 per night.
- Entry-level properties (Bottom 25%) earn around $154 per night.
Average Daily Rate (ADR) Trend by Month in Grândola
Get Live Grândola Market Intelligence 👇

Explore Real-time Analytics
Airbnb Seasonality Analysis & Trends in Grândola (2026)
Peak Season (August, July, September)
- Revenue averages $7,877 per month
- Occupancy rates average 51.4%
- Daily rates average $464
Shoulder Season
- Revenue averages $3,494 per month
- Occupancy maintains around 28.9%
- Daily rates hold near $395
Low Season (January, February, November)
- Revenue drops to average $1,769 per month
- Occupancy decreases to average 21.3%
- Daily rates adjust to average $393
Seasonality Insights for Grândola
- The Airbnb seasonality in Grândola shows highly seasonal trends requiring careful strategy. While the sections above show seasonal averages, it's also insightful to look at the extremes:
- During the high season, the absolute peak month showcases Grândola's highest earning potential, with monthly revenues capable of climbing to $10,184, occupancy reaching a high of 63.5%, and ADRs peaking at $470.
- Conversely, the slowest single month of the year, typically falling within the low season, marks the market's lowest point. In this month, revenue might dip to $1,512, occupancy could drop to 15.0%, and ADRs may adjust down to $358.
- Understanding both the seasonal averages and these monthly peaks and troughs in revenue, occupancy, and ADR is crucial for maximizing your Airbnb profit potential in Grândola.
Seasonal Strategies for Maximizing Profit
- Peak Season: Maximize revenue through premium pricing and potentially longer minimum stays. Ensure high availability.
- Low Season: Offer competitive pricing, special promotions (e.g., extended stay discounts), and flexible cancellation policies. Target off-season travelers like remote workers or budget-conscious guests.
- Shoulder Seasons: Implement dynamic pricing that balances peak and low rates. Target weekend travelers or specific events. Offer slightly more flexible terms than peak season.
- Regularly analyze your own performance against these Grândola seasonality benchmarks and adjust your pricing and availability strategy accordingly.
Best Areas for Airbnb Investment in Grândola (2026)
Exploring the top neighborhoods for short-term rentals in Grândola? This section highlights key areas, outlining why they are attractive for hosts and guests, along with notable local attractions. Consider these locations based on your target guest profile and investment strategy.
| Neighborhood / Area | Why Host Here? (Target Guests & Appeal) | Key Attractions & Landmarks |
|---|---|---|
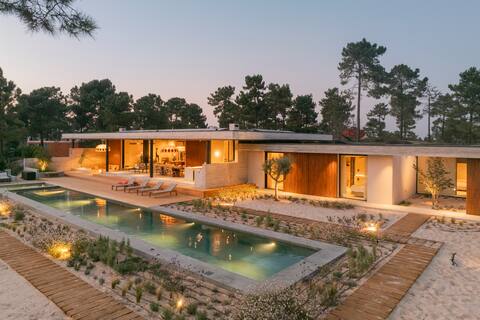
| Comporta | A beautiful coastal area known for its stunning beaches and tranquility. Popular among tourists looking for a relaxing getaway with picturesque landscapes and a unique charm. | Comporta Beach, Pêgo Beach, Carrasqueira Palafitte, Praia dos Galápos, Ria Formosa Natural Park |
| Troia | An upscale beachfront resort area known for its natural beauty and golf courses. Attracts visitors who enjoy sunbathing, watersports, and golf, making it perfect for luxury stays. | Troia Beach, Troia Golf, Archaeological Museum, Lisbon River Cruise, Sado River Dolphin Watching |
| Grandola | A historic town that offers a more authentic Portuguese experience with its cultural heritage and local cuisine. Great for Airbnb hosts looking to attract visitors who want to explore traditional Portugal. | Igreja da Nossa Senhora da Conceição, Museu Municipal de Grândola, Casa da Música de Grândola, Rio Grândola, local wine and olive oil tours |
| Sines | A coastal town with a rich maritime history. It attracts both beachgoers and history enthusiasts, ideal for hosting guests interested in culture and exploration. | Sines Castle, Praia de São Torpes, Centro de Interpretação Ambiental, Museum of Sines, local seafood restaurants |
| Melides | A hidden gem known for its tranquil beaches and charming countryside. Appeals to visitors looking for peace and natural beauty away from crowded tourist spots. | Melides Beach, Melides Lagoon, Cacimbinhas Beach, Café Com Cenas, local artisan markets |
| Alcáçeras do Sal | A picturesque town famous for its salt flats and birdwatching. Ideal for eco-tourism and attracting nature lovers and photographers. | Salt Flats, Natural Reserve of the Sado River, historical saltworks, local festivals, birdwatching tours |
| Setúbal | A vibrant city known for its beautiful coastline and rich gastronomy. Attracts foodies and beach lovers looking to experience the best of Portuguese cuisine and culture. | Arrábida Natural Park, Setúbal Marina, São Filipe Castle, local seafood markets, Troia Peninsula |
| Palácio da Galé | A luxurious seaside resort area that offers high-end accommodation options. Ideal for attracting affluent tourists seeking premium experiences. | luxury beach clubs, fine dining restaurants, yacht rentals, golf courses, nearby wine regions |
Understanding Airbnb License Requirements & STR Laws in Grândola (2026)
Yes, Grândola, Setúbal, Portugal enforces high STR regulations. Obtaining a license and ensuring compliance is almost certainly required according to current 2026 STR laws. Always verify the latest short term rental regulations and Airbnb license requirements directly with local government authorities for Grândola to ensure full compliance before hosting.
(Source: AirROI data, 2026, based on 80% licensed listings)
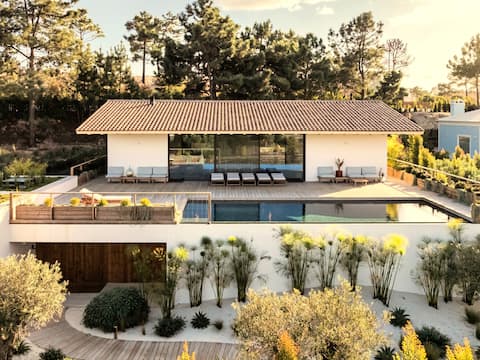
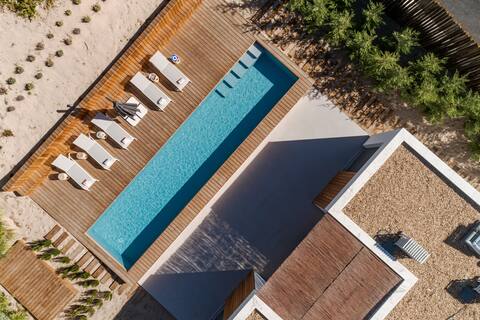
Top Performing Airbnb Properties in Grândola (2026)
Benchmark your potential! Explore examples of top-performing Airbnb properties in Grândolabased on Trailing Twelve Month (TTM) revenue. Analyze their characteristics, revenue, occupancy rate, and ADR to understand what drives success in this market.
M Villa Comporta Retreat
Entire Place • 6 bedrooms
Melides Beach Villa - Silence
Entire Place • 5 bedrooms
Villa Formosa | Carvalhal
Entire Place • 5 bedrooms
Casa da Paliçada, Pego Beach, Comporta
Entire Place • 4 bedrooms

Unique luxury villa by the sea
Entire Place • 5 bedrooms
Comporta, beach house, 10 invités, Pego beach
Entire Place • 5 bedrooms
Note: Performance varies based on location, size, amenities, seasonality, and management quality. Data reflects the past 12 months.
Top Performing Airbnb Hosts in Grândola (2026)
Learn from the best! This table showcases top-performing Airbnb hosts in Grândola based on the number of properties managed and estimated total revenue over the past year. Analyze their scale and performance metrics.
| Host Name | Properties | Grossing Revenue | Stay Reviews | Avg Rating |
|---|---|---|---|---|
| Guilherme | 9 | $768,445 | 261 | 4.89/5.0 |
| Martim Oliveira | 1 | $379,509 | 3 | 4.67/5.0 |
| Allure Villas | 8 | $305,663 | 44 | 4.82/5.0 |
| Mui | 8 | $294,007 | 64 | 4.78/5.0 |
| Patricia | 1 | $230,749 | 28 | 5.00/5.0 |
| Nuno | 1 | $194,240 | 22 | 5.00/5.0 |
| George | 1 | $186,981 | 2 | Not Rated |
| Delphine | 1 | $185,737 | 48 | 5.00/5.0 |
| Ed | 1 | $182,693 | 48 | 4.98/5.0 |
| Herdade Do Montum | 8 | $180,746 | 341 | 4.83/5.0 |
Analyzing the strategies of top hosts, such as their property selection, pricing, and guest communication, can offer valuable lessons for optimizing your own Airbnb operations in Grândola.
Dive Deeper: Advanced Grândola STR Market Data (2026)
Ready to unlock more insights? AirROI provides access to advanced metrics and comprehensive Airbnb data for Grândola. Explore detailed analytics beyond this report to refine your investment strategy, optimize pricing, and maximize your vacation rental profits.
Explore Advanced MetricsGrândola Short-Term Rental Market Composition (2026): Property & Room Types
Room Type Distribution
Property Type Distribution
Market Composition Insights for Grândola
- The Grândola Airbnb market composition is heavily skewed towards Entire Home/Apt listings, which make up 91.3% of the 333 active rentals. This indicates strong guest preference for privacy and space.
- Looking at the property type distribution in Grândola, House properties are the most common (65.5%), reflecting the local real estate landscape.
- Houses represent a significant 65.5% portion, catering likely to families or larger groups.
- Smaller segments like hotel/boutique, others, unique stays (combined 5.1%) offer potential for unique stay experiences.
Grândola Airbnb Room Capacity Analysis (2026): Bedroom Distribution
Distribution of Listings by Number of Bedrooms
Room Capacity Insights for Grândola
- The dominant room capacity in Grândola is 2 bedrooms listings, making up 25.2% of the market. This suggests a strong demand for properties suitable for couples or solo travelers.
- Together, 2 bedrooms and 3 bedrooms properties represent 47.1% of the active Airbnb listings in Grândola, indicating a high concentration in these sizes.
- A significant 52.5% of listings offer 3+ bedrooms, catering to larger groups and families seeking more space in Grândola.
Grândola Vacation Rental Guest Capacity Trends (2026)
Distribution of Listings by Guest Capacity
Guest Capacity Insights for Grândola
- The most common guest capacity trend in Grândola vacation rentals is listings accommodating 8+ guests (34.5%). This suggests the primary traveler segment is likely larger groups.
- Properties designed for 8+ guests and 4 guests dominate the Grândola STR market, accounting for 54.3% of listings.
- 58.2% of properties accommodate 6+ guests, serving the market segment for larger families or group travel in Grândola.
- On average, properties in Grândola are equipped to host 5.6 guests.
Grândola Airbnb Booking Patterns (2026): Available vs. Booked Days
Available Days Distribution
Booked Days Distribution
Booking Pattern Insights for Grândola
- The most common availability pattern in Grândola falls within the 271-366 days range, representing 69.7% of listings. This suggests many properties have significant open periods on their calendars.
- Approximately 93.1% of listings show high availability (181+ days open annually), indicating potential for increased bookings or specific owner usage patterns.
- For booked days, the 31-90 days range is most frequent in Grândola (39.6%), reflecting common guest stay durations or potential owner blocking patterns.
- A notable 6.9% of properties secure long booking periods (181+ days booked per year), highlighting successful long-term rental strategies or significant owner usage.
Grândola Airbnb Minimum Stay Requirements Analysis
Distribution of Listings by Minimum Night Requirement
1 Night
26 listings
7.8% of total
2 Nights
43 listings
12.9% of total
3 Nights
27 listings
8.1% of total
4-6 Nights
79 listings
23.7% of total
7-29 Nights
18 listings
5.4% of total
30+ Nights
140 listings
42% of total
Key Insights
- The most prevalent minimum stay requirement in Grândola is 30+ Nights, adopted by 42% of listings. This highlights the market's preference for longer commitments.
- A significant segment (42%) caters to monthly stays (30+ nights) in Grândola, pointing to opportunities in the extended-stay market.
Recommendations
- Align with the market by considering a 30+ Nights minimum stay, as 42% of Grândola hosts use this setting.
- If feasible, allowing 1-night stays, especially midweek or during low season, could capture last-minute bookings, as only 7.8% currently do.
- Explore offering discounts for stays of 30+ nights to attract the 42% of the market seeking extended stays.
- Adjust minimum nights based on seasonality – potentially shorter during low season and longer during peak demand periods in Grândola.
Grândola Airbnb Cancellation Policy Trends Analysis (2026)
Super Strict 60 Days
16 listings
4.9% of total
Super Strict 30 Days
10 listings
3.1% of total
Limited
2 listings
0.6% of total
Flexible
40 listings
12.3% of total
Moderate
54 listings
16.6% of total
Firm
149 listings
45.7% of total
Strict
55 listings
16.9% of total
Cancellation Policy Insights for Grândola
- The prevailing Airbnb cancellation policy trend in Grândola is Firm, used by 45.7% of listings.
- A majority (62.6%) of hosts in Grândola utilize Firm or Strict policies, indicating a market where hosts prioritize booking security.
Recommendations for Hosts
- Consider adopting a Firm policy to align with the 45.7% market standard in Grândola.
- Regularly review your cancellation policy against competitors and market demand shifts in Grândola.
Grândola STR Booking Lead Time Analysis (2026)
Average Booking Lead Time by Month
Booking Lead Time Insights for Grândola
- The overall average booking lead time for vacation rentals in Grândola is 60 days.
- Guests book furthest in advance for stays during August (average 113 days), likely coinciding with peak travel demand or local events.
- The shortest booking windows occur for stays in February (average 26 days), indicating more last-minute travel plans during this time.
- Seasonally, Summer (80 days avg.) sees the longest lead times, while Winter (32 days avg.) has the shortest, reflecting typical travel planning cycles.
Recommendations for Hosts
- Use the overall average lead time (60 days) as a baseline for your pricing and availability strategy in Grândola.
- For August stays, consider implementing length-of-stay discounts or slightly higher rates for bookings made less than 113 days out to capitalize on advance planning.
- Target marketing efforts for the Summer season well in advance (at least 80 days) to capture early planners.
- Monitor your own booking lead times against these Grândola averages to identify opportunities for dynamic pricing adjustments.
Popular & Essential Airbnb Amenities in Grândola (2026)
Amenity Prevalence
Amenity Insights for Grândola
- Popular amenities like Wifi, Kitchen, TV are common but not universal. Offering these can provide a competitive edge.
- Warning: Wifi is not universally provided but is considered essential globally. Ensure reliable Wifi is offered.
Recommendations for Hosts
- Consider adding popular differentiators like Wifi or Kitchen to increase appeal.
- Highlight unique or less common amenities you offer (e.g., hot tub, dedicated workspace, EV charger) in your listing description and photos.
- Regularly check competitor amenities in Grândola to stay competitive.
Grândola Airbnb Guest Demographics & Profile Analysis (2026)
Guest Profile Summary for Grândola
- The typical guest profile for Airbnb in Grândola consists of predominantly international visitors (76%), with top international origins including United Kingdom, typically belonging to the Post-2000s (Gen Z/Alpha) group (50%), primarily speaking English or Portuguese.
- Domestic travelers account for 24.3% of guests.
- Key international markets include Portugal (24.3%) and United Kingdom (16.2%).
- Top languages spoken are English (38.2%) followed by Portuguese (14%).
- A significant demographic segment is the Post-2000s (Gen Z/Alpha) group, representing 50% of guests.
Recommendations for Hosts
- Focus marketing internationally, particularly towards travelers from United Kingdom.
- Tailor amenities and listing descriptions to appeal to the dominant Post-2000s (Gen Z/Alpha) demographic (e.g., highlight fast WiFi, smart home features, local guides).
- Highlight unique local experiences or amenities relevant to the primary guest profile.
- Consider seasonal promotions aligned with peak travel times for key origin markets.
Nearby Short-Term Rental Market Comparison
How does the Grândola Airbnb market stack up against its neighbors? Compare key performance metrics like average monthly revenue, ADR, and occupancy rates in surrounding areas to understand the broader regional STR landscape.
| Market | Active Properties | Monthly Revenue | Daily Rate | Avg. Occupancy |
|---|---|---|---|---|
| Comporta | 111 | $3,719 | $422.92 | 41% |
| Vale da Telha | 12 | $3,225 | $355.35 | 50% |
| Alcácer do Sal | 19 | $3,194 | $386.92 | 32% |
| Guia | 35 | $3,127 | $514.12 | 47% |
| Ferreira do Alentejo | 13 | $3,006 | $280.31 | 39% |
| Albufeira | 5,117 | $2,938 | $295.76 | 47% |
| Reguengo Grande | 13 | $2,843 | $319.66 | 40% |
| Lagoa e Carvoeiro | 1,055 | $2,735 | $258.75 | 50% |
| Olhos de Água | 31 | $2,685 | $326.36 | 49% |
| Ferragudo | 219 | $2,590 | $258.32 | 48% |