Abrantes Airbnb Market Analysis 2026: Short Term Rental Data & Vacation Rental Statistics in Santarém, Portugal
Is Airbnb profitable in Abrantes in 2026? Explore comprehensive Airbnb analytics for Abrantes, Santarém, Portugal to uncover income potential. This 2026 STR market report for Abrantes, based on AirROI data from February 2025 to January 2026, reveals key trends in the niche market of 49 active listings.
Whether you're considering an Airbnb investment in Abrantes, optimizing your existing vacation rental, or exploring rental arbitrage opportunities, understanding the Abrantes Airbnb data is crucial. Navigating the high regulation landscape is key to maximizing your short term rental income potential. Let's dive into the specifics.
Key Abrantes Airbnb Performance Metrics Overview
Monthly Airbnb Revenue Variations & Income Potential in Abrantes (2026)
Understanding the monthly revenue variations for Airbnb listings in Abrantes is key to maximizing your short term rental income potential. Seasonality significantly impacts earnings. Our analysis, based on data from the past 12 months, shows that the peak revenue month for STRs in Abrantes is typically August, while January often presents the lowest earnings, highlighting opportunities for strategic pricing adjustments during shoulder and low seasons. Explore the typical Airbnb income in Abrantes across different performance tiers:
- Best-in-class properties (Top 10%) achieve $3,013+ monthly, often utilizing dynamic pricing and superior guest experiences.
- Strong performing properties (Top 25%) earn $1,825 or more, indicating effective management and desirable locations/amenities.
- Typical properties (Median) generate around $913 per month, representing the average market performance.
- Entry-level properties (Bottom 25%) see earnings around $502, often with potential for optimization.
Average Monthly Airbnb Earnings Trend in Abrantes
Abrantes Airbnb Occupancy Rate Trends (2026)
Maximize your bookings by understanding the Abrantes STR occupancy trends. Seasonal demand shifts significantly influence how often properties are booked. Typically, Augustsees the highest demand (peak season occupancy), while January experiences the lowest (low season). Effective strategies, like adjusting minimum stays or offering promotions, can boost occupancy during slower periods. Here's how different property tiers perform in Abrantes:
- Best-in-class properties (Top 10%) achieve 68%+ occupancy, indicating high desirability and potentially optimized availability.
- Strong performing properties (Top 25%) maintain 42% or higher occupancy, suggesting good market fit and guest satisfaction.
- Typical properties (Median) have an occupancy rate around 27%.
- Entry-level properties (Bottom 25%) average 13% occupancy, potentially facing higher vacancy.
Average Monthly Occupancy Rate Trend in Abrantes
Average Daily Rate (ADR) Airbnb Trends in Abrantes (2026)
Effective short term rental pricing strategy in Abrantes involves understanding monthly ADR fluctuations. The Average Daily Rate (ADR) for Airbnb in Abrantes typically peaks in September and dips lowest during February. Leveraging Airbnb dynamic pricing tools or strategies based on this seasonality can significantly boost revenue. Here's a look at the typical nightly rates achieved:
- Best-in-class properties (Top 10%) command rates of $397+ per night, often due to premium features or locations.
- Strong performing properties (Top 25%) achieve nightly rates of $176 or more.
- Typical properties (Median) charge around $120 per night.
- Entry-level properties (Bottom 25%) earn around $84 per night.
Average Daily Rate (ADR) Trend by Month in Abrantes
Get Live Abrantes Market Intelligence 👇

Explore Real-time Analytics
Airbnb Seasonality Analysis & Trends in Abrantes (2026)
Peak Season (August, July, June)
- Revenue averages $2,372 per month
- Occupancy rates average 45.3%
- Daily rates average $185
Shoulder Season
- Revenue averages $1,342 per month
- Occupancy maintains around 29.8%
- Daily rates hold near $173
Low Season (January, October, November)
- Revenue drops to average $820 per month
- Occupancy decreases to average 20.3%
- Daily rates adjust to average $183
Seasonality Insights for Abrantes
- The Airbnb seasonality in Abrantes shows highly seasonal trends requiring careful strategy. While the sections above show seasonal averages, it's also insightful to look at the extremes:
- During the high season, the absolute peak month showcases Abrantes's highest earning potential, with monthly revenues capable of climbing to $2,768, occupancy reaching a high of 54.1%, and ADRs peaking at $195.
- Conversely, the slowest single month of the year, typically falling within the low season, marks the market's lowest point. In this month, revenue might dip to $491, occupancy could drop to 17.6%, and ADRs may adjust down to $161.
- Understanding both the seasonal averages and these monthly peaks and troughs in revenue, occupancy, and ADR is crucial for maximizing your Airbnb profit potential in Abrantes.
Seasonal Strategies for Maximizing Profit
- Peak Season: Maximize revenue through premium pricing and potentially longer minimum stays. Ensure high availability.
- Low Season: Offer competitive pricing, special promotions (e.g., extended stay discounts), and flexible cancellation policies. Target off-season travelers like remote workers or budget-conscious guests.
- Shoulder Seasons: Implement dynamic pricing that balances peak and low rates. Target weekend travelers or specific events. Offer slightly more flexible terms than peak season.
- Regularly analyze your own performance against these Abrantes seasonality benchmarks and adjust your pricing and availability strategy accordingly.
Best Areas for Airbnb Investment in Abrantes (2026)
Exploring the top neighborhoods for short-term rentals in Abrantes? This section highlights key areas, outlining why they are attractive for hosts and guests, along with notable local attractions. Consider these locations based on your target guest profile and investment strategy.
| Neighborhood / Area | Why Host Here? (Target Guests & Appeal) | Key Attractions & Landmarks |
|---|---|---|
| Centro Histórico | The historical center of Abrantes, known for its rich history, charming streets, and local culture. It's the heart of the city, attracting tourists who want to experience the local lifestyle and cuisine. | Abrantes Castle, Church of São Vicente, Convento de São Domingos, Museu Municipal de Abrantes, Riverside Park |
| Albufeira do Castelo do Bode | A popular destination for nature lovers and water sports enthusiasts. This area offers stunning views, recreational opportunities, and is a great escape for those looking to relax by the water. | Castelo do Bode Dam, Water sports activities, Hiking trails, Picnic areas, Scenic viewpoints |
| Jardim da República | A central park in Abrantes that serves as a relaxing area for both locals and tourists. Ideal for short stays with families or couples looking for leisure time amidst nature. | Gardens, Play areas, Walking paths, Nearby cafes, Cultural events |
| Cabo do Mundo | A scenic viewpoint that offers spectacular views of the Tagus River and the surrounding landscapes. Attracts visitors looking for breathtaking sights and great photography opportunities. | Cabo do Mundo viewpoint, Nature trails, Sunset views, Birdwatching, Relaxation spots |
| Serras de Aire e Candeeiros | A natural park nearby, known for its caves and unique geological formations. Ideal for adventurous travelers who want to explore the natural beauty of Portugal. | Caves, Hiking routes, Natural landscapes, Flora and fauna, Adventure activities |
| Campo de São João | A local neighborhood that showcases everyday life in Abrantes. Offers a more authentic experience for travelers interested in local cuisine and culture. | Local markets, Traditional restaurants, Community events, Cultural exchanges, Local shops |
| Vila Nova da Barquinha | Adjacent to Abrantes, this town features charming riverside attractions and historical sites, ideal for day trips and longer stays visiting the attractions of both locations. | Castle of Almourol, River Tagus activities, Historical routes, Local festivals, Cafés by the water |
| Praia Fluvial de Aldeia do Mato | A river beach that is perfect for summer visitors looking to swim, sunbathe, and enjoy beach activities in a serene environment away from the bustle of the city. | Swimming, Sunbathing, Picnics, Family-friendly activities, Nature scenery |
Understanding Airbnb License Requirements & STR Laws in Abrantes (2026)
Yes, Abrantes, Santarém, Portugal enforces high STR regulations. Obtaining a license and ensuring compliance is almost certainly required according to current 2026 STR laws. Always verify the latest short term rental regulations and Airbnb license requirements directly with local government authorities for Abrantes to ensure full compliance before hosting.
(Source: AirROI data, 2026, based on 76% licensed listings)
Top Performing Airbnb Properties in Abrantes (2026)
Benchmark your potential! Explore examples of top-performing Airbnb properties in Abrantesbased on Trailing Twelve Month (TTM) revenue. Analyze their characteristics, revenue, occupancy rate, and ADR to understand what drives success in this market.
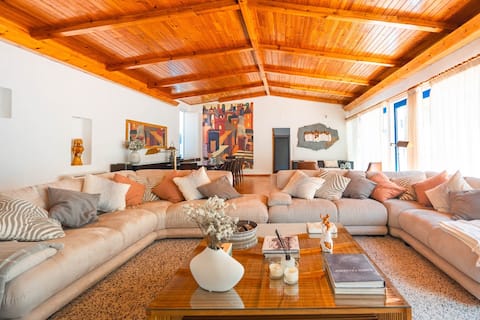
Family Paradise: Exquisite Retreat for Holidays
Entire Place • 6 bedrooms

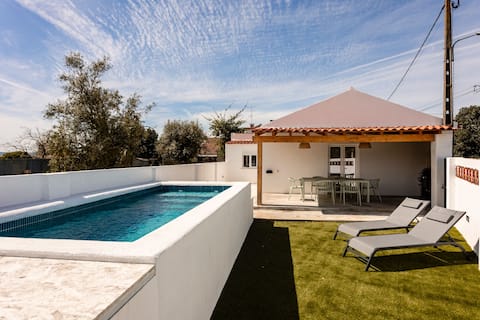
Castelo de Bode with pool and charm
Entire Place • 4 bedrooms

Exclusive Farm
Entire Place • 9 bedrooms

Villa V3 - Casa do Moinho (Abrantes)
Entire Place • 3 bedrooms

House with 5 bedrooms
Entire Place • 5 bedrooms
Country Pool House 27
Entire Place • 2 bedrooms
Note: Performance varies based on location, size, amenities, seasonality, and management quality. Data reflects the past 12 months.
Top Performing Airbnb Hosts in Abrantes (2026)
Learn from the best! This table showcases top-performing Airbnb hosts in Abrantes based on the number of properties managed and estimated total revenue over the past year. Analyze their scale and performance metrics.
| Host Name | Properties | Grossing Revenue | Stay Reviews | Avg Rating |
|---|---|---|---|---|
| Maria | 1 | $79,168 | 8 | 4.75/5.0 |
| António | 3 | $64,615 | 13 | 4.86/5.0 |
| Pedro | 1 | $46,737 | 78 | 4.99/5.0 |
| Jenifer | 4 | $34,013 | 26 | 4.75/5.0 |
| Pedro Alberto | 1 | $30,788 | 19 | 4.79/5.0 |
| Pedro | 3 | $29,265 | 120 | 4.90/5.0 |
| Luis | 1 | $27,307 | 49 | 4.59/5.0 |
| Canduxa | 1 | $24,888 | 20 | 4.80/5.0 |
| Manuel | 1 | $24,069 | 10 | 5.00/5.0 |
| Joelma | 1 | $20,644 | 18 | 4.72/5.0 |
Analyzing the strategies of top hosts, such as their property selection, pricing, and guest communication, can offer valuable lessons for optimizing your own Airbnb operations in Abrantes.
Dive Deeper: Advanced Abrantes STR Market Data (2026)
Ready to unlock more insights? AirROI provides access to advanced metrics and comprehensive Airbnb data for Abrantes. Explore detailed analytics beyond this report to refine your investment strategy, optimize pricing, and maximize your vacation rental profits.
Explore Advanced MetricsAbrantes Short-Term Rental Market Composition (2026): Property & Room Types
Room Type Distribution
Property Type Distribution
Market Composition Insights for Abrantes
- The Abrantes Airbnb market composition is heavily skewed towards Entire Home/Apt listings, which make up 87.8% of the 49 active rentals. This indicates strong guest preference for privacy and space.
- Looking at the property type distribution in Abrantes, House properties are the most common (55.1%), reflecting the local real estate landscape.
- Houses represent a significant 55.1% portion, catering likely to families or larger groups.
- The presence of 8.2% Hotel/Boutique listings indicates integration with traditional hospitality.
Abrantes Airbnb Room Capacity Analysis (2026): Bedroom Distribution
Distribution of Listings by Number of Bedrooms
Room Capacity Insights for Abrantes
- The dominant room capacity in Abrantes is 1 bedroom listings, making up 30.6% of the market. This suggests a strong demand for properties suitable for couples or solo travelers.
- Together, 1 bedroom and 2 bedrooms properties represent 57.1% of the active Airbnb listings in Abrantes, indicating a high concentration in these sizes.
- A significant 30.7% of listings offer 3+ bedrooms, catering to larger groups and families seeking more space in Abrantes.
Abrantes Vacation Rental Guest Capacity Trends (2026)
Distribution of Listings by Guest Capacity
Guest Capacity Insights for Abrantes
- The most common guest capacity trend in Abrantes vacation rentals is listings accommodating 4 guests (32.7%). This suggests the primary traveler segment is likely small families or groups.
- Properties designed for 4 guests and 8+ guests dominate the Abrantes STR market, accounting for 55.1% of listings.
- 42.8% of properties accommodate 6+ guests, serving the market segment for larger families or group travel in Abrantes.
- On average, properties in Abrantes are equipped to host 4.7 guests.
Abrantes Airbnb Booking Patterns (2026): Available vs. Booked Days
Available Days Distribution
Booked Days Distribution
Booking Pattern Insights for Abrantes
- The most common availability pattern in Abrantes falls within the 271-366 days range, representing 67.3% of listings. This suggests many properties have significant open periods on their calendars.
- Approximately 97.9% of listings show high availability (181+ days open annually), indicating potential for increased bookings or specific owner usage patterns.
- For booked days, the 31-90 days range is most frequent in Abrantes (38.8%), reflecting common guest stay durations or potential owner blocking patterns.
- A notable 6.1% of properties secure long booking periods (181+ days booked per year), highlighting successful long-term rental strategies or significant owner usage.
Abrantes Airbnb Minimum Stay Requirements Analysis
Distribution of Listings by Minimum Night Requirement
1 Night
9 listings
18.4% of total
2 Nights
17 listings
34.7% of total
3 Nights
2 listings
4.1% of total
4-6 Nights
2 listings
4.1% of total
30+ Nights
19 listings
38.8% of total
Key Insights
- The most prevalent minimum stay requirement in Abrantes is 30+ Nights, adopted by 38.8% of listings. This highlights the market's preference for longer commitments.
- A significant segment (38.8%) caters to monthly stays (30+ nights) in Abrantes, pointing to opportunities in the extended-stay market.
Recommendations
- Align with the market by considering a 30+ Nights minimum stay, as 38.8% of Abrantes hosts use this setting.
- If feasible, allowing 1-night stays, especially midweek or during low season, could capture last-minute bookings, as only 18.4% currently do.
- A 2-night minimum appears standard (34.7%). Consider this for weekends or peak periods.
- Explore offering discounts for stays of 30+ nights to attract the 38.8% of the market seeking extended stays.
- Adjust minimum nights based on seasonality – potentially shorter during low season and longer during peak demand periods in Abrantes.
Abrantes Airbnb Cancellation Policy Trends Analysis (2026)
Super Strict 30 Days
1 listings
2% of total
Limited
1 listings
2% of total
Flexible
10 listings
20.4% of total
Moderate
8 listings
16.3% of total
Firm
19 listings
38.8% of total
Strict
10 listings
20.4% of total
Cancellation Policy Insights for Abrantes
- The prevailing Airbnb cancellation policy trend in Abrantes is Firm, used by 38.8% of listings.
- A majority (59.2%) of hosts in Abrantes utilize Firm or Strict policies, indicating a market where hosts prioritize booking security.
Recommendations for Hosts
- Consider adopting a Firm policy to align with the 38.8% market standard in Abrantes.
- Regularly review your cancellation policy against competitors and market demand shifts in Abrantes.
Abrantes STR Booking Lead Time Analysis (2026)
Average Booking Lead Time by Month
Booking Lead Time Insights for Abrantes
- The overall average booking lead time for vacation rentals in Abrantes is 57 days.
- Guests book furthest in advance for stays during July (average 97 days), likely coinciding with peak travel demand or local events.
- The shortest booking windows occur for stays in February (average 20 days), indicating more last-minute travel plans during this time.
- Seasonally, Summer (72 days avg.) sees the longest lead times, while Spring (31 days avg.) has the shortest, reflecting typical travel planning cycles.
Recommendations for Hosts
- Use the overall average lead time (57 days) as a baseline for your pricing and availability strategy in Abrantes.
- For July stays, consider implementing length-of-stay discounts or slightly higher rates for bookings made less than 97 days out to capitalize on advance planning.
- Target marketing efforts for the Summer season well in advance (at least 72 days) to capture early planners.
- Monitor your own booking lead times against these Abrantes averages to identify opportunities for dynamic pricing adjustments.
Popular & Essential Airbnb Amenities in Abrantes (2026)
Amenity Prevalence
Amenity Insights for Abrantes
- Essential amenities in Abrantes that guests expect include: TV, Wifi. Lacking these (any) could significantly impact bookings.
- Popular amenities like Kitchen, Hot water, First aid kit are common but not universal. Offering these can provide a competitive edge.
Recommendations for Hosts
- Ensure your listing includes all essential amenities for Abrantes: TV, Wifi.
- Prioritize adding missing essentials: TV, Wifi.
- Consider adding popular differentiators like Kitchen or Hot water to increase appeal.
- Highlight unique or less common amenities you offer (e.g., hot tub, dedicated workspace, EV charger) in your listing description and photos.
- Regularly check competitor amenities in Abrantes to stay competitive.
Abrantes Airbnb Guest Demographics & Profile Analysis (2026)
Guest Profile Summary for Abrantes
- The typical guest profile for Airbnb in Abrantes consists of a mix of domestic (39%) and international guests, with top international origins including Spain, typically belonging to the Post-2000s (Gen Z/Alpha) group (50%), primarily speaking English or Portuguese.
- Domestic travelers account for 39.0% of guests.
- Key international markets include Portugal (39%) and Spain (11%).
- Top languages spoken are English (37.9%) followed by Portuguese (22.3%).
- A significant demographic segment is the Post-2000s (Gen Z/Alpha) group, representing 50% of guests.
Recommendations for Hosts
- Focus marketing internationally, particularly towards travelers from Spain.
- Tailor amenities and listing descriptions to appeal to the dominant Post-2000s (Gen Z/Alpha) demographic (e.g., highlight fast WiFi, smart home features, local guides).
- Highlight unique local experiences or amenities relevant to the primary guest profile.
- Consider seasonal promotions aligned with peak travel times for key origin markets.
Nearby Short-Term Rental Market Comparison
How does the Abrantes Airbnb market stack up against its neighbors? Compare key performance metrics like average monthly revenue, ADR, and occupancy rates in surrounding areas to understand the broader regional STR landscape.
| Market | Active Properties | Monthly Revenue | Daily Rate | Avg. Occupancy |
|---|---|---|---|---|
| Comporta | 111 | $3,719 | $422.92 | 41% |
| Alcácer do Sal | 19 | $3,194 | $386.92 | 32% |
| Ferreira do Alentejo | 13 | $3,006 | $280.31 | 39% |
| Reguengo Grande | 13 | $2,843 | $319.66 | 40% |
| Grândola | 333 | $2,617 | $425.67 | 34% |
| Lisbon | 13,033 | $2,355 | $163.58 | 54% |
| Cascais | 1,613 | $2,314 | $217.29 | 47% |
| Ribamar | 19 | $2,267 | $265.61 | 40% |
| Colares | 13 | $2,156 | $321.52 | 40% |
| Seixal | 214 | $2,117 | $207.58 | 42% |