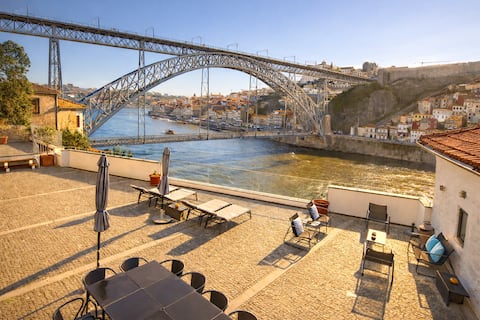
Vila Nova de Gaia Airbnb Market Analysis 2026: Short Term Rental Data & Vacation Rental Statistics in Porto, Portugal
Is Airbnb profitable in Vila Nova de Gaia in 2026? Explore comprehensive Airbnb analytics for Vila Nova de Gaia, Porto, Portugal to uncover income potential. This 2026 STR market report for Vila Nova de Gaia, based on AirROI data from February 2025 to January 2026, reveals key trends in the bustling market of 1,164 active listings.
Whether you're considering an Airbnb investment in Vila Nova de Gaia, optimizing your existing vacation rental, or exploring rental arbitrage opportunities, understanding the Vila Nova de Gaia Airbnb data is crucial. Navigating the high regulation landscape is key to maximizing your short term rental income potential. Let's dive into the specifics.
Key Vila Nova de Gaia Airbnb Performance Metrics Overview
Monthly Airbnb Revenue Variations & Income Potential in Vila Nova de Gaia (2026)
Understanding the monthly revenue variations for Airbnb listings in Vila Nova de Gaia is key to maximizing your short term rental income potential. Seasonality significantly impacts earnings. Our analysis, based on data from the past 12 months, shows that the peak revenue month for STRs in Vila Nova de Gaia is typically August, while January often presents the lowest earnings, highlighting opportunities for strategic pricing adjustments during shoulder and low seasons. Explore the typical Airbnb income in Vila Nova de Gaia across different performance tiers:
- Best-in-class properties (Top 10%) achieve $4,548+ monthly, often utilizing dynamic pricing and superior guest experiences.
- Strong performing properties (Top 25%) earn $2,950 or more, indicating effective management and desirable locations/amenities.
- Typical properties (Median) generate around $1,788 per month, representing the average market performance.
- Entry-level properties (Bottom 25%) see earnings around $944, often with potential for optimization.
Average Monthly Airbnb Earnings Trend in Vila Nova de Gaia
Vila Nova de Gaia Airbnb Occupancy Rate Trends (2026)
Maximize your bookings by understanding the Vila Nova de Gaia STR occupancy trends. Seasonal demand shifts significantly influence how often properties are booked. Typically, Augustsees the highest demand (peak season occupancy), while January experiences the lowest (low season). Effective strategies, like adjusting minimum stays or offering promotions, can boost occupancy during slower periods. Here's how different property tiers perform in Vila Nova de Gaia:
- Best-in-class properties (Top 10%) achieve 85%+ occupancy, indicating high desirability and potentially optimized availability.
- Strong performing properties (Top 25%) maintain 73% or higher occupancy, suggesting good market fit and guest satisfaction.
- Typical properties (Median) have an occupancy rate around 54%.
- Entry-level properties (Bottom 25%) average 30% occupancy, potentially facing higher vacancy.
Average Monthly Occupancy Rate Trend in Vila Nova de Gaia
Average Daily Rate (ADR) Airbnb Trends in Vila Nova de Gaia (2026)
Effective short term rental pricing strategy in Vila Nova de Gaia involves understanding monthly ADR fluctuations. The Average Daily Rate (ADR) for Airbnb in Vila Nova de Gaia typically peaks in August and dips lowest during February. Leveraging Airbnb dynamic pricing tools or strategies based on this seasonality can significantly boost revenue. Here's a look at the typical nightly rates achieved:
- Best-in-class properties (Top 10%) command rates of $248+ per night, often due to premium features or locations.
- Strong performing properties (Top 25%) achieve nightly rates of $161 or more.
- Typical properties (Median) charge around $108 per night.
- Entry-level properties (Bottom 25%) earn around $79 per night.
Average Daily Rate (ADR) Trend by Month in Vila Nova de Gaia
Get Live Vila Nova de Gaia Market Intelligence 👇

Explore Real-time Analytics
Airbnb Seasonality Analysis & Trends in Vila Nova de Gaia (2026)
Peak Season (August, July, September)
- Revenue averages $3,438 per month
- Occupancy rates average 65.1%
- Daily rates average $165
Shoulder Season
- Revenue averages $2,303 per month
- Occupancy maintains around 52.1%
- Daily rates hold near $144
Low Season (January, February, November)
- Revenue drops to average $1,270 per month
- Occupancy decreases to average 36.0%
- Daily rates adjust to average $131
Seasonality Insights for Vila Nova de Gaia
- The Airbnb seasonality in Vila Nova de Gaia shows highly seasonal trends requiring careful strategy. While the sections above show seasonal averages, it's also insightful to look at the extremes:
- During the high season, the absolute peak month showcases Vila Nova de Gaia's highest earning potential, with monthly revenues capable of climbing to $3,828, occupancy reaching a high of 69.2%, and ADRs peaking at $166.
- Conversely, the slowest single month of the year, typically falling within the low season, marks the market's lowest point. In this month, revenue might dip to $1,063, occupancy could drop to 26.4%, and ADRs may adjust down to $119.
- Understanding both the seasonal averages and these monthly peaks and troughs in revenue, occupancy, and ADR is crucial for maximizing your Airbnb profit potential in Vila Nova de Gaia.
Seasonal Strategies for Maximizing Profit
- Peak Season: Maximize revenue through premium pricing and potentially longer minimum stays. Ensure high availability.
- Low Season: Offer competitive pricing, special promotions (e.g., extended stay discounts), and flexible cancellation policies. Target off-season travelers like remote workers or budget-conscious guests.
- Shoulder Seasons: Implement dynamic pricing that balances peak and low rates. Target weekend travelers or specific events. Offer slightly more flexible terms than peak season.
- Regularly analyze your own performance against these Vila Nova de Gaia seasonality benchmarks and adjust your pricing and availability strategy accordingly.
Best Areas for Airbnb Investment in Vila Nova de Gaia (2026)
Exploring the top neighborhoods for short-term rentals in Vila Nova de Gaia? This section highlights key areas, outlining why they are attractive for hosts and guests, along with notable local attractions. Consider these locations based on your target guest profile and investment strategy.
| Neighborhood / Area | Why Host Here? (Target Guests & Appeal) | Key Attractions & Landmarks |
|---|---|---|
| Cais de Gaia | Located along the Douro River, offers stunning views of Porto's skyline and is a hub of wine cellars and riverside dining. It's a favorite spot for tourists exploring local wines and scenic river walks. | Wine Cellars, Lapa Church, Douro Riverwalk, Porto Views, Graham's Port Lodge |
| Jardim do Morro | A popular park with a panoramic view over Porto, ideal for visitors wanting to relax and enjoy the scenery. Hosts events and gatherings, attracting tourists and locals alike. | Jardim do Morro, Monastery of Serra do Pilar, Cable Car to Porto, Viewpoints of Porto, Outdoor Concerts |
| Arrábida | Known for the iconic Arrábida Bridge and proximity to shopping centers. This area attracts visitors who want a blend of urban and suburban life, with access to amenities. | Arrábida Bridge, Shopping Cidade do Porto, Nearby parks, Douro River Views, Restaurants and Cafes |
| Mafamude | A residential area that has seen growth in tourism due to its accessibility and proximity to Porto. Offers a more local experience and affordability for both hosts and guests. | Local markets, Access to metro, Residential parks, Authentic restaurants, Cultural sites nearby |
| Gondomar | A quieter, suburban area just across the river, known for its natural beauty and hiking trails. Appeals to guests looking for a peaceful getaway while still close to Porto. | Parks and Gardens, Hiking Trails, Cultural Heritage, Local Crafts, Nature Activities |
| Ferreiros | Known for its scenic riverfront and family-friendly atmosphere, it attracts those looking for cozy accommodation near natural beauty and local culture. | Riverfront Walks, Local Restaurants, Cultural Events, Artisanal Shops, Community Parks |
| Baixa de Gaia | The main commercial district of Vila Nova de Gaia, bustling with shops, cafes, and local life. Perfect for tourists wanting to be in the heart of the action. | Shopping Streets, Restaurants and Cafes, Historic Buildings, Cultural Events, Local Festivals |
| Canidelo | A coastal area near Gaia known for its beaches and leisure activities. This area is popular for tourists wanting to enjoy the outdoors and beach life while being close to Porto. | Canidelo Beach, Surfing Spots, Beachfront Restaurants, Coastal Walks, Water Sports |
Understanding Airbnb License Requirements & STR Laws in Vila Nova de Gaia (2026)
Yes, Vila Nova de Gaia, Porto, Portugal enforces high STR regulations. Obtaining a license and ensuring compliance is almost certainly required according to current 2026 STR laws. Always verify the latest short term rental regulations and Airbnb license requirements directly with local government authorities for Vila Nova de Gaia to ensure full compliance before hosting.
(Source: AirROI data, 2026, based on 89% licensed listings)
Top Performing Airbnb Properties in Vila Nova de Gaia (2026)
Benchmark your potential! Explore examples of top-performing Airbnb properties in Vila Nova de Gaiabased on Trailing Twelve Month (TTM) revenue. Analyze their characteristics, revenue, occupancy rate, and ADR to understand what drives success in this market.
BRIDGE iT Suites & Views
Entire Place • 7 bedrooms
Casa Vista Douro
Entire Place • 4 bedrooms
6 Fervença Boutique Palace Flats by HostWise
Entire Place • 7 bedrooms

Douro River Design House 'House of Cubes'
Entire Place • 4 bedrooms

Guest Ready - Riverview Douro Terrace
Entire Place • 2 bedrooms

The Ocean Experience Porto
Entire Place • 5 bedrooms
Note: Performance varies based on location, size, amenities, seasonality, and management quality. Data reflects the past 12 months.
Top Performing Airbnb Hosts in Vila Nova de Gaia (2026)
Learn from the best! This table showcases top-performing Airbnb hosts in Vila Nova de Gaia based on the number of properties managed and estimated total revenue over the past year. Analyze their scale and performance metrics.
| Host Name | Properties | Grossing Revenue | Stay Reviews | Avg Rating |
|---|---|---|---|---|
| HostWise | 67 | $1,928,617 | 2298 | 4.54/5.0 |
| Sónia | 21 | $694,133 | 1546 | 4.89/5.0 |
| Porto City Hosts | 11 | $414,451 | 1549 | 4.79/5.0 |
| GuestReady | 14 | $324,213 | 361 | 4.32/5.0 |
| Ocasião Harmonia | 6 | $312,010 | 101 | 4.90/5.0 |
| BnBird Homes Lda | 13 | $289,245 | 563 | 4.49/5.0 |
| Hildebrando | 4 | $269,804 | 505 | 4.72/5.0 |
| Patrícia | 5 | $246,890 | 791 | 4.90/5.0 |
| Paulo | 1 | $241,769 | 240 | 4.99/5.0 |
| Daniel | 8 | $236,120 | 792 | 4.84/5.0 |
Analyzing the strategies of top hosts, such as their property selection, pricing, and guest communication, can offer valuable lessons for optimizing your own Airbnb operations in Vila Nova de Gaia.
Dive Deeper: Advanced Vila Nova de Gaia STR Market Data (2026)
Ready to unlock more insights? AirROI provides access to advanced metrics and comprehensive Airbnb data for Vila Nova de Gaia. Explore detailed analytics beyond this report to refine your investment strategy, optimize pricing, and maximize your vacation rental profits.
Explore Advanced MetricsVila Nova de Gaia Short-Term Rental Market Composition (2026): Property & Room Types
Room Type Distribution
Property Type Distribution
Market Composition Insights for Vila Nova de Gaia
- The Vila Nova de Gaia Airbnb market composition is heavily skewed towards Entire Home/Apt listings, which make up 88% of the 1,164 active rentals. This indicates strong guest preference for privacy and space.
- Looking at the property type distribution in Vila Nova de Gaia, Apartment/Condo properties are the most common (67.5%), reflecting the local real estate landscape.
- Houses represent a significant 26.1% portion, catering likely to families or larger groups.
- Smaller segments like hotel/boutique, outdoor/unique, others, unique stays (combined 6.4%) offer potential for unique stay experiences.
Vila Nova de Gaia Airbnb Room Capacity Analysis (2026): Bedroom Distribution
Distribution of Listings by Number of Bedrooms
Room Capacity Insights for Vila Nova de Gaia
- The dominant room capacity in Vila Nova de Gaia is 1 bedroom listings, making up 37.1% of the market. This suggests a strong demand for properties suitable for couples or solo travelers.
- Together, 1 bedroom and 2 bedrooms properties represent 66.3% of the active Airbnb listings in Vila Nova de Gaia, indicating a high concentration in these sizes.
Vila Nova de Gaia Vacation Rental Guest Capacity Trends (2026)
Distribution of Listings by Guest Capacity
Guest Capacity Insights for Vila Nova de Gaia
- The most common guest capacity trend in Vila Nova de Gaia vacation rentals is listings accommodating 4 guests (28.9%). This suggests the primary traveler segment is likely small families or groups.
- Properties designed for 4 guests and 2 guests dominate the Vila Nova de Gaia STR market, accounting for 49.9% of listings.
- 26.2% of properties accommodate 6+ guests, serving the market segment for larger families or group travel in Vila Nova de Gaia.
- On average, properties in Vila Nova de Gaia are equipped to host 3.9 guests.
Vila Nova de Gaia Airbnb Booking Patterns (2026): Available vs. Booked Days
Available Days Distribution
Booked Days Distribution
Booking Pattern Insights for Vila Nova de Gaia
- The most common availability pattern in Vila Nova de Gaia falls within the 181-270 days range, representing 33.4% of listings. This suggests many properties have significant open periods on their calendars.
- Approximately 63.4% of listings show high availability (181+ days open annually), indicating potential for increased bookings or specific owner usage patterns.
- For booked days, the 91-180 days range is most frequent in Vila Nova de Gaia (32.6%), reflecting common guest stay durations or potential owner blocking patterns.
- A notable 38.9% of properties secure long booking periods (181+ days booked per year), highlighting successful long-term rental strategies or significant owner usage.
Vila Nova de Gaia Airbnb Minimum Stay Requirements Analysis
Distribution of Listings by Minimum Night Requirement
1 Night
214 listings
18.4% of total
2 Nights
246 listings
21.1% of total
3 Nights
82 listings
7% of total
4-6 Nights
81 listings
7% of total
7-29 Nights
18 listings
1.5% of total
30+ Nights
523 listings
44.9% of total
Key Insights
- The most prevalent minimum stay requirement in Vila Nova de Gaia is 30+ Nights, adopted by 44.9% of listings. This highlights the market's preference for longer commitments.
- A significant segment (44.9%) caters to monthly stays (30+ nights) in Vila Nova de Gaia, pointing to opportunities in the extended-stay market.
Recommendations
- Align with the market by considering a 30+ Nights minimum stay, as 44.9% of Vila Nova de Gaia hosts use this setting.
- If feasible, allowing 1-night stays, especially midweek or during low season, could capture last-minute bookings, as only 18.4% currently do.
- Explore offering discounts for stays of 30+ nights to attract the 44.9% of the market seeking extended stays.
- Adjust minimum nights based on seasonality – potentially shorter during low season and longer during peak demand periods in Vila Nova de Gaia.
Vila Nova de Gaia Airbnb Cancellation Policy Trends Analysis (2026)
Super Strict 60 Days
2 listings
0.2% of total
Super Strict 30 Days
16 listings
1.4% of total
Limited
59 listings
5.1% of total
Flexible
144 listings
12.4% of total
Moderate
432 listings
37.2% of total
Firm
347 listings
29.9% of total
Strict
162 listings
13.9% of total
Cancellation Policy Insights for Vila Nova de Gaia
- The prevailing Airbnb cancellation policy trend in Vila Nova de Gaia is Moderate, used by 37.2% of listings.
- There's a relatively balanced mix between guest-friendly (49.6%) and stricter (43.8%) policies, offering choices for different guest needs.
Recommendations for Hosts
- Consider adopting a Moderate policy to align with the 37.2% market standard in Vila Nova de Gaia.
- Using a Strict policy might deter some guests, as only 13.9% of listings use it. Evaluate if potential revenue protection outweighs possible lower booking rates.
- Regularly review your cancellation policy against competitors and market demand shifts in Vila Nova de Gaia.
Vila Nova de Gaia STR Booking Lead Time Analysis (2026)
Average Booking Lead Time by Month
Booking Lead Time Insights for Vila Nova de Gaia
- The overall average booking lead time for vacation rentals in Vila Nova de Gaia is 55 days.
- Guests book furthest in advance for stays during August (average 80 days), likely coinciding with peak travel demand or local events.
- The shortest booking windows occur for stays in February (average 32 days), indicating more last-minute travel plans during this time.
- Seasonally, Summer (71 days avg.) sees the longest lead times, while Winter (41 days avg.) has the shortest, reflecting typical travel planning cycles.
Recommendations for Hosts
- Use the overall average lead time (55 days) as a baseline for your pricing and availability strategy in Vila Nova de Gaia.
- For August stays, consider implementing length-of-stay discounts or slightly higher rates for bookings made less than 80 days out to capitalize on advance planning.
- Target marketing efforts for the Summer season well in advance (at least 71 days) to capture early planners.
- Monitor your own booking lead times against these Vila Nova de Gaia averages to identify opportunities for dynamic pricing adjustments.
Popular & Essential Airbnb Amenities in Vila Nova de Gaia (2026)
Amenity Prevalence
Amenity Insights for Vila Nova de Gaia
- Essential amenities in Vila Nova de Gaia that guests expect include: Wifi. Lacking these (this) could significantly impact bookings.
- Popular amenities like TV, Kitchen, Hot water are common but not universal. Offering these can provide a competitive edge.
Recommendations for Hosts
- Ensure your listing includes all essential amenities for Vila Nova de Gaia: Wifi.
- Prioritize adding missing essentials: Wifi.
- Consider adding popular differentiators like TV or Kitchen to increase appeal.
- Highlight unique or less common amenities you offer (e.g., hot tub, dedicated workspace, EV charger) in your listing description and photos.
- Regularly check competitor amenities in Vila Nova de Gaia to stay competitive.
Vila Nova de Gaia Airbnb Guest Demographics & Profile Analysis (2026)
Guest Profile Summary for Vila Nova de Gaia
- The typical guest profile for Airbnb in Vila Nova de Gaia consists of predominantly international visitors (94%), with top international origins including United States, typically belonging to the Post-2000s (Gen Z/Alpha) group (50%), primarily speaking English or French.
- Domestic travelers account for 6.2% of guests.
- Key international markets include France (18.3%) and United States (14.5%).
- Top languages spoken are English (39.1%) followed by French (13.8%).
- A significant demographic segment is the Post-2000s (Gen Z/Alpha) group, representing 50% of guests.
Recommendations for Hosts
- Focus marketing internationally, particularly towards travelers from United States.
- Tailor amenities and listing descriptions to appeal to the dominant Post-2000s (Gen Z/Alpha) demographic (e.g., highlight fast WiFi, smart home features, local guides).
- Highlight unique local experiences or amenities relevant to the primary guest profile.
- Consider seasonal promotions aligned with peak travel times for key origin markets.
Nearby Short-Term Rental Market Comparison
How does the Vila Nova de Gaia Airbnb market stack up against its neighbors? Compare key performance metrics like average monthly revenue, ADR, and occupancy rates in surrounding areas to understand the broader regional STR landscape.
| Market | Active Properties | Monthly Revenue | Daily Rate | Avg. Occupancy |
|---|---|---|---|---|
| Penhalonga e Paços de Gaiolo | 23 | $4,304 | $357.04 | 40% |
| Sande e São Lourenço do Douro | 19 | $3,009 | $319.97 | 37% |
| Armamar | 66 | $2,578 | $266.43 | 36% |
| Alpendorada, Várzea e Torrão | 19 | $2,503 | $264.40 | 35% |
| Vila Boa de Quires e Maureles | 10 | $2,316 | $202.63 | 48% |
| Alijó | 69 | $2,072 | $250.65 | 30% |
| Cinfães | 16 | $2,059 | $253.86 | 28% |
| Portomarín | 12 | $2,006 | $181.90 | 49% |
| Barreiros | 10 | $1,928 | $192.32 | 39% |
| Mesão Frio | 58 | $1,896 | $182.28 | 42% |