Moreira Airbnb Market Analysis 2026: Short Term Rental Data & Vacation Rental Statistics in Porto, Portugal
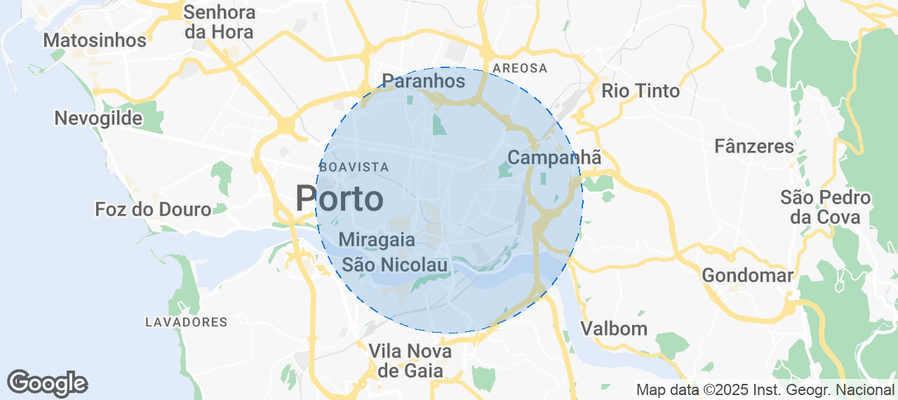
Is Airbnb profitable in Moreira in 2026? Explore comprehensive Airbnb analytics for Moreira, Porto, Portugal to uncover income potential. This 2026 STR market report for Moreira, based on AirROI data from February 2025 to January 2026, reveals key trends in the niche market of 21 active listings.
Whether you're considering an Airbnb investment in Moreira, optimizing your existing vacation rental, or exploring rental arbitrage opportunities, understanding the Moreira Airbnb data is crucial. Navigating the high regulation landscape is key to maximizing your short term rental income potential. Let's dive into the specifics.
Key Moreira Airbnb Performance Metrics Overview
Monthly Airbnb Revenue Variations & Income Potential in Moreira (2026)
Understanding the monthly revenue variations for Airbnb listings in Moreira is key to maximizing your short term rental income potential. Seasonality significantly impacts earnings. Our analysis, based on data from the past 12 months, shows that the peak revenue month for STRs in Moreira is typically August, while January often presents the lowest earnings, highlighting opportunities for strategic pricing adjustments during shoulder and low seasons. Explore the typical Airbnb income in Moreira across different performance tiers:
- Best-in-class properties (Top 10%) achieve $3,568+ monthly, often utilizing dynamic pricing and superior guest experiences.
- Strong performing properties (Top 25%) earn $2,289 or more, indicating effective management and desirable locations/amenities.
- Typical properties (Median) generate around $1,433 per month, representing the average market performance.
- Entry-level properties (Bottom 25%) see earnings around $686, often with potential for optimization.
Average Monthly Airbnb Earnings Trend in Moreira
Moreira Airbnb Occupancy Rate Trends (2026)
Maximize your bookings by understanding the Moreira STR occupancy trends. Seasonal demand shifts significantly influence how often properties are booked. Typically, Augustsees the highest demand (peak season occupancy), while January experiences the lowest (low season). Effective strategies, like adjusting minimum stays or offering promotions, can boost occupancy during slower periods. Here's how different property tiers perform in Moreira:
- Best-in-class properties (Top 10%) achieve 79%+ occupancy, indicating high desirability and potentially optimized availability.
- Strong performing properties (Top 25%) maintain 66% or higher occupancy, suggesting good market fit and guest satisfaction.
- Typical properties (Median) have an occupancy rate around 45%.
- Entry-level properties (Bottom 25%) average 24% occupancy, potentially facing higher vacancy.
Average Monthly Occupancy Rate Trend in Moreira
Average Daily Rate (ADR) Airbnb Trends in Moreira (2026)
Effective short term rental pricing strategy in Moreira involves understanding monthly ADR fluctuations. The Average Daily Rate (ADR) for Airbnb in Moreira typically peaks in September and dips lowest during January. Leveraging Airbnb dynamic pricing tools or strategies based on this seasonality can significantly boost revenue. Here's a look at the typical nightly rates achieved:
- Best-in-class properties (Top 10%) command rates of $207+ per night, often due to premium features or locations.
- Strong performing properties (Top 25%) achieve nightly rates of $142 or more.
- Typical properties (Median) charge around $98 per night.
- Entry-level properties (Bottom 25%) earn around $84 per night.
Average Daily Rate (ADR) Trend by Month in Moreira
Get Live Moreira Market Intelligence 👇
Explore Real-time Analytics
Airbnb Seasonality Analysis & Trends in Moreira (2026)
Peak Season (August, September, July)
- Revenue averages $2,639 per month
- Occupancy rates average 54.9%
- Daily rates average $140
Shoulder Season
- Revenue averages $1,638 per month
- Occupancy maintains around 48.2%
- Daily rates hold near $114
Low Season (January, February, December)
- Revenue drops to average $911 per month
- Occupancy decreases to average 32.5%
- Daily rates adjust to average $104
Seasonality Insights for Moreira
- The Airbnb seasonality in Moreira shows highly seasonal trends requiring careful strategy. While the sections above show seasonal averages, it's also insightful to look at the extremes:
- During the high season, the absolute peak month showcases Moreira's highest earning potential, with monthly revenues capable of climbing to $2,890, occupancy reaching a high of 57.5%, and ADRs peaking at $148.
- Conversely, the slowest single month of the year, typically falling within the low season, marks the market's lowest point. In this month, revenue might dip to $764, occupancy could drop to 28.5%, and ADRs may adjust down to $102.
- Understanding both the seasonal averages and these monthly peaks and troughs in revenue, occupancy, and ADR is crucial for maximizing your Airbnb profit potential in Moreira.
Seasonal Strategies for Maximizing Profit
- Peak Season: Maximize revenue through premium pricing and potentially longer minimum stays. Ensure high availability.
- Low Season: Offer competitive pricing, special promotions (e.g., extended stay discounts), and flexible cancellation policies. Target off-season travelers like remote workers or budget-conscious guests.
- Shoulder Seasons: Implement dynamic pricing that balances peak and low rates. Target weekend travelers or specific events. Offer slightly more flexible terms than peak season.
- Regularly analyze your own performance against these Moreira seasonality benchmarks and adjust your pricing and availability strategy accordingly.
Best Areas for Airbnb Investment in Moreira (2026)
Exploring the top neighborhoods for short-term rentals in Moreira? This section highlights key areas, outlining why they are attractive for hosts and guests, along with notable local attractions. Consider these locations based on your target guest profile and investment strategy.
| Neighborhood / Area | Why Host Here? (Target Guests & Appeal) | Key Attractions & Landmarks |
|---|---|---|
| Centro Histórico | The historic center of Porto is a UNESCO World Heritage site filled with charming streets, stunning architecture, and rich history. It attracts many tourists who want to explore the culture of the city. | Ribeira, Clérigos Tower, Palácio da Bolsa, São Bento Train Station, Livraria Lello |
| Baixa | Baixa is a trendy area known for its shops, cafes, and lively atmosphere. It is often bustling with locals and tourists, making it a prime area for Airbnb hosting. | Avenida dos Aliados, São João National Theatre, Bolhão Market, Rua de Santa Catarina |
| Foz do Douro | This coastal neighborhood merges beach life with a vibrant local scene. It is popular among those looking for a seaside getaway, offering opportunities for relaxation and outdoor activities. | Praia da Luz, Jardim do Passeio Alegre, Foz Market |
| Cedofeita | An artistic and bohemian district, Cedofeita hosts many art galleries and cultural establishments. Its youthful population makes it attractive for short-term rental. | Serralves Foundation, Miguel Bombarda Street, Café au Lait |
| Bolhão | Known for its traditional market, Bolhão is a lively district offering authentic Porto experiences, making it appealing to both tourists and locals. | Mercado do Bolhão, Rua de Fernandes Tomás, Bolhão Metro Station |
| Carro . Terrapleno | A burgeoning area with upcoming attractions, making it an ideal investment for future growth in Airbnb hosting as more tourists explore the outskirts of Porto. | Lazer do Parque da Cidade, Cultural Center of Belém |
| Sao Mamede | A tranquil neighborhood that offers a more local experience while still being close to the city center, appealing to families and longer stays. | Freguesia de São Mamede, local parks and gardens |
| Praia de Matosinhos | Famous for its beautiful beach and seafood restaurants, Matosinhos attracts both beachgoers and food lovers, making it a lucrative area for vacation rentals. | Praia de Matosinhos beach, Seafood restaurants, Porto Fish Market |
Understanding Airbnb License Requirements & STR Laws in Moreira (2026)
Yes, Moreira, Porto, Portugal enforces high STR regulations. Obtaining a license and ensuring compliance is almost certainly required according to current 2026 STR laws. Always verify the latest short term rental regulations and Airbnb license requirements directly with local government authorities for Moreira to ensure full compliance before hosting.
(Source: AirROI data, 2026, based on 95% licensed listings)
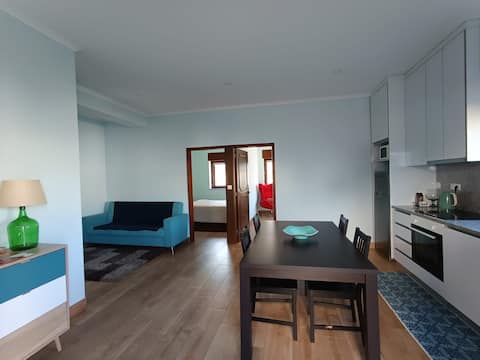
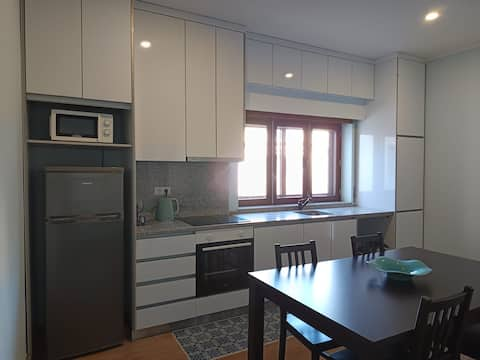
Top Performing Airbnb Properties in Moreira (2026)
Benchmark your potential! Explore examples of top-performing Airbnb properties in Moreirabased on Trailing Twelve Month (TTM) revenue. Analyze their characteristics, revenue, occupancy rate, and ADR to understand what drives success in this market.
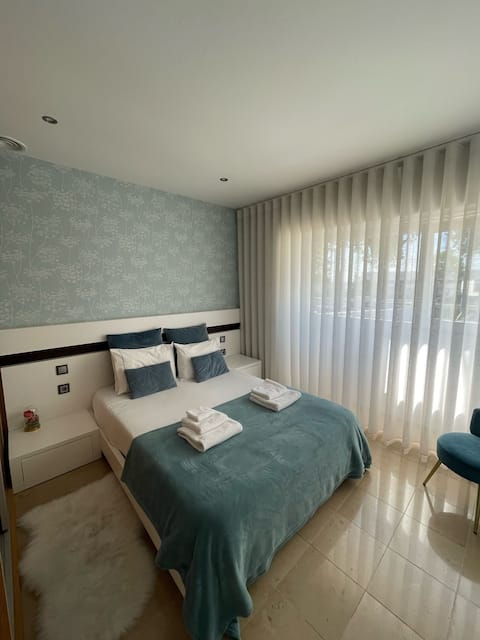
Two-Bedroom Apartment, Porto Airport
Entire Place • 2 bedrooms
Airport House - T2
Entire Place • 2 bedrooms

Two-Bedroom Apartment, Porto Airport
Entire Place • 2 bedrooms
Airport House - T1
Entire Place • 1 bedroom
1 bedroom apartment, Porto Airport
Entire Place • 1 bedroom
Apartamento T2, Porto Airport
Entire Place • 2 bedrooms
Note: Performance varies based on location, size, amenities, seasonality, and management quality. Data reflects the past 12 months.
Top Performing Airbnb Hosts in Moreira (2026)
Learn from the best! This table showcases top-performing Airbnb hosts in Moreira based on the number of properties managed and estimated total revenue over the past year. Analyze their scale and performance metrics.
| Host Name | Properties | Grossing Revenue | Stay Reviews | Avg Rating |
|---|---|---|---|---|
| Cristina | 9 | $201,298 | 197 | 4.84/5.0 |
| Leonor Andrês | 2 | $67,628 | 221 | 4.92/5.0 |
| Maria Rosa Pereira | 3 | $48,082 | 1230 | 4.91/5.0 |
| Ana | 4 | $21,817 | 33 | 5.00/5.0 |
| Célia Pedro | 1 | $15,621 | 677 | 4.89/5.0 |
| Vítor | 1 | $9,304 | 204 | 4.81/5.0 |
| Filipe Alexandre | 1 | $5,563 | 127 | 4.82/5.0 |
Analyzing the strategies of top hosts, such as their property selection, pricing, and guest communication, can offer valuable lessons for optimizing your own Airbnb operations in Moreira.
Dive Deeper: Advanced Moreira STR Market Data (2026)
Ready to unlock more insights? AirROI provides access to advanced metrics and comprehensive Airbnb data for Moreira. Explore detailed analytics beyond this report to refine your investment strategy, optimize pricing, and maximize your vacation rental profits.
Explore Advanced MetricsMoreira Short-Term Rental Market Composition (2026): Property & Room Types
Room Type Distribution
Property Type Distribution
Market Composition Insights for Moreira
- The Moreira Airbnb market composition is heavily skewed towards Entire Home/Apt listings, which make up 52.4% of the 21 active rentals. This indicates strong guest preference for privacy and space.
- However, a notable 47.6% share for Private Rooms suggests opportunities for budget-conscious travelers or hosts renting out spare rooms.
- Looking at the property type distribution in Moreira, Apartment/Condo properties are the most common (47.6%), reflecting the local real estate landscape.
- Houses represent a significant 33.3% portion, catering likely to families or larger groups.
Moreira Airbnb Room Capacity Analysis (2026): Bedroom Distribution
Distribution of Listings by Number of Bedrooms
Room Capacity Insights for Moreira
- The dominant room capacity in Moreira is 2 bedrooms listings, making up 38.1% of the market. This suggests a strong demand for properties suitable for couples or solo travelers.
- Together, 2 bedrooms and 1 bedroom properties represent 66.7% of the active Airbnb listings in Moreira, indicating a high concentration in these sizes.
Moreira Vacation Rental Guest Capacity Trends (2026)
Distribution of Listings by Guest Capacity
Guest Capacity Insights for Moreira
- The most common guest capacity trend in Moreira vacation rentals is listings accommodating 2 guests (23.8%). This suggests the primary traveler segment is likely couples or solo travelers.
- Properties designed for 2 guests and 4 guests dominate the Moreira STR market, accounting for 38.1% of listings.
- On average, properties in Moreira are equipped to host 2.3 guests.
Moreira Airbnb Booking Patterns (2026): Available vs. Booked Days
Available Days Distribution
Booked Days Distribution
Booking Pattern Insights for Moreira
- The most common availability pattern in Moreira falls within the 181-270 days range, representing 38.1% of listings. This suggests many properties have significant open periods on their calendars.
- Approximately 66.7% of listings show high availability (181+ days open annually), indicating potential for increased bookings or specific owner usage patterns.
- For booked days, the 91-180 days range is most frequent in Moreira (38.1%), reflecting common guest stay durations or potential owner blocking patterns.
- A notable 33.3% of properties secure long booking periods (181+ days booked per year), highlighting successful long-term rental strategies or significant owner usage.
Moreira Airbnb Minimum Stay Requirements Analysis
Distribution of Listings by Minimum Night Requirement
1 Night
17 listings
81% of total
2 Nights
4 listings
19% of total
Key Insights
- The most prevalent minimum stay requirement in Moreira is 1 Night, adopted by 81% of listings. This highlights the market's preference for shorter, flexible bookings.
- A strong majority (100.0%) of the Moreira Airbnb data shows acceptance of very short stays (1-2 nights), indicating a dynamic, high-turnover market.
Recommendations
- Align with the market by considering a 1 Night minimum stay, as 81% of Moreira hosts use this setting.
- Adjust minimum nights based on seasonality – potentially shorter during low season and longer during peak demand periods in Moreira.
Moreira Airbnb Cancellation Policy Trends Analysis (2026)
Flexible
2 listings
9.5% of total
Moderate
10 listings
47.6% of total
Firm
2 listings
9.5% of total
Strict
7 listings
33.3% of total
Cancellation Policy Insights for Moreira
- The prevailing Airbnb cancellation policy trend in Moreira is Moderate, used by 47.6% of listings.
- There's a relatively balanced mix between guest-friendly (57.1%) and stricter (42.8%) policies, offering choices for different guest needs.
Recommendations for Hosts
- Consider adopting a Moderate policy to align with the 47.6% market standard in Moreira.
- With 33.3% using Strict terms, this is a viable option in Moreira, particularly for high-value properties or during peak demand periods.
- Regularly review your cancellation policy against competitors and market demand shifts in Moreira.
Moreira STR Booking Lead Time Analysis (2026)
Average Booking Lead Time by Month
Booking Lead Time Insights for Moreira
- The overall average booking lead time for vacation rentals in Moreira is 51 days.
- Guests book furthest in advance for stays during August (average 80 days), likely coinciding with peak travel demand or local events.
- The shortest booking windows occur for stays in January (average 22 days), indicating more last-minute travel plans during this time.
- Seasonally, Summer (61 days avg.) sees the longest lead times, while Winter (41 days avg.) has the shortest, reflecting typical travel planning cycles.
Recommendations for Hosts
- Use the overall average lead time (51 days) as a baseline for your pricing and availability strategy in Moreira.
- For August stays, consider implementing length-of-stay discounts or slightly higher rates for bookings made less than 80 days out to capitalize on advance planning.
- Target marketing efforts for the Summer season well in advance (at least 61 days) to capture early planners.
- Monitor your own booking lead times against these Moreira averages to identify opportunities for dynamic pricing adjustments.
Popular & Essential Airbnb Amenities in Moreira (2026)
Amenity Prevalence
Amenity Insights for Moreira
- Essential amenities in Moreira that guests expect include: Essentials, First aid kit, Hangers, Wifi. Lacking these (any) could significantly impact bookings.
- Popular amenities like TV, Fire extinguisher, Hair dryer are common but not universal. Offering these can provide a competitive edge.
Recommendations for Hosts
- Ensure your listing includes all essential amenities for Moreira: Essentials, First aid kit, Hangers, Wifi.
- Consider adding popular differentiators like TV or Fire extinguisher to increase appeal.
- Highlight unique or less common amenities you offer (e.g., hot tub, dedicated workspace, EV charger) in your listing description and photos.
- Regularly check competitor amenities in Moreira to stay competitive.
Moreira Airbnb Guest Demographics & Profile Analysis (2026)
Guest Profile Summary for Moreira
- The typical guest profile for Airbnb in Moreira consists of predominantly international visitors (95%), with top international origins including United States, typically belonging to the Post-2000s (Gen Z/Alpha) group (50%), primarily speaking English or French.
- Domestic travelers account for 4.9% of guests.
- Key international markets include France (22.7%) and United States (17.8%).
- Top languages spoken are English (40.7%) followed by French (15.2%).
- A significant demographic segment is the Post-2000s (Gen Z/Alpha) group, representing 50% of guests.
Recommendations for Hosts
- Focus marketing internationally, particularly towards travelers from United States.
- Tailor amenities and listing descriptions to appeal to the dominant Post-2000s (Gen Z/Alpha) demographic (e.g., highlight fast WiFi, smart home features, local guides).
- Highlight unique local experiences or amenities relevant to the primary guest profile.
- Consider seasonal promotions aligned with peak travel times for key origin markets.
Nearby Short-Term Rental Market Comparison
How does the Moreira Airbnb market stack up against its neighbors? Compare key performance metrics like average monthly revenue, ADR, and occupancy rates in surrounding areas to understand the broader regional STR landscape.
| Market | Active Properties | Monthly Revenue | Daily Rate | Avg. Occupancy |
|---|---|---|---|---|
| Penhalonga e Paços de Gaiolo | 23 | $4,304 | $357.04 | 40% |
| Sande e São Lourenço do Douro | 19 | $3,009 | $319.97 | 37% |
| Armamar | 66 | $2,578 | $266.43 | 36% |
| Alpendorada, Várzea e Torrão | 19 | $2,503 | $264.40 | 35% |
| Vila Boa de Quires e Maureles | 10 | $2,316 | $202.63 | 48% |
| Alijó | 69 | $2,072 | $250.65 | 30% |
| Cinfães | 16 | $2,059 | $253.86 | 28% |
| Portomarín | 12 | $2,006 | $181.90 | 49% |
| Barreiros | 10 | $1,928 | $192.32 | 39% |
| Mesão Frio | 58 | $1,896 | $182.28 | 42% |