Matosinhos Airbnb Market Analysis 2026: Short Term Rental Data & Vacation Rental Statistics in Porto, Portugal
Is Airbnb profitable in Matosinhos in 2026? Explore comprehensive Airbnb analytics for Matosinhos, Porto, Portugal to uncover income potential. This 2026 STR market report for Matosinhos, based on AirROI data from February 2025 to January 2026, reveals key trends in the market of 426 active listings.
Whether you're considering an Airbnb investment in Matosinhos, optimizing your existing vacation rental, or exploring rental arbitrage opportunities, understanding the Matosinhos Airbnb data is crucial. Navigating the high regulation landscape is key to maximizing your short term rental income potential. Let's dive into the specifics.
Key Matosinhos Airbnb Performance Metrics Overview
Monthly Airbnb Revenue Variations & Income Potential in Matosinhos (2026)
Understanding the monthly revenue variations for Airbnb listings in Matosinhos is key to maximizing your short term rental income potential. Seasonality significantly impacts earnings. Our analysis, based on data from the past 12 months, shows that the peak revenue month for STRs in Matosinhos is typically August, while January often presents the lowest earnings, highlighting opportunities for strategic pricing adjustments during shoulder and low seasons. Explore the typical Airbnb income in Matosinhos across different performance tiers:
- Best-in-class properties (Top 10%) achieve $3,951+ monthly, often utilizing dynamic pricing and superior guest experiences.
- Strong performing properties (Top 25%) earn $2,614 or more, indicating effective management and desirable locations/amenities.
- Typical properties (Median) generate around $1,594 per month, representing the average market performance.
- Entry-level properties (Bottom 25%) see earnings around $783, often with potential for optimization.
Average Monthly Airbnb Earnings Trend in Matosinhos
Matosinhos Airbnb Occupancy Rate Trends (2026)
Maximize your bookings by understanding the Matosinhos STR occupancy trends. Seasonal demand shifts significantly influence how often properties are booked. Typically, Augustsees the highest demand (peak season occupancy), while January experiences the lowest (low season). Effective strategies, like adjusting minimum stays or offering promotions, can boost occupancy during slower periods. Here's how different property tiers perform in Matosinhos:
- Best-in-class properties (Top 10%) achieve 83%+ occupancy, indicating high desirability and potentially optimized availability.
- Strong performing properties (Top 25%) maintain 68% or higher occupancy, suggesting good market fit and guest satisfaction.
- Typical properties (Median) have an occupancy rate around 49%.
- Entry-level properties (Bottom 25%) average 27% occupancy, potentially facing higher vacancy.
Average Monthly Occupancy Rate Trend in Matosinhos
Average Daily Rate (ADR) Airbnb Trends in Matosinhos (2026)
Effective short term rental pricing strategy in Matosinhos involves understanding monthly ADR fluctuations. The Average Daily Rate (ADR) for Airbnb in Matosinhos typically peaks in August and dips lowest during February. Leveraging Airbnb dynamic pricing tools or strategies based on this seasonality can significantly boost revenue. Here's a look at the typical nightly rates achieved:
- Best-in-class properties (Top 10%) command rates of $211+ per night, often due to premium features or locations.
- Strong performing properties (Top 25%) achieve nightly rates of $150 or more.
- Typical properties (Median) charge around $103 per night.
- Entry-level properties (Bottom 25%) earn around $72 per night.
Average Daily Rate (ADR) Trend by Month in Matosinhos
Get Live Matosinhos Market Intelligence 👇

Explore Real-time Analytics
Airbnb Seasonality Analysis & Trends in Matosinhos (2026)
Peak Season (August, July, September)
- Revenue averages $3,037 per month
- Occupancy rates average 63.4%
- Daily rates average $139
Shoulder Season
- Revenue averages $1,848 per month
- Occupancy maintains around 47.6%
- Daily rates hold near $121
Low Season (January, February, November)
- Revenue drops to average $1,053 per month
- Occupancy decreases to average 33.6%
- Daily rates adjust to average $111
Seasonality Insights for Matosinhos
- The Airbnb seasonality in Matosinhos shows highly seasonal trends requiring careful strategy. While the sections above show seasonal averages, it's also insightful to look at the extremes:
- During the high season, the absolute peak month showcases Matosinhos's highest earning potential, with monthly revenues capable of climbing to $3,506, occupancy reaching a high of 67.8%, and ADRs peaking at $144.
- Conversely, the slowest single month of the year, typically falling within the low season, marks the market's lowest point. In this month, revenue might dip to $833, occupancy could drop to 25.2%, and ADRs may adjust down to $102.
- Understanding both the seasonal averages and these monthly peaks and troughs in revenue, occupancy, and ADR is crucial for maximizing your Airbnb profit potential in Matosinhos.
Seasonal Strategies for Maximizing Profit
- Peak Season: Maximize revenue through premium pricing and potentially longer minimum stays. Ensure high availability.
- Low Season: Offer competitive pricing, special promotions (e.g., extended stay discounts), and flexible cancellation policies. Target off-season travelers like remote workers or budget-conscious guests.
- Shoulder Seasons: Implement dynamic pricing that balances peak and low rates. Target weekend travelers or specific events. Offer slightly more flexible terms than peak season.
- Regularly analyze your own performance against these Matosinhos seasonality benchmarks and adjust your pricing and availability strategy accordingly.
Best Areas for Airbnb Investment in Matosinhos (2026)
Exploring the top neighborhoods for short-term rentals in Matosinhos? This section highlights key areas, outlining why they are attractive for hosts and guests, along with notable local attractions. Consider these locations based on your target guest profile and investment strategy.
| Neighborhood / Area | Why Host Here? (Target Guests & Appeal) | Key Attractions & Landmarks |
|---|---|---|
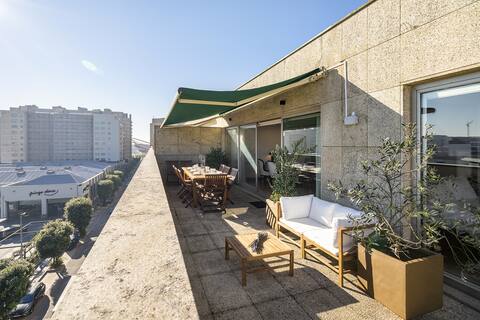
| Praia de Matosinhos | A beautiful beach area known for its sandy shores and excellent seafood restaurants. Attracts both beachgoers and food lovers. | Matosinhos Beach, Seafood restaurants, Surfing spots, Parque da Cidade, Matosinhos Market |
| Centro de Matosinhos | The city center offers a mix of shopping, dining, and cultural experiences. Ideal for travelers who enjoy the urban atmosphere. | Matosinhos Church, Shopping areas, Local cafes, Art galleries, Cultural events |
| Leça da Palmeira | A coastal suburb with stunning ocean views and modern residential areas. Popular with families and travelers seeking a quieter environment. | Leça da Palmeira Beach, Fort of Leça, Parque dos Pescadores, Coastal walking paths, Local bakeries |
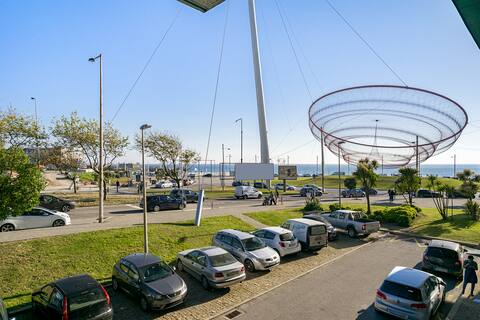
| Terminal de Cruzeiros | The cruise terminal area is bustling with activity, perfect for tourists arriving by sea. | Cruise ships, Beaches, Waterfront restaurants, Scenic views, Marina |
| Cais da Mó | A charming area known for its riverside views and proximity to the sea, offering a relaxed atmosphere for visitors. | Scenic river views, Dining along the river, Walking paths, Local markets |
| Praia da Memória | A scenic beach perfect for sunbathing and water sports, attracting local beach lovers and tourists alike. | Memória Beach, Water sports centers, Local attractions, Relaxing parks |
| Zona Ribeirinha | An attractive riverside area with charming views, ideal for evening strolls and dining. | Riverside restaurants, Walking areas, Parks, Cultural performances |
| Largo de São João | A vibrant square in Matosinhos known for local events and community gatherings, providing a glimpse into the local culture. | Cafes, Local shops, Community events, Festivals |
Understanding Airbnb License Requirements & STR Laws in Matosinhos (2026)
Yes, Matosinhos, Porto, Portugal enforces high STR regulations. Obtaining a license and ensuring compliance is almost certainly required according to current 2026 STR laws. Always verify the latest short term rental regulations and Airbnb license requirements directly with local government authorities for Matosinhos to ensure full compliance before hosting.
(Source: AirROI data, 2026, based on 91% licensed listings)
Top Performing Airbnb Properties in Matosinhos (2026)
Benchmark your potential! Explore examples of top-performing Airbnb properties in Matosinhosbased on Trailing Twelve Month (TTM) revenue. Analyze their characteristics, revenue, occupancy rate, and ADR to understand what drives success in this market.

Lettia - Luxury Villa
Entire Place • 3 bedrooms
Penthouse Luxe: Views, Terrace & Parking
Entire Place • 4 bedrooms
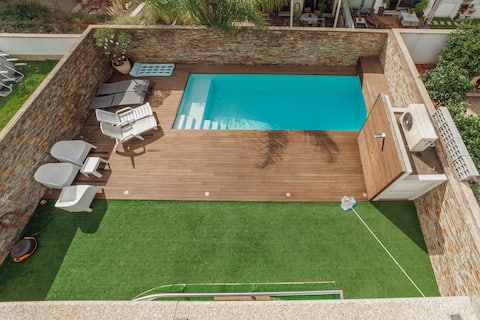
Pool & Cinema Villa by Vacationy
Entire Place • 5 bedrooms
Luxury Living by the Sea: Matosinhos Marvel
Entire Place • 4 bedrooms
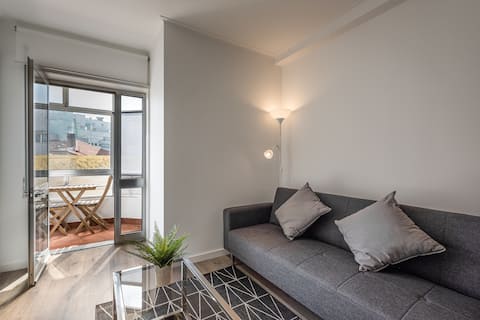
GuestReady Essential - Central Stay in Matosinhos
Entire Place • 1 bedroom
Porto Sea Apartments - Deluxe Sea View
Entire Place • 3 bedrooms
Note: Performance varies based on location, size, amenities, seasonality, and management quality. Data reflects the past 12 months.
Top Performing Airbnb Hosts in Matosinhos (2026)
Learn from the best! This table showcases top-performing Airbnb hosts in Matosinhos based on the number of properties managed and estimated total revenue over the past year. Analyze their scale and performance metrics.
| Host Name | Properties | Grossing Revenue | Stay Reviews | Avg Rating |
|---|---|---|---|---|
| HostWise | 23 | $463,824 | 237 | 4.52/5.0 |
| Feel Porto | 11 | $335,322 | 233 | 4.67/5.0 |
| Sofia | 11 | $206,672 | 987 | 4.82/5.0 |
| Oporto | 10 | $197,430 | 372 | 4.73/5.0 |
| Bozena | 4 | $152,014 | 51 | 4.92/5.0 |
| GestHomes By Alexandra & Pedro | 4 | $140,917 | 369 | 4.87/5.0 |
| Gonçalo | 1 | $128,701 | 35 | 5.00/5.0 |
| Growhome | 7 | $123,412 | 108 | 4.96/5.0 |
| Nuno Pires - EcoHost | 4 | $114,413 | 229 | 4.92/5.0 |
| GuestReady | 4 | $108,674 | 372 | 4.16/5.0 |
Analyzing the strategies of top hosts, such as their property selection, pricing, and guest communication, can offer valuable lessons for optimizing your own Airbnb operations in Matosinhos.
Dive Deeper: Advanced Matosinhos STR Market Data (2026)
Ready to unlock more insights? AirROI provides access to advanced metrics and comprehensive Airbnb data for Matosinhos. Explore detailed analytics beyond this report to refine your investment strategy, optimize pricing, and maximize your vacation rental profits.
Explore Advanced MetricsMatosinhos Short-Term Rental Market Composition (2026): Property & Room Types
Room Type Distribution
Property Type Distribution
Market Composition Insights for Matosinhos
- The Matosinhos Airbnb market composition is heavily skewed towards Entire Home/Apt listings, which make up 73.9% of the 426 active rentals. This indicates strong guest preference for privacy and space.
- Looking at the property type distribution in Matosinhos, Apartment/Condo properties are the most common (60.3%), reflecting the local real estate landscape.
- Houses represent a significant 27.2% portion, catering likely to families or larger groups.
- The presence of 10.6% Hotel/Boutique listings indicates integration with traditional hospitality.
- Smaller segments like others, outdoor/unique (combined 1.9%) offer potential for unique stay experiences.
Matosinhos Airbnb Room Capacity Analysis (2026): Bedroom Distribution
Distribution of Listings by Number of Bedrooms
Room Capacity Insights for Matosinhos
- The dominant room capacity in Matosinhos is 1 bedroom listings, making up 44.6% of the market. This suggests a strong demand for properties suitable for couples or solo travelers.
- Together, 1 bedroom and 2 bedrooms properties represent 68.5% of the active Airbnb listings in Matosinhos, indicating a high concentration in these sizes.
Matosinhos Vacation Rental Guest Capacity Trends (2026)
Distribution of Listings by Guest Capacity
Guest Capacity Insights for Matosinhos
- The most common guest capacity trend in Matosinhos vacation rentals is listings accommodating 4 guests (26.5%). This suggests the primary traveler segment is likely small families or groups.
- Properties designed for 4 guests and 2 guests dominate the Matosinhos STR market, accounting for 49.7% of listings.
- 18.8% of properties accommodate 6+ guests, serving the market segment for larger families or group travel in Matosinhos.
- On average, properties in Matosinhos are equipped to host 3.4 guests.
Matosinhos Airbnb Booking Patterns (2026): Available vs. Booked Days
Available Days Distribution
Booked Days Distribution
Booking Pattern Insights for Matosinhos
- The most common availability pattern in Matosinhos falls within the 181-270 days range, representing 37.1% of listings. This suggests many properties have significant open periods on their calendars.
- Approximately 69.7% of listings show high availability (181+ days open annually), indicating potential for increased bookings or specific owner usage patterns.
- For booked days, the 91-180 days range is most frequent in Matosinhos (36.6%), reflecting common guest stay durations or potential owner blocking patterns.
- A notable 31.4% of properties secure long booking periods (181+ days booked per year), highlighting successful long-term rental strategies or significant owner usage.
Matosinhos Airbnb Minimum Stay Requirements Analysis
Distribution of Listings by Minimum Night Requirement
1 Night
104 listings
24.4% of total
2 Nights
73 listings
17.1% of total
3 Nights
44 listings
10.3% of total
4-6 Nights
26 listings
6.1% of total
7-29 Nights
14 listings
3.3% of total
30+ Nights
165 listings
38.7% of total
Key Insights
- The most prevalent minimum stay requirement in Matosinhos is 30+ Nights, adopted by 38.7% of listings. This highlights the market's preference for longer commitments.
- A significant segment (38.7%) caters to monthly stays (30+ nights) in Matosinhos, pointing to opportunities in the extended-stay market.
Recommendations
- Align with the market by considering a 30+ Nights minimum stay, as 38.7% of Matosinhos hosts use this setting.
- If feasible, allowing 1-night stays, especially midweek or during low season, could capture last-minute bookings, as only 24.4% currently do.
- Explore offering discounts for stays of 30+ nights to attract the 38.7% of the market seeking extended stays.
- Adjust minimum nights based on seasonality – potentially shorter during low season and longer during peak demand periods in Matosinhos.
Matosinhos Airbnb Cancellation Policy Trends Analysis (2026)
Super Strict 60 Days
1 listings
0.2% of total
Super Strict 30 Days
19 listings
4.5% of total
Limited
20 listings
4.7% of total
Flexible
86 listings
20.2% of total
Moderate
136 listings
31.9% of total
Firm
118 listings
27.7% of total
Strict
46 listings
10.8% of total
Cancellation Policy Insights for Matosinhos
- The prevailing Airbnb cancellation policy trend in Matosinhos is Moderate, used by 31.9% of listings.
- There's a relatively balanced mix between guest-friendly (52.1%) and stricter (38.5%) policies, offering choices for different guest needs.
Recommendations for Hosts
- Consider adopting a Moderate policy to align with the 31.9% market standard in Matosinhos.
- Using a Strict policy might deter some guests, as only 10.8% of listings use it. Evaluate if potential revenue protection outweighs possible lower booking rates.
- Regularly review your cancellation policy against competitors and market demand shifts in Matosinhos.
Matosinhos STR Booking Lead Time Analysis (2026)
Average Booking Lead Time by Month
Booking Lead Time Insights for Matosinhos
- The overall average booking lead time for vacation rentals in Matosinhos is 53 days.
- Guests book furthest in advance for stays during June (average 78 days), likely coinciding with peak travel demand or local events.
- The shortest booking windows occur for stays in February (average 29 days), indicating more last-minute travel plans during this time.
- Seasonally, Summer (75 days avg.) sees the longest lead times, while Winter (32 days avg.) has the shortest, reflecting typical travel planning cycles.
Recommendations for Hosts
- Use the overall average lead time (53 days) as a baseline for your pricing and availability strategy in Matosinhos.
- For June stays, consider implementing length-of-stay discounts or slightly higher rates for bookings made less than 78 days out to capitalize on advance planning.
- Target marketing efforts for the Summer season well in advance (at least 75 days) to capture early planners.
- Monitor your own booking lead times against these Matosinhos averages to identify opportunities for dynamic pricing adjustments.
Popular & Essential Airbnb Amenities in Matosinhos (2026)
Amenity Prevalence
Amenity Insights for Matosinhos
- Essential amenities in Matosinhos that guests expect include: Wifi. Lacking these (this) could significantly impact bookings.
- Popular amenities like TV, Kitchen, Hair dryer are common but not universal. Offering these can provide a competitive edge.
Recommendations for Hosts
- Ensure your listing includes all essential amenities for Matosinhos: Wifi.
- Prioritize adding missing essentials: Wifi.
- Consider adding popular differentiators like TV or Kitchen to increase appeal.
- Highlight unique or less common amenities you offer (e.g., hot tub, dedicated workspace, EV charger) in your listing description and photos.
- Regularly check competitor amenities in Matosinhos to stay competitive.
Matosinhos Airbnb Guest Demographics & Profile Analysis (2026)
Guest Profile Summary for Matosinhos
- The typical guest profile for Airbnb in Matosinhos consists of predominantly international visitors (90%), with top international origins including United Kingdom, typically belonging to the Post-2000s (Gen Z/Alpha) group (50%), primarily speaking English or Spanish.
- Domestic travelers account for 10.5% of guests.
- Key international markets include France (16%) and United Kingdom (12.2%).
- Top languages spoken are English (37.6%) followed by Spanish (13.3%).
- A significant demographic segment is the Post-2000s (Gen Z/Alpha) group, representing 50% of guests.
Recommendations for Hosts
- Focus marketing internationally, particularly towards travelers from United Kingdom.
- Tailor amenities and listing descriptions to appeal to the dominant Post-2000s (Gen Z/Alpha) demographic (e.g., highlight fast WiFi, smart home features, local guides).
- Highlight unique local experiences or amenities relevant to the primary guest profile.
- Consider seasonal promotions aligned with peak travel times for key origin markets.
Nearby Short-Term Rental Market Comparison
How does the Matosinhos Airbnb market stack up against its neighbors? Compare key performance metrics like average monthly revenue, ADR, and occupancy rates in surrounding areas to understand the broader regional STR landscape.
| Market | Active Properties | Monthly Revenue | Daily Rate | Avg. Occupancy |
|---|---|---|---|---|
| Penhalonga e Paços de Gaiolo | 23 | $4,304 | $357.04 | 40% |
| Sande e São Lourenço do Douro | 19 | $3,009 | $319.97 | 37% |
| Armamar | 66 | $2,578 | $266.43 | 36% |
| Alpendorada, Várzea e Torrão | 19 | $2,503 | $264.40 | 35% |
| Vila Boa de Quires e Maureles | 10 | $2,316 | $202.63 | 48% |
| Alijó | 69 | $2,072 | $250.65 | 30% |
| Cinfães | 16 | $2,059 | $253.86 | 28% |
| Portomarín | 12 | $2,006 | $181.90 | 49% |
| Barreiros | 10 | $1,928 | $192.32 | 39% |
| Mesão Frio | 58 | $1,896 | $182.28 | 42% |