São Salvador da Aramenha Airbnb Market Analysis 2026: Short Term Rental Data & Vacation Rental Statistics in Portalegre, Portugal
Is Airbnb profitable in São Salvador da Aramenha in 2026? Explore comprehensive Airbnb analytics for São Salvador da Aramenha, Portalegre, Portugal to uncover income potential. This 2026 STR market report for São Salvador da Aramenha, based on AirROI data from February 2025 to January 2026, reveals key trends in the niche market of 24 active listings.
Whether you're considering an Airbnb investment in São Salvador da Aramenha, optimizing your existing vacation rental, or exploring rental arbitrage opportunities, understanding the São Salvador da Aramenha Airbnb data is crucial. Navigating the high regulation landscape is key to maximizing your short term rental income potential. Let's dive into the specifics.
Key São Salvador da Aramenha Airbnb Performance Metrics Overview
Monthly Airbnb Revenue Variations & Income Potential in São Salvador da Aramenha (2026)
Understanding the monthly revenue variations for Airbnb listings in São Salvador da Aramenha is key to maximizing your short term rental income potential. Seasonality significantly impacts earnings. Our analysis, based on data from the past 12 months, shows that the peak revenue month for STRs in São Salvador da Aramenha is typically August, while November often presents the lowest earnings, highlighting opportunities for strategic pricing adjustments during shoulder and low seasons. Explore the typical Airbnb income in São Salvador da Aramenha across different performance tiers:
- Best-in-class properties (Top 10%) achieve $2,179+ monthly, often utilizing dynamic pricing and superior guest experiences.
- Strong performing properties (Top 25%) earn $1,276 or more, indicating effective management and desirable locations/amenities.
- Typical properties (Median) generate around $633 per month, representing the average market performance.
- Entry-level properties (Bottom 25%) see earnings around $329, often with potential for optimization.
Average Monthly Airbnb Earnings Trend in São Salvador da Aramenha
São Salvador da Aramenha Airbnb Occupancy Rate Trends (2026)
Maximize your bookings by understanding the São Salvador da Aramenha STR occupancy trends. Seasonal demand shifts significantly influence how often properties are booked. Typically, Augustsees the highest demand (peak season occupancy), while November experiences the lowest (low season). Effective strategies, like adjusting minimum stays or offering promotions, can boost occupancy during slower periods. Here's how different property tiers perform in São Salvador da Aramenha:
- Best-in-class properties (Top 10%) achieve 48%+ occupancy, indicating high desirability and potentially optimized availability.
- Strong performing properties (Top 25%) maintain 36% or higher occupancy, suggesting good market fit and guest satisfaction.
- Typical properties (Median) have an occupancy rate around 18%.
- Entry-level properties (Bottom 25%) average 10% occupancy, potentially facing higher vacancy.
Average Monthly Occupancy Rate Trend in São Salvador da Aramenha
Average Daily Rate (ADR) Airbnb Trends in São Salvador da Aramenha (2026)
Effective short term rental pricing strategy in São Salvador da Aramenha involves understanding monthly ADR fluctuations. The Average Daily Rate (ADR) for Airbnb in São Salvador da Aramenha typically peaks in August and dips lowest during February. Leveraging Airbnb dynamic pricing tools or strategies based on this seasonality can significantly boost revenue. Here's a look at the typical nightly rates achieved:
- Best-in-class properties (Top 10%) command rates of $193+ per night, often due to premium features or locations.
- Strong performing properties (Top 25%) achieve nightly rates of $127 or more.
- Typical properties (Median) charge around $97 per night.
- Entry-level properties (Bottom 25%) earn around $70 per night.
Average Daily Rate (ADR) Trend by Month in São Salvador da Aramenha
Get Live São Salvador da Aramenha Market Intelligence 👇

Explore Real-time Analytics
Airbnb Seasonality Analysis & Trends in São Salvador da Aramenha (2026)
Peak Season (August, July, March)
- Revenue averages $1,604 per month
- Occupancy rates average 36.2%
- Daily rates average $131
Shoulder Season
- Revenue averages $853 per month
- Occupancy maintains around 23.8%
- Daily rates hold near $123
Low Season (January, November, December)
- Revenue drops to average $397 per month
- Occupancy decreases to average 12.6%
- Daily rates adjust to average $126
Seasonality Insights for São Salvador da Aramenha
- The Airbnb seasonality in São Salvador da Aramenha shows highly seasonal trends requiring careful strategy. While the sections above show seasonal averages, it's also insightful to look at the extremes:
- During the high season, the absolute peak month showcases São Salvador da Aramenha's highest earning potential, with monthly revenues capable of climbing to $2,279, occupancy reaching a high of 48.0%, and ADRs peaking at $143.
- Conversely, the slowest single month of the year, typically falling within the low season, marks the market's lowest point. In this month, revenue might dip to $280, occupancy could drop to 10.4%, and ADRs may adjust down to $111.
- Understanding both the seasonal averages and these monthly peaks and troughs in revenue, occupancy, and ADR is crucial for maximizing your Airbnb profit potential in São Salvador da Aramenha.
Seasonal Strategies for Maximizing Profit
- Peak Season: Maximize revenue through premium pricing and potentially longer minimum stays. Ensure high availability.
- Low Season: Offer competitive pricing, special promotions (e.g., extended stay discounts), and flexible cancellation policies. Target off-season travelers like remote workers or budget-conscious guests.
- Shoulder Seasons: Implement dynamic pricing that balances peak and low rates. Target weekend travelers or specific events. Offer slightly more flexible terms than peak season.
- Regularly analyze your own performance against these São Salvador da Aramenha seasonality benchmarks and adjust your pricing and availability strategy accordingly.
Best Areas for Airbnb Investment in São Salvador da Aramenha (2026)
Exploring the top neighborhoods for short-term rentals in São Salvador da Aramenha? This section highlights key areas, outlining why they are attractive for hosts and guests, along with notable local attractions. Consider these locations based on your target guest profile and investment strategy.
| Neighborhood / Area | Why Host Here? (Target Guests & Appeal) | Key Attractions & Landmarks |
|---|---|---|
| Pelourinho | Historic center of Salvador, rich in colonial architecture and vibrant culture. A must-see for tourists, offering unique experiences and great opportunities for short-term rentals. | São Francisco Church, Elevador Lacerda, Pelourinho Square, Museum of Brazilian Music, Church of Bonfim, Festivals like Carnaval |
| Barra | Known for its beautiful beaches and the iconic Farol da Barra, this area attracts beach lovers and those looking for a lively atmosphere with bars and restaurants. | Barra Beach, Farol da Barra, Praia do Porto da Barra, Restaurants and bars, Marine Museum of Bahia |
| Rio Vermelho | A bohemian neighborhood with a vibrant nightlife, famous for its lively bars, restaurants and cultural events, appealing to young travelers and locals alike. | Rio Vermelho Beach, Casa de Iemanjá, Cultural events and parties, Art galleries and music venues |
| Pituba | A predominantly residential neighborhood that offers modern amenities, shopping and beaches, popular among families and business travelers. | Pituba Beach, Shopping centers, Local restaurants and cafes, Parks and green spaces |
| Lapinha | A quieter beach area known for its natural beauty and serenity, appealing to those looking for relaxation away from the city's hustle. | Lapinha Beach, Natural landscapes, Peaceful atmosphere, Local seafood restaurants |
| Itapuã | Famous for its beaches and cultural landmarks, Itapuã is a hotspot for tourists seeking leisure and local art, making it an attractive location for vacation rentals. | Itapuã Beach, Vinicius de Moraes's house, Church of Our Lady of Immaculate Conception, Cultural festivals |
| São Lázaro | A historical neighborhood that has seen a revival, attracting visitors interested in history and culture with more affordable lodging options. | Museum of Brazilian Music, Cultural heritage sites, Local artisan shops, Food markets |
| Stella Maris | A tranquil beach destination with stunning coastline, perfect for families and those looking for a quieter, relaxed vacation experience. | Stella Maris Beach, Nearby nature reserves, Local dining options, Water sports |
Understanding Airbnb License Requirements & STR Laws in São Salvador da Aramenha (2026)
Yes, São Salvador da Aramenha, Portalegre, Portugal enforces high STR regulations. Obtaining a license and ensuring compliance is almost certainly required according to current 2026 STR laws. Always verify the latest short term rental regulations and Airbnb license requirements directly with local government authorities for São Salvador da Aramenha to ensure full compliance before hosting.
(Source: AirROI data, 2026, based on 83% licensed listings)
Top Performing Airbnb Properties in São Salvador da Aramenha (2026)
Benchmark your potential! Explore examples of top-performing Airbnb properties in São Salvador da Aramenhabased on Trailing Twelve Month (TTM) revenue. Analyze their characteristics, revenue, occupancy rate, and ADR to understand what drives success in this market.

Casa Atelier - T1 in Quinta do Barrieiro
Entire Place • 1 bedroom

Casa do Alto Lodge
Entire Place • 1 bedroom

Fountain House
Entire Place • 2 bedrooms
Casa do Chapim-azul - Marvão
Entire Place • 4 bedrooms
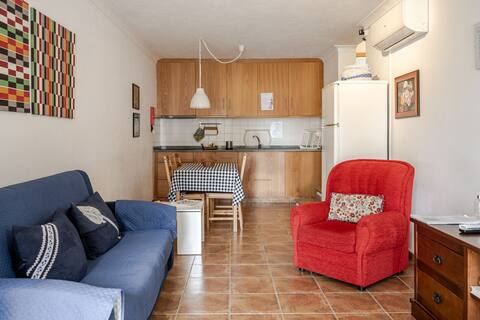
![Quinta das Reveladas T2 [2 bedrooms]](https://a0.muscache.com/im/pictures/hosting/Hosting-U3RheVN1cHBseUxpc3Rpbmc6ODMyNTk3NTQzNjg0NTkxODcz/original/3ffe96ee-f94a-4c9f-b40d-52d723769bb7.jpeg?im_w=480&im_format=avif)
Quinta das Reveladas T2 [2 bedrooms]
Entire Place • 2 bedrooms
Casa da Oliveira - Eira Velha - Marvão- Alentejo
Entire Place • 2 bedrooms
Note: Performance varies based on location, size, amenities, seasonality, and management quality. Data reflects the past 12 months.
Top Performing Airbnb Hosts in São Salvador da Aramenha (2026)
Learn from the best! This table showcases top-performing Airbnb hosts in São Salvador da Aramenha based on the number of properties managed and estimated total revenue over the past year. Analyze their scale and performance metrics.
| Host Name | Properties | Grossing Revenue | Stay Reviews | Avg Rating |
|---|---|---|---|---|
| João | 4 | $52,457 | 82 | 4.92/5.0 |
| Miguel | 1 | $19,595 | 78 | 4.91/5.0 |
| Naturanfitriao | 4 | $18,896 | 31 | 4.78/5.0 |
| Local | 1 | $12,179 | 3 | 5.00/5.0 |
| Joana | 1 | $11,945 | 40 | 4.73/5.0 |
| Teresa & Miguel | 1 | $8,876 | 58 | 4.93/5.0 |
| Paula | 1 | $8,664 | 25 | 4.96/5.0 |
| Portus Alacer Gestão De Propri | 1 | $8,634 | 2 | Not Rated |
| Nuno | 5 | $8,475 | 107 | 4.48/5.0 |
| Katya & João | 1 | $5,199 | 64 | 4.84/5.0 |
Analyzing the strategies of top hosts, such as their property selection, pricing, and guest communication, can offer valuable lessons for optimizing your own Airbnb operations in São Salvador da Aramenha.
Dive Deeper: Advanced São Salvador da Aramenha STR Market Data (2026)
Ready to unlock more insights? AirROI provides access to advanced metrics and comprehensive Airbnb data for São Salvador da Aramenha. Explore detailed analytics beyond this report to refine your investment strategy, optimize pricing, and maximize your vacation rental profits.
Explore Advanced MetricsSão Salvador da Aramenha Short-Term Rental Market Composition (2026): Property & Room Types
Room Type Distribution
Property Type Distribution
Market Composition Insights for São Salvador da Aramenha
- The São Salvador da Aramenha Airbnb market composition is heavily skewed towards Entire Home/Apt listings, which make up 87.5% of the 24 active rentals. This indicates strong guest preference for privacy and space.
- Looking at the property type distribution in São Salvador da Aramenha, House properties are the most common (54.2%), reflecting the local real estate landscape.
- Houses represent a significant 54.2% portion, catering likely to families or larger groups.
- The presence of 8.3% Hotel/Boutique listings indicates integration with traditional hospitality.
- Smaller segments like outdoor/unique (combined 4.2%) offer potential for unique stay experiences.
São Salvador da Aramenha Airbnb Room Capacity Analysis (2026): Bedroom Distribution
Distribution of Listings by Number of Bedrooms
Room Capacity Insights for São Salvador da Aramenha
- The dominant room capacity in São Salvador da Aramenha is 1 bedroom listings, making up 37.5% of the market. This suggests a strong demand for properties suitable for couples or solo travelers.
- Together, 1 bedroom and 2 bedrooms properties represent 75.0% of the active Airbnb listings in São Salvador da Aramenha, indicating a high concentration in these sizes.
São Salvador da Aramenha Vacation Rental Guest Capacity Trends (2026)
Distribution of Listings by Guest Capacity
Guest Capacity Insights for São Salvador da Aramenha
- The most common guest capacity trend in São Salvador da Aramenha vacation rentals is listings accommodating 4 guests (37.5%). This suggests the primary traveler segment is likely small families or groups.
- Properties designed for 4 guests and 2 guests dominate the São Salvador da Aramenha STR market, accounting for 62.5% of listings.
- 16.7% of properties accommodate 6+ guests, serving the market segment for larger families or group travel in São Salvador da Aramenha.
- On average, properties in São Salvador da Aramenha are equipped to host 3.4 guests.
São Salvador da Aramenha Airbnb Booking Patterns (2026): Available vs. Booked Days
Available Days Distribution
Booked Days Distribution
Booking Pattern Insights for São Salvador da Aramenha
- The most common availability pattern in São Salvador da Aramenha falls within the 271-366 days range, representing 83.3% of listings. This suggests many properties have significant open periods on their calendars.
- Approximately 95.8% of listings show high availability (181+ days open annually), indicating potential for increased bookings or specific owner usage patterns.
- For booked days, the 1-30 days range is most frequent in São Salvador da Aramenha (50%), reflecting common guest stay durations or potential owner blocking patterns.
- A notable 4.2% of properties secure long booking periods (181+ days booked per year), highlighting successful long-term rental strategies or significant owner usage.
São Salvador da Aramenha Airbnb Minimum Stay Requirements Analysis
Distribution of Listings by Minimum Night Requirement
1 Night
3 listings
12.5% of total
2 Nights
7 listings
29.2% of total
3 Nights
1 listings
4.2% of total
30+ Nights
13 listings
54.2% of total
Key Insights
- The most prevalent minimum stay requirement in São Salvador da Aramenha is 30+ Nights, adopted by 54.2% of listings. This highlights the market's preference for longer commitments.
- A significant segment (54.2%) caters to monthly stays (30+ nights) in São Salvador da Aramenha, pointing to opportunities in the extended-stay market.
Recommendations
- Align with the market by considering a 30+ Nights minimum stay, as 54.2% of São Salvador da Aramenha hosts use this setting.
- If feasible, allowing 1-night stays, especially midweek or during low season, could capture last-minute bookings, as only 12.5% currently do.
- Explore offering discounts for stays of 30+ nights to attract the 54.2% of the market seeking extended stays.
- Adjust minimum nights based on seasonality – potentially shorter during low season and longer during peak demand periods in São Salvador da Aramenha.
São Salvador da Aramenha Airbnb Cancellation Policy Trends Analysis (2026)
Limited
1 listings
4.2% of total
Flexible
10 listings
41.7% of total
Moderate
3 listings
12.5% of total
Firm
5 listings
20.8% of total
Strict
5 listings
20.8% of total
Cancellation Policy Insights for São Salvador da Aramenha
- The prevailing Airbnb cancellation policy trend in São Salvador da Aramenha is Flexible, used by 41.7% of listings.
- There's a relatively balanced mix between guest-friendly (54.2%) and stricter (41.6%) policies, offering choices for different guest needs.
Recommendations for Hosts
- Consider adopting a Flexible policy to align with the 41.7% market standard in São Salvador da Aramenha.
- Regularly review your cancellation policy against competitors and market demand shifts in São Salvador da Aramenha.
São Salvador da Aramenha STR Booking Lead Time Analysis (2026)
Average Booking Lead Time by Month
Booking Lead Time Insights for São Salvador da Aramenha
- The overall average booking lead time for vacation rentals in São Salvador da Aramenha is 45 days.
- Guests book furthest in advance for stays during October (average 82 days), likely coinciding with peak travel demand or local events.
- The shortest booking windows occur for stays in February (average 4 days), indicating more last-minute travel plans during this time.
- Seasonally, Summer (54 days avg.) sees the longest lead times, while Winter (23 days avg.) has the shortest, reflecting typical travel planning cycles.
Recommendations for Hosts
- Use the overall average lead time (45 days) as a baseline for your pricing and availability strategy in São Salvador da Aramenha.
- For October stays, consider implementing length-of-stay discounts or slightly higher rates for bookings made less than 82 days out to capitalize on advance planning.
- During February, focus on last-minute booking availability and promotions, as guests book with very short notice (4 days avg.).
- Target marketing efforts for the Summer season well in advance (at least 54 days) to capture early planners.
- Monitor your own booking lead times against these São Salvador da Aramenha averages to identify opportunities for dynamic pricing adjustments.
Popular & Essential Airbnb Amenities in São Salvador da Aramenha (2026)
Amenity Prevalence
Amenity Insights for São Salvador da Aramenha
- Essential amenities in São Salvador da Aramenha that guests expect include: TV, Wifi, Fire extinguisher. Lacking these (any) could significantly impact bookings.
- Popular amenities like Free parking on premises, First aid kit, Air conditioning are common but not universal. Offering these can provide a competitive edge.
Recommendations for Hosts
- Ensure your listing includes all essential amenities for São Salvador da Aramenha: TV, Wifi, Fire extinguisher.
- Prioritize adding missing essentials: TV, Wifi, Fire extinguisher.
- Consider adding popular differentiators like Free parking on premises or First aid kit to increase appeal.
- Highlight unique or less common amenities you offer (e.g., hot tub, dedicated workspace, EV charger) in your listing description and photos.
- Regularly check competitor amenities in São Salvador da Aramenha to stay competitive.
São Salvador da Aramenha Airbnb Guest Demographics & Profile Analysis (2026)
Guest Profile Summary for São Salvador da Aramenha
- The typical guest profile for Airbnb in São Salvador da Aramenha consists of predominantly international visitors (80%), with top international origins including United Kingdom, typically belonging to the Post-2000s (Gen Z/Alpha) group (50%), primarily speaking English or Spanish.
- Domestic travelers account for 20.3% of guests.
- Key international markets include Portugal (20.3%) and United Kingdom (11.4%).
- Top languages spoken are English (36.2%) followed by Spanish (17%).
- A significant demographic segment is the Post-2000s (Gen Z/Alpha) group, representing 50% of guests.
Recommendations for Hosts
- Focus marketing internationally, particularly towards travelers from United Kingdom.
- Tailor amenities and listing descriptions to appeal to the dominant Post-2000s (Gen Z/Alpha) demographic (e.g., highlight fast WiFi, smart home features, local guides).
- Highlight unique local experiences or amenities relevant to the primary guest profile.
- Consider seasonal promotions aligned with peak travel times for key origin markets.
Nearby Short-Term Rental Market Comparison
How does the São Salvador da Aramenha Airbnb market stack up against its neighbors? Compare key performance metrics like average monthly revenue, ADR, and occupancy rates in surrounding areas to understand the broader regional STR landscape.
| Market | Active Properties | Monthly Revenue | Daily Rate | Avg. Occupancy |
|---|---|---|---|---|
| Comporta | 111 | $3,719 | $422.92 | 41% |
| Alcácer do Sal | 19 | $3,194 | $386.92 | 32% |
| Ferreira do Alentejo | 13 | $3,006 | $280.31 | 39% |
| Monesterio | 17 | $3,001 | $260.35 | 36% |
| Grândola | 333 | $2,617 | $425.67 | 34% |
| Sousel | 16 | $2,083 | $291.22 | 34% |
| Benavente | 15 | $1,918 | $215.81 | 45% |
| Ponte de Sor | 55 | $1,858 | $237.77 | 34% |
| Redondo | 26 | $1,798 | $233.17 | 37% |
| Alcochete | 17 | $1,757 | $152.88 | 46% |