Calheta Airbnb Market Analysis 2026: Short Term Rental Data & Vacation Rental Statistics in Madeira, Portugal
Is Airbnb profitable in Calheta in 2026? Explore comprehensive Airbnb analytics for Calheta, Madeira, Portugal to uncover income potential. This 2026 STR market report for Calheta, based on AirROI data from February 2025 to January 2026, reveals key trends in the bustling market of 1,039 active listings.
Whether you're considering an Airbnb investment in Calheta, optimizing your existing vacation rental, or exploring rental arbitrage opportunities, understanding the Calheta Airbnb data is crucial. Navigating the high regulation landscape is key to maximizing your short term rental income potential. Let's dive into the specifics.
Key Calheta Airbnb Performance Metrics Overview
Monthly Airbnb Revenue Variations & Income Potential in Calheta (2026)
Understanding the monthly revenue variations for Airbnb listings in Calheta is key to maximizing your short term rental income potential. Seasonality significantly impacts earnings. Our analysis, based on data from the past 12 months, shows that the peak revenue month for STRs in Calheta is typically August, while January often presents the lowest earnings, highlighting opportunities for strategic pricing adjustments during shoulder and low seasons. Explore the typical Airbnb income in Calheta across different performance tiers:
- Best-in-class properties (Top 10%) achieve $7,007+ monthly, often utilizing dynamic pricing and superior guest experiences.
- Strong performing properties (Top 25%) earn $4,358 or more, indicating effective management and desirable locations/amenities.
- Typical properties (Median) generate around $2,708 per month, representing the average market performance.
- Entry-level properties (Bottom 25%) see earnings around $1,734, often with potential for optimization.
Average Monthly Airbnb Earnings Trend in Calheta
Calheta Airbnb Occupancy Rate Trends (2026)
Maximize your bookings by understanding the Calheta STR occupancy trends. Seasonal demand shifts significantly influence how often properties are booked. Typically, Augustsees the highest demand (peak season occupancy), while January experiences the lowest (low season). Effective strategies, like adjusting minimum stays or offering promotions, can boost occupancy during slower periods. Here's how different property tiers perform in Calheta:
- Best-in-class properties (Top 10%) achieve 92%+ occupancy, indicating high desirability and potentially optimized availability.
- Strong performing properties (Top 25%) maintain 82% or higher occupancy, suggesting good market fit and guest satisfaction.
- Typical properties (Median) have an occupancy rate around 67%.
- Entry-level properties (Bottom 25%) average 48% occupancy, potentially facing higher vacancy.
Average Monthly Occupancy Rate Trend in Calheta
Average Daily Rate (ADR) Airbnb Trends in Calheta (2026)
Effective short term rental pricing strategy in Calheta involves understanding monthly ADR fluctuations. The Average Daily Rate (ADR) for Airbnb in Calheta typically peaks in August and dips lowest during February. Leveraging Airbnb dynamic pricing tools or strategies based on this seasonality can significantly boost revenue. Here's a look at the typical nightly rates achieved:
- Best-in-class properties (Top 10%) command rates of $358+ per night, often due to premium features or locations.
- Strong performing properties (Top 25%) achieve nightly rates of $231 or more.
- Typical properties (Median) charge around $143 per night.
- Entry-level properties (Bottom 25%) earn around $102 per night.
Average Daily Rate (ADR) Trend by Month in Calheta
Get Live Calheta Market Intelligence 👇

Explore Real-time Analytics
Airbnb Seasonality Analysis & Trends in Calheta (2026)
Peak Season (August, July, September)
- Revenue averages $5,126 per month
- Occupancy rates average 75.9%
- Daily rates average $232
Shoulder Season
- Revenue averages $3,833 per month
- Occupancy maintains around 65.5%
- Daily rates hold near $204
Low Season (January, February, December)
- Revenue drops to average $2,435 per month
- Occupancy decreases to average 42.9%
- Daily rates adjust to average $201
Seasonality Insights for Calheta
- The Airbnb seasonality in Calheta shows highly seasonal trends requiring careful strategy. While the sections above show seasonal averages, it's also insightful to look at the extremes:
- During the high season, the absolute peak month showcases Calheta's highest earning potential, with monthly revenues capable of climbing to $5,462, occupancy reaching a high of 77.6%, and ADRs peaking at $238.
- Conversely, the slowest single month of the year, typically falling within the low season, marks the market's lowest point. In this month, revenue might dip to $1,971, occupancy could drop to 32.1%, and ADRs may adjust down to $177.
- Understanding both the seasonal averages and these monthly peaks and troughs in revenue, occupancy, and ADR is crucial for maximizing your Airbnb profit potential in Calheta.
Seasonal Strategies for Maximizing Profit
- Peak Season: Maximize revenue through premium pricing and potentially longer minimum stays. Ensure high availability.
- Low Season: Offer competitive pricing, special promotions (e.g., extended stay discounts), and flexible cancellation policies. Target off-season travelers like remote workers or budget-conscious guests.
- Shoulder Seasons: Implement dynamic pricing that balances peak and low rates. Target weekend travelers or specific events. Offer slightly more flexible terms than peak season.
- Regularly analyze your own performance against these Calheta seasonality benchmarks and adjust your pricing and availability strategy accordingly.
Best Areas for Airbnb Investment in Calheta (2026)
Exploring the top neighborhoods for short-term rentals in Calheta? This section highlights key areas, outlining why they are attractive for hosts and guests, along with notable local attractions. Consider these locations based on your target guest profile and investment strategy.
| Neighborhood / Area | Why Host Here? (Target Guests & Appeal) | Key Attractions & Landmarks |
|---|---|---|
| Calheta Beach | Beautiful sandy beach known for its clear blue waters and calm atmosphere, popular with families and sun-seekers. Great spot for vacation rentals close to the water and local amenities. | Calheta Beach, Calheta Marina, Golden Beach Club, Casa das Mudas Arts Center, Whale Watching Tours |
| Prazeres | Charming rural area known for its stunning landscapes and tranquility, perfect for those seeking a peaceful retreat. Attracts nature lovers and those interested in local culture. | Prazeres Nature Park, Local fruit markets, Hiking trails, Traditional Madeiran architecture |
| Ponta do Sol | Known for being one of the sunniest places in Madeira, it offers breathtaking coastal views and a laid-back vibe. Ideal for travelers looking for a picturesque setting with outdoor activities. | Ponta do Sol Beach, Miradouro da Ponta do Sol, Walking trails, Local restaurants and cafes |
| Arco da Calheta | A scenic village that serves as a great base for exploring the surrounding countryside and coastal areas. Popular for its hiking routes and stunning views. | Levada walks, Scenic viewpoints, Botanical gardens, Traditional Madeiran restaurants |
| Estreito da Calheta | Known for its vineyards and wine production, this area offers a unique experience for wine lovers and provides a glimpse into local agriculture. | Wine tasting tours, Vineyard tours, Estreito da Calheta Church |
| Garajau | A tranquil area known for its nature reserve and beautiful cliffs, attracting visitors who enjoy outdoor activities like diving and hiking. | Garajau Natural Reserve, Ponta do Garajau, Diving spots, Hiking trails |
| Calheta (Centro) | The town center offers a vibrant atmosphere with shops, restaurants, and local markets, making it a convenient place for tourists to stay. | Local markets, Restaurants and cafes, Cultural events |
| Caminho da Ponta do Sol | This area offers stunning views of the ocean and is great for those looking for a unique and peaceful experience, popular with adventurous travelers. | Walking and hiking trails, Scenic viewpoints, Relaxing spots near the cliffs |
Understanding Airbnb License Requirements & STR Laws in Calheta (2026)
Yes, Calheta, Madeira, Portugal enforces high STR regulations. Obtaining a license and ensuring compliance is almost certainly required according to current 2026 STR laws. Always verify the latest short term rental regulations and Airbnb license requirements directly with local government authorities for Calheta to ensure full compliance before hosting.
(Source: AirROI data, 2026, based on 94% licensed listings)
Top Performing Airbnb Properties in Calheta (2026)
Benchmark your potential! Explore examples of top-performing Airbnb properties in Calhetabased on Trailing Twelve Month (TTM) revenue. Analyze their characteristics, revenue, occupancy rate, and ADR to understand what drives success in this market.

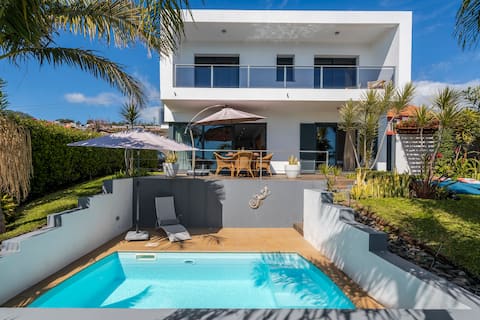
Quinta Marefe - On the stunning west coast
Entire Place • 3 bedrooms
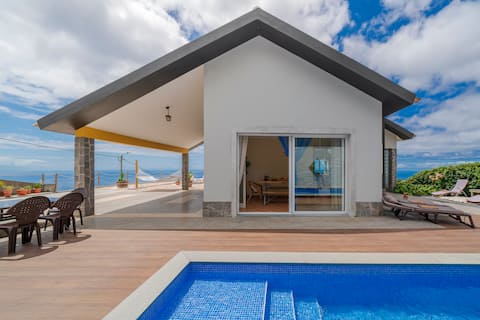
Villa Hibiscus by An Island Apart
Entire Place • 4 bedrooms
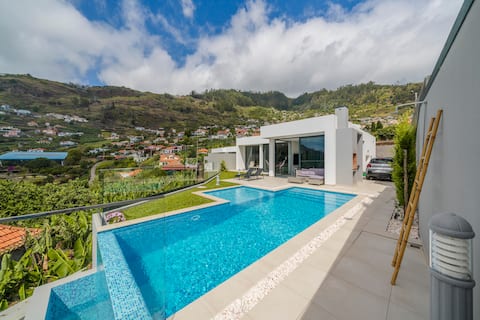
Villa Sea Colors by An Island Apart
Entire Place • 2 bedrooms
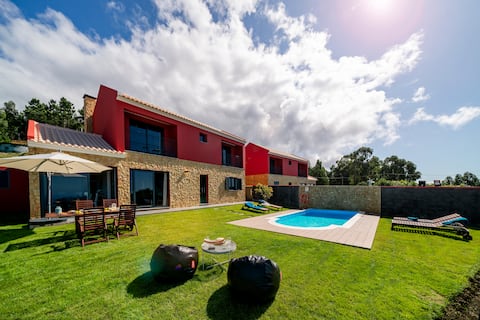
Pearl of Calheta by An Island Apart
Entire Place • 3 bedrooms

Southern Sunny House by An Island Apart
Entire Place • 3 bedrooms
Felicidade Rocha II by An Island Apart
Entire Place • 3 bedrooms
Note: Performance varies based on location, size, amenities, seasonality, and management quality. Data reflects the past 12 months.
Top Performing Airbnb Hosts in Calheta (2026)
Learn from the best! This table showcases top-performing Airbnb hosts in Calheta based on the number of properties managed and estimated total revenue over the past year. Analyze their scale and performance metrics.
| Host Name | Properties | Grossing Revenue | Stay Reviews | Avg Rating |
|---|---|---|---|---|
| An Island | 17 | $4,923,367 | 867 | 4.76/5.0 |
| OurMadeira | 45 | $2,854,226 | 2628 | 4.86/5.0 |
| LovelyStay | 31 | $1,486,699 | 732 | 4.69/5.0 |
| Jorge | 22 | $1,027,391 | 865 | 4.91/5.0 |
| Kevin | 9 | $547,862 | 228 | 4.96/5.0 |
| Notabreu Getaways | 1 | $512,633 | 29 | 5.00/5.0 |
| Leonel | 6 | $478,239 | 299 | 4.96/5.0 |
| William | 5 | $437,392 | 256 | 4.94/5.0 |
| Atlantic Holiday | 6 | $409,256 | 93 | 4.64/5.0 |
| Galmi | 9 | $392,063 | 519 | 4.63/5.0 |
Analyzing the strategies of top hosts, such as their property selection, pricing, and guest communication, can offer valuable lessons for optimizing your own Airbnb operations in Calheta.
Dive Deeper: Advanced Calheta STR Market Data (2026)
Ready to unlock more insights? AirROI provides access to advanced metrics and comprehensive Airbnb data for Calheta. Explore detailed analytics beyond this report to refine your investment strategy, optimize pricing, and maximize your vacation rental profits.
Explore Advanced MetricsCalheta Short-Term Rental Market Composition (2026): Property & Room Types
Room Type Distribution
Property Type Distribution
Market Composition Insights for Calheta
- The Calheta Airbnb market composition is heavily skewed towards Entire Home/Apt listings, which make up 93% of the 1,039 active rentals. This indicates strong guest preference for privacy and space.
- Looking at the property type distribution in Calheta, House properties are the most common (64.4%), reflecting the local real estate landscape.
- Houses represent a significant 64.4% portion, catering likely to families or larger groups.
- Smaller segments like hotel/boutique, outdoor/unique, unique stays, others (combined 9.2%) offer potential for unique stay experiences.
Calheta Airbnb Room Capacity Analysis (2026): Bedroom Distribution
Distribution of Listings by Number of Bedrooms
Room Capacity Insights for Calheta
- The dominant room capacity in Calheta is 1 bedroom listings, making up 35.2% of the market. This suggests a strong demand for properties suitable for couples or solo travelers.
- Together, 1 bedroom and 2 bedrooms properties represent 65.9% of the active Airbnb listings in Calheta, indicating a high concentration in these sizes.
- A significant 28.9% of listings offer 3+ bedrooms, catering to larger groups and families seeking more space in Calheta.
Calheta Vacation Rental Guest Capacity Trends (2026)
Distribution of Listings by Guest Capacity
Guest Capacity Insights for Calheta
- The most common guest capacity trend in Calheta vacation rentals is listings accommodating 4 guests (27.2%). This suggests the primary traveler segment is likely small families or groups.
- Properties designed for 4 guests and 2 guests dominate the Calheta STR market, accounting for 52.9% of listings.
- 30.0% of properties accommodate 6+ guests, serving the market segment for larger families or group travel in Calheta.
- On average, properties in Calheta are equipped to host 4.1 guests.
Calheta Airbnb Booking Patterns (2026): Available vs. Booked Days
Available Days Distribution
Booked Days Distribution
Booking Pattern Insights for Calheta
- The most common availability pattern in Calheta falls within the 91-180 days range, representing 36.8% of listings. This suggests many properties have significant open periods on their calendars.
- Approximately 40.9% of listings show high availability (181+ days open annually), indicating potential for increased bookings or specific owner usage patterns.
- For booked days, the 181-270 days range is most frequent in Calheta (36.2%), reflecting common guest stay durations or potential owner blocking patterns.
- A notable 60.1% of properties secure long booking periods (181+ days booked per year), highlighting successful long-term rental strategies or significant owner usage.
Calheta Airbnb Minimum Stay Requirements Analysis
Distribution of Listings by Minimum Night Requirement
1 Night
46 listings
4.4% of total
2 Nights
33 listings
3.2% of total
3 Nights
103 listings
9.9% of total
4-6 Nights
488 listings
47% of total
7-29 Nights
33 listings
3.2% of total
30+ Nights
335 listings
32.3% of total
Key Insights
- The most prevalent minimum stay requirement in Calheta is 4-6 Nights, adopted by 47% of listings. This highlights the market's preference for longer commitments.
- Very short stays (1-2 nights) are less common (7.6%), suggesting hosts prefer slightly longer bookings to optimize turnover.
- A significant segment (32.3%) caters to monthly stays (30+ nights) in Calheta, pointing to opportunities in the extended-stay market.
Recommendations
- Align with the market by considering a 4-6 Nights minimum stay, as 47% of Calheta hosts use this setting.
- If feasible, allowing 1-night stays, especially midweek or during low season, could capture last-minute bookings, as only 4.4% currently do.
- Explore offering discounts for stays of 30+ nights to attract the 32.3% of the market seeking extended stays.
- Adjust minimum nights based on seasonality – potentially shorter during low season and longer during peak demand periods in Calheta.
Calheta Airbnb Cancellation Policy Trends Analysis (2026)
Super Strict 60 Days
53 listings
5.1% of total
Limited
33 listings
3.2% of total
Super Strict 30 Days
61 listings
5.9% of total
Flexible
130 listings
12.5% of total
Moderate
183 listings
17.6% of total
Firm
451 listings
43.4% of total
Strict
127 listings
12.2% of total
Cancellation Policy Insights for Calheta
- The prevailing Airbnb cancellation policy trend in Calheta is Firm, used by 43.4% of listings.
- A majority (55.6%) of hosts in Calheta utilize Firm or Strict policies, indicating a market where hosts prioritize booking security.
Recommendations for Hosts
- Consider adopting a Firm policy to align with the 43.4% market standard in Calheta.
- Using a Strict policy might deter some guests, as only 12.2% of listings use it. Evaluate if potential revenue protection outweighs possible lower booking rates.
- Regularly review your cancellation policy against competitors and market demand shifts in Calheta.
Calheta STR Booking Lead Time Analysis (2026)
Average Booking Lead Time by Month
Booking Lead Time Insights for Calheta
- The overall average booking lead time for vacation rentals in Calheta is 94 days.
- Guests book furthest in advance for stays during August (average 128 days), likely coinciding with peak travel demand or local events.
- The shortest booking windows occur for stays in February (average 63 days), indicating more last-minute travel plans during this time.
- Seasonally, Summer (116 days avg.) sees the longest lead times, while Winter (73 days avg.) has the shortest, reflecting typical travel planning cycles.
Recommendations for Hosts
- Use the overall average lead time (94 days) as a baseline for your pricing and availability strategy in Calheta.
- For August stays, consider implementing length-of-stay discounts or slightly higher rates for bookings made less than 128 days out to capitalize on advance planning.
- Target marketing efforts for the Summer season well in advance (at least 116 days) to capture early planners.
- Monitor your own booking lead times against these Calheta averages to identify opportunities for dynamic pricing adjustments.
Popular & Essential Airbnb Amenities in Calheta (2026)
Amenity Prevalence
Amenity Insights for Calheta
- Essential amenities in Calheta that guests expect include: Wifi. Lacking these (this) could significantly impact bookings.
- Popular amenities like TV, Kitchen, Hair dryer are common but not universal. Offering these can provide a competitive edge.
Recommendations for Hosts
- Ensure your listing includes all essential amenities for Calheta: Wifi.
- Prioritize adding missing essentials: Wifi.
- Consider adding popular differentiators like TV or Kitchen to increase appeal.
- Highlight unique or less common amenities you offer (e.g., hot tub, dedicated workspace, EV charger) in your listing description and photos.
- Regularly check competitor amenities in Calheta to stay competitive.
Calheta Airbnb Guest Demographics & Profile Analysis (2026)
Guest Profile Summary for Calheta
- The typical guest profile for Airbnb in Calheta consists of predominantly international visitors (99%), with top international origins including France, typically belonging to the Post-2000s (Gen Z/Alpha) group (50%), primarily speaking English or German.
- Domestic travelers account for 1.1% of guests.
- Key international markets include Germany (23.1%) and France (20.6%).
- Top languages spoken are English (41.1%) followed by German (17.6%).
- A significant demographic segment is the Post-2000s (Gen Z/Alpha) group, representing 50% of guests.
Recommendations for Hosts
- Focus marketing internationally, particularly towards travelers from France.
- Tailor amenities and listing descriptions to appeal to the dominant Post-2000s (Gen Z/Alpha) demographic (e.g., highlight fast WiFi, smart home features, local guides).
- Highlight unique local experiences or amenities relevant to the primary guest profile.
- Consider seasonal promotions aligned with peak travel times for key origin markets.
Nearby Short-Term Rental Market Comparison
How does the Calheta Airbnb market stack up against its neighbors? Compare key performance metrics like average monthly revenue, ADR, and occupancy rates in surrounding areas to understand the broader regional STR landscape.
| Market | Active Properties | Monthly Revenue | Daily Rate | Avg. Occupancy |
|---|---|---|---|---|
| Arco da Calheta | 17 | $5,474 | $443.45 | 51% |
| Funchal | 2,433 | $4,191 | $260.62 | 60% |
| Ribeira Brava | 258 | $3,535 | $204.04 | 62% |
| Câmara de Lobos | 144 | $3,488 | $232.69 | 61% |
| Ponta do Sol | 320 | $3,423 | $190.11 | 64% |
| Santa Cruz | 525 | $3,187 | $203.69 | 57% |
| São Vicente | 281 | $2,699 | $170.50 | 61% |
| Estreito da Calheta | 19 | $2,421 | $206.82 | 57% |
| Porto Santo | 182 | $2,339 | $237.97 | 42% |
| Porto Moniz | 174 | $1,990 | $135.09 | 57% |