Ribamar Airbnb Market Analysis 2026: Short Term Rental Data & Vacation Rental Statistics in Lisbon, Portugal
Is Airbnb profitable in Ribamar in 2026? Explore comprehensive Airbnb analytics for Ribamar, Lisbon, Portugal to uncover income potential. This 2026 STR market report for Ribamar, based on AirROI data from February 2025 to January 2026, reveals key trends in the niche market of 19 active listings.
Whether you're considering an Airbnb investment in Ribamar, optimizing your existing vacation rental, or exploring rental arbitrage opportunities, understanding the Ribamar Airbnb data is crucial. Navigating the high regulation landscape is key to maximizing your short term rental income potential. Let's dive into the specifics.
Key Ribamar Airbnb Performance Metrics Overview
Monthly Airbnb Revenue Variations & Income Potential in Ribamar (2026)
Understanding the monthly revenue variations for Airbnb listings in Ribamar is key to maximizing your short term rental income potential. Seasonality significantly impacts earnings. Our analysis, based on data from the past 12 months, shows that the peak revenue month for STRs in Ribamar is typically July, while February often presents the lowest earnings, highlighting opportunities for strategic pricing adjustments during shoulder and low seasons. Explore the typical Airbnb income in Ribamar across different performance tiers:
- Best-in-class properties (Top 10%) achieve $7,784+ monthly, often utilizing dynamic pricing and superior guest experiences.
- Strong performing properties (Top 25%) earn $5,637 or more, indicating effective management and desirable locations/amenities.
- Typical properties (Median) generate around $2,670 per month, representing the average market performance.
- Entry-level properties (Bottom 25%) see earnings around $1,093, often with potential for optimization.
Average Monthly Airbnb Earnings Trend in Ribamar
Ribamar Airbnb Occupancy Rate Trends (2026)
Maximize your bookings by understanding the Ribamar STR occupancy trends. Seasonal demand shifts significantly influence how often properties are booked. Typically, Augustsees the highest demand (peak season occupancy), while February experiences the lowest (low season). Effective strategies, like adjusting minimum stays or offering promotions, can boost occupancy during slower periods. Here's how different property tiers perform in Ribamar:
- Best-in-class properties (Top 10%) achieve 60%+ occupancy, indicating high desirability and potentially optimized availability.
- Strong performing properties (Top 25%) maintain 47% or higher occupancy, suggesting good market fit and guest satisfaction.
- Typical properties (Median) have an occupancy rate around 30%.
- Entry-level properties (Bottom 25%) average 18% occupancy, potentially facing higher vacancy.
Average Monthly Occupancy Rate Trend in Ribamar
Average Daily Rate (ADR) Airbnb Trends in Ribamar (2026)
Effective short term rental pricing strategy in Ribamar involves understanding monthly ADR fluctuations. The Average Daily Rate (ADR) for Airbnb in Ribamar typically peaks in July and dips lowest during January. Leveraging Airbnb dynamic pricing tools or strategies based on this seasonality can significantly boost revenue. Here's a look at the typical nightly rates achieved:
- Best-in-class properties (Top 10%) command rates of $510+ per night, often due to premium features or locations.
- Strong performing properties (Top 25%) achieve nightly rates of $438 or more.
- Typical properties (Median) charge around $202 per night.
- Entry-level properties (Bottom 25%) earn around $97 per night.
Average Daily Rate (ADR) Trend by Month in Ribamar
Get Live Ribamar Market Intelligence 👇

Explore Real-time Analytics
Airbnb Seasonality Analysis & Trends in Ribamar (2026)
Peak Season (July, August, September)
- Revenue averages $6,353 per month
- Occupancy rates average 57.6%
- Daily rates average $295
Shoulder Season
- Revenue averages $3,443 per month
- Occupancy maintains around 31.2%
- Daily rates hold near $268
Low Season (January, February, November)
- Revenue drops to average $1,428 per month
- Occupancy decreases to average 15.8%
- Daily rates adjust to average $239
Seasonality Insights for Ribamar
- The Airbnb seasonality in Ribamar shows highly seasonal trends requiring careful strategy. While the sections above show seasonal averages, it's also insightful to look at the extremes:
- During the high season, the absolute peak month showcases Ribamar's highest earning potential, with monthly revenues capable of climbing to $7,043, occupancy reaching a high of 63.5%, and ADRs peaking at $303.
- Conversely, the slowest single month of the year, typically falling within the low season, marks the market's lowest point. In this month, revenue might dip to $1,347, occupancy could drop to 13.6%, and ADRs may adjust down to $220.
- Understanding both the seasonal averages and these monthly peaks and troughs in revenue, occupancy, and ADR is crucial for maximizing your Airbnb profit potential in Ribamar.
Seasonal Strategies for Maximizing Profit
- Peak Season: Maximize revenue through premium pricing and potentially longer minimum stays. Ensure high availability.
- Low Season: Offer competitive pricing, special promotions (e.g., extended stay discounts), and flexible cancellation policies. Target off-season travelers like remote workers or budget-conscious guests.
- Shoulder Seasons: Implement dynamic pricing that balances peak and low rates. Target weekend travelers or specific events. Offer slightly more flexible terms than peak season.
- Regularly analyze your own performance against these Ribamar seasonality benchmarks and adjust your pricing and availability strategy accordingly.
Best Areas for Airbnb Investment in Ribamar (2026)
Exploring the top neighborhoods for short-term rentals in Ribamar? This section highlights key areas, outlining why they are attractive for hosts and guests, along with notable local attractions. Consider these locations based on your target guest profile and investment strategy.
| Neighborhood / Area | Why Host Here? (Target Guests & Appeal) | Key Attractions & Landmarks |
|---|---|---|
| Praia da Aguda | A stunning beachside location, perfect for tourists seeking a relaxing getaway. Known for its beautiful scenery and local seafood restaurants. | Praia da Aguda Beach, Fort of Nossa Senhora da Aguda, Fish Market, Lifeguard Station, Coastal Walking Trails |
| Cabo da Roca | The westernmost point of mainland Europe, offering breathtaking views and a popular spot for travelers looking to experience nature's beauty. | Cabo da Roca Lighthouse, Roca's Viewpoint, Hiking Trails, Local Craft Shops, Beautiful cliffs |
| Colares | A picturesque village surrounded by natural parks and stunning beaches, appealing to families and nature lovers looking to escape the city. | Praia das Maçãs, Sintra-Cascais Natural Park, Local wineries, Traditional Portuguese restaurants, Scenic viewpoints |
| Sintra | A UNESCO World Heritage site famous for its palaces and romantic architecture. A must-visit for tourists exploring the Lisbon region. | Pena Palace, Moors Castle, Quinta da Regaleira, Sintra National Palace, Cabo da Roca |
| Ericeira | A charming fishing village known for surf spots and a vibrant atmosphere, attracting adventure seekers and beach enthusiasts. | Ericeira Surf Spots, Praia dos Pescadores, Local seafood restaurants, Ericeira Market, Historical Center |
| Monterosso | Lesser-known area with beautiful landscapes and a serene environment, ideal for quiet retreats and nature enthusiasts. | Lagoa Azul (Blue Lagoon), Hiking trails, Birdwatching spots, Local artisanal shops, Countryside views |
| Lisbon Coast | A long stretch of coastline with numerous beaches and resorts, offering a variety of activities for all types of travelers. | Beaches of Cascais, Estoril Casino, Coastal towns of Cascais and Estoril, Seaside promenades, Surf schools |
| Sintra Greenhouse | A unique location featuring beautiful gardens and a chance to experience nature close to the cultural offerings of Sintra. | Sintra Botanical Garden, Tranquil walking paths, Nature workshops, Local flora shopping, Cultural events |
Understanding Airbnb License Requirements & STR Laws in Ribamar (2026)
Yes, Ribamar, Lisbon, Portugal enforces high STR regulations. Obtaining a license and ensuring compliance is almost certainly required according to current 2026 STR laws. Always verify the latest short term rental regulations and Airbnb license requirements directly with local government authorities for Ribamar to ensure full compliance before hosting.
(Source: AirROI data, 2026, based on 74% licensed listings)
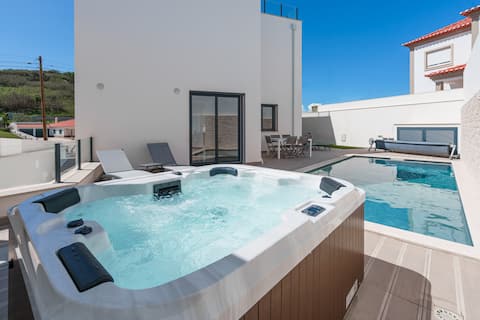
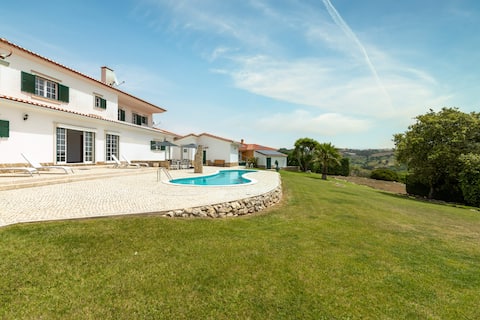
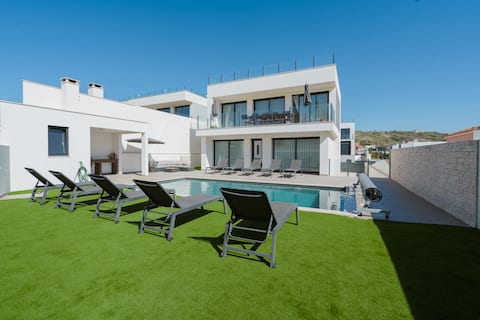
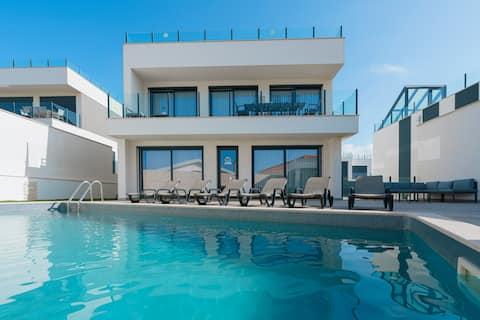
Top Performing Airbnb Properties in Ribamar (2026)
Benchmark your potential! Explore examples of top-performing Airbnb properties in Ribamarbased on Trailing Twelve Month (TTM) revenue. Analyze their characteristics, revenue, occupancy rate, and ADR to understand what drives success in this market.
Ammos Villa, beach villa with ocean view
Entire Place • 6 bedrooms
Villa Casa Branca l Spacious Retreat with Pool!
Entire Place • 6 bedrooms
Areia Villa, with ocean view
Entire Place • 5 bedrooms
Eden Villa with jacuzzi and ocean view
Entire Place • 5 bedrooms
Antica Villa, luxury villa near the beach
Entire Place • 5 bedrooms
Villa Sapateira
Entire Place • 5 bedrooms
Note: Performance varies based on location, size, amenities, seasonality, and management quality. Data reflects the past 12 months.
Top Performing Airbnb Hosts in Ribamar (2026)
Learn from the best! This table showcases top-performing Airbnb hosts in Ribamar based on the number of properties managed and estimated total revenue over the past year. Analyze their scale and performance metrics.
| Host Name | Properties | Grossing Revenue | Stay Reviews | Avg Rating |
|---|---|---|---|---|
| Rafael David | 4 | $273,417 | 52 | 4.83/5.0 |
| Peter | 1 | $69,704 | 45 | 4.98/5.0 |
| Evelijn | 1 | $46,231 | 10 | 4.60/5.0 |
| David | 1 | $43,930 | 2 | Not Rated |
| Mara | 4 | $39,226 | 136 | 4.65/5.0 |
| Claudia | 1 | $15,295 | 13 | 5.00/5.0 |
| Adosinda | 2 | $13,676 | 75 | 4.78/5.0 |
| Joaquim | 2 | $9,577 | 16 | 4.54/5.0 |
| Anabela | 1 | $3,612 | 9 | 5.00/5.0 |
| Holidu | 1 | $1,683 | 1 | Not Rated |
Analyzing the strategies of top hosts, such as their property selection, pricing, and guest communication, can offer valuable lessons for optimizing your own Airbnb operations in Ribamar.
Dive Deeper: Advanced Ribamar STR Market Data (2026)
Ready to unlock more insights? AirROI provides access to advanced metrics and comprehensive Airbnb data for Ribamar. Explore detailed analytics beyond this report to refine your investment strategy, optimize pricing, and maximize your vacation rental profits.
Explore Advanced MetricsRibamar Short-Term Rental Market Composition (2026): Property & Room Types
Room Type Distribution
Property Type Distribution
Market Composition Insights for Ribamar
- The Ribamar Airbnb market composition is heavily skewed towards Entire Home/Apt listings, which make up 94.7% of the 19 active rentals. This indicates strong guest preference for privacy and space.
- Looking at the property type distribution in Ribamar, House properties are the most common (78.9%), reflecting the local real estate landscape.
- Houses represent a significant 78.9% portion, catering likely to families or larger groups.
Ribamar Airbnb Room Capacity Analysis (2026): Bedroom Distribution
Distribution of Listings by Number of Bedrooms
Room Capacity Insights for Ribamar
- The dominant room capacity in Ribamar is 5+ bedrooms listings, making up 36.8% of the market. This suggests a strong demand for properties suitable for families or small groups.
- Together, 5+ bedrooms and 3 bedrooms properties represent 57.9% of the active Airbnb listings in Ribamar, indicating a high concentration in these sizes.
- A significant 68.4% of listings offer 3+ bedrooms, catering to larger groups and families seeking more space in Ribamar.
Ribamar Vacation Rental Guest Capacity Trends (2026)
Distribution of Listings by Guest Capacity
Guest Capacity Insights for Ribamar
- The most common guest capacity trend in Ribamar vacation rentals is listings accommodating 8+ guests (47.4%). This suggests the primary traveler segment is likely larger groups.
- Properties designed for 8+ guests and 6 guests dominate the Ribamar STR market, accounting for 73.7% of listings.
- 73.7% of properties accommodate 6+ guests, serving the market segment for larger families or group travel in Ribamar.
- On average, properties in Ribamar are equipped to host 6.2 guests.
Ribamar Airbnb Booking Patterns (2026): Available vs. Booked Days
Available Days Distribution
Booked Days Distribution
Booking Pattern Insights for Ribamar
- The most common availability pattern in Ribamar falls within the 271-366 days range, representing 57.9% of listings. This suggests many properties have significant open periods on their calendars.
- Approximately 94.7% of listings show high availability (181+ days open annually), indicating potential for increased bookings or specific owner usage patterns.
- For booked days, the 31-90 days range is most frequent in Ribamar (36.8%), reflecting common guest stay durations or potential owner blocking patterns.
- A notable 10.5% of properties secure long booking periods (181+ days booked per year), highlighting successful long-term rental strategies or significant owner usage.
Ribamar Airbnb Minimum Stay Requirements Analysis
Distribution of Listings by Minimum Night Requirement
1 Night
1 listings
5.3% of total
2 Nights
2 listings
10.5% of total
4-6 Nights
7 listings
36.8% of total
7-29 Nights
4 listings
21.1% of total
30+ Nights
5 listings
26.3% of total
Key Insights
- The most prevalent minimum stay requirement in Ribamar is 4-6 Nights, adopted by 36.8% of listings. This highlights the market's preference for longer commitments.
- Very short stays (1-2 nights) are less common (15.8%), suggesting hosts prefer slightly longer bookings to optimize turnover.
- A significant segment (26.3%) caters to monthly stays (30+ nights) in Ribamar, pointing to opportunities in the extended-stay market.
Recommendations
- Align with the market by considering a 4-6 Nights minimum stay, as 36.8% of Ribamar hosts use this setting.
- If feasible, allowing 1-night stays, especially midweek or during low season, could capture last-minute bookings, as only 5.3% currently do.
- Explore offering discounts for stays of 30+ nights to attract the 26.3% of the market seeking extended stays.
- Adjust minimum nights based on seasonality – potentially shorter during low season and longer during peak demand periods in Ribamar.
Ribamar Airbnb Cancellation Policy Trends Analysis (2026)
Flexible
4 listings
21.1% of total
Moderate
1 listings
5.3% of total
Firm
10 listings
52.6% of total
Strict
4 listings
21.1% of total
Cancellation Policy Insights for Ribamar
- The prevailing Airbnb cancellation policy trend in Ribamar is Firm, used by 52.6% of listings.
- A majority (73.7%) of hosts in Ribamar utilize Firm or Strict policies, indicating a market where hosts prioritize booking security.
Recommendations for Hosts
- Consider adopting a Firm policy to align with the 52.6% market standard in Ribamar.
- Regularly review your cancellation policy against competitors and market demand shifts in Ribamar.
Ribamar STR Booking Lead Time Analysis (2026)
Average Booking Lead Time by Month
Booking Lead Time Insights for Ribamar
- The overall average booking lead time for vacation rentals in Ribamar is 74 days.
- Guests book furthest in advance for stays during April (average 156 days), likely coinciding with peak travel demand or local events.
- The shortest booking windows occur for stays in November (average 22 days), indicating more last-minute travel plans during this time.
- Seasonally, Spring (112 days avg.) sees the longest lead times, while Fall (62 days avg.) has the shortest, reflecting typical travel planning cycles.
Recommendations for Hosts
- Use the overall average lead time (74 days) as a baseline for your pricing and availability strategy in Ribamar.
- For April stays, consider implementing length-of-stay discounts or slightly higher rates for bookings made less than 156 days out to capitalize on advance planning.
- Target marketing efforts for the Spring season well in advance (at least 112 days) to capture early planners.
- Monitor your own booking lead times against these Ribamar averages to identify opportunities for dynamic pricing adjustments.
Popular & Essential Airbnb Amenities in Ribamar (2026)
Amenity Prevalence
Amenity Insights for Ribamar
- Essential amenities in Ribamar that guests expect include: Wifi, TV. Lacking these (any) could significantly impact bookings.
- Popular amenities like Kitchen, Refrigerator, Essentials are common but not universal. Offering these can provide a competitive edge.
Recommendations for Hosts
- Ensure your listing includes all essential amenities for Ribamar: Wifi, TV.
- Consider adding popular differentiators like Kitchen or Refrigerator to increase appeal.
- Highlight unique or less common amenities you offer (e.g., hot tub, dedicated workspace, EV charger) in your listing description and photos.
- Regularly check competitor amenities in Ribamar to stay competitive.
Ribamar Airbnb Guest Demographics & Profile Analysis (2026)
Guest Profile Summary for Ribamar
- The typical guest profile for Airbnb in Ribamar consists of predominantly international visitors (93%), with top international origins including United States, typically belonging to the Post-2000s (Gen Z/Alpha) group (50%), primarily speaking English or German.
- Domestic travelers account for 7.5% of guests.
- Key international markets include United Kingdom (27.5%) and United States (12.5%).
- Top languages spoken are English (50%) followed by German (14.7%).
- A significant demographic segment is the Post-2000s (Gen Z/Alpha) group, representing 50% of guests.
Recommendations for Hosts
- Focus marketing internationally, particularly towards travelers from United States.
- Tailor amenities and listing descriptions to appeal to the dominant Post-2000s (Gen Z/Alpha) demographic (e.g., highlight fast WiFi, smart home features, local guides).
- Highlight unique local experiences or amenities relevant to the primary guest profile.
- Consider seasonal promotions aligned with peak travel times for key origin markets.
Nearby Short-Term Rental Market Comparison
How does the Ribamar Airbnb market stack up against its neighbors? Compare key performance metrics like average monthly revenue, ADR, and occupancy rates in surrounding areas to understand the broader regional STR landscape.
| Market | Active Properties | Monthly Revenue | Daily Rate | Avg. Occupancy |
|---|---|---|---|---|
| Comporta | 111 | $3,719 | $422.92 | 41% |
| Alcácer do Sal | 19 | $3,194 | $386.92 | 32% |
| Ferreira do Alentejo | 13 | $3,006 | $280.31 | 39% |
| Reguengo Grande | 13 | $2,843 | $319.66 | 40% |
| Grândola | 333 | $2,617 | $425.67 | 34% |
| Lisbon | 13,033 | $2,355 | $163.58 | 54% |
| Cascais | 1,613 | $2,314 | $217.29 | 47% |
| Colares | 13 | $2,156 | $321.52 | 40% |
| Seixal | 214 | $2,117 | $207.58 | 42% |
| Santa Bárbara | 24 | $2,115 | $273.89 | 38% |