Oeiras Airbnb Market Analysis 2026: Short Term Rental Data & Vacation Rental Statistics in Lisbon, Portugal
Is Airbnb profitable in Oeiras in 2026? Explore comprehensive Airbnb analytics for Oeiras, Lisbon, Portugal to uncover income potential. This 2026 STR market report for Oeiras, based on AirROI data from February 2025 to January 2026, reveals key trends in the market of 332 active listings.
Whether you're considering an Airbnb investment in Oeiras, optimizing your existing vacation rental, or exploring rental arbitrage opportunities, understanding the Oeiras Airbnb data is crucial. Navigating the high regulation landscape is key to maximizing your short term rental income potential. Let's dive into the specifics.
Key Oeiras Airbnb Performance Metrics Overview
Monthly Airbnb Revenue Variations & Income Potential in Oeiras (2026)
Understanding the monthly revenue variations for Airbnb listings in Oeiras is key to maximizing your short term rental income potential. Seasonality significantly impacts earnings. Our analysis, based on data from the past 12 months, shows that the peak revenue month for STRs in Oeiras is typically August, while January often presents the lowest earnings, highlighting opportunities for strategic pricing adjustments during shoulder and low seasons. Explore the typical Airbnb income in Oeiras across different performance tiers:
- Best-in-class properties (Top 10%) achieve $4,863+ monthly, often utilizing dynamic pricing and superior guest experiences.
- Strong performing properties (Top 25%) earn $3,116 or more, indicating effective management and desirable locations/amenities.
- Typical properties (Median) generate around $1,887 per month, representing the average market performance.
- Entry-level properties (Bottom 25%) see earnings around $911, often with potential for optimization.
Average Monthly Airbnb Earnings Trend in Oeiras
Oeiras Airbnb Occupancy Rate Trends (2026)
Maximize your bookings by understanding the Oeiras STR occupancy trends. Seasonal demand shifts significantly influence how often properties are booked. Typically, Augustsees the highest demand (peak season occupancy), while January experiences the lowest (low season). Effective strategies, like adjusting minimum stays or offering promotions, can boost occupancy during slower periods. Here's how different property tiers perform in Oeiras:
- Best-in-class properties (Top 10%) achieve 87%+ occupancy, indicating high desirability and potentially optimized availability.
- Strong performing properties (Top 25%) maintain 75% or higher occupancy, suggesting good market fit and guest satisfaction.
- Typical properties (Median) have an occupancy rate around 56%.
- Entry-level properties (Bottom 25%) average 32% occupancy, potentially facing higher vacancy.
Average Monthly Occupancy Rate Trend in Oeiras
Average Daily Rate (ADR) Airbnb Trends in Oeiras (2026)
Effective short term rental pricing strategy in Oeiras involves understanding monthly ADR fluctuations. The Average Daily Rate (ADR) for Airbnb in Oeiras typically peaks in September and dips lowest during February. Leveraging Airbnb dynamic pricing tools or strategies based on this seasonality can significantly boost revenue. Here's a look at the typical nightly rates achieved:
- Best-in-class properties (Top 10%) command rates of $269+ per night, often due to premium features or locations.
- Strong performing properties (Top 25%) achieve nightly rates of $168 or more.
- Typical properties (Median) charge around $113 per night.
- Entry-level properties (Bottom 25%) earn around $77 per night.
Average Daily Rate (ADR) Trend by Month in Oeiras
Get Live Oeiras Market Intelligence 👇

Explore Real-time Analytics
Airbnb Seasonality Analysis & Trends in Oeiras (2026)
Peak Season (August, July, September)
- Revenue averages $3,545 per month
- Occupancy rates average 62.1%
- Daily rates average $167
Shoulder Season
- Revenue averages $2,405 per month
- Occupancy maintains around 53.1%
- Daily rates hold near $149
Low Season (January, February, March)
- Revenue drops to average $1,534 per month
- Occupancy decreases to average 43.3%
- Daily rates adjust to average $133
Seasonality Insights for Oeiras
- The Airbnb seasonality in Oeiras shows highly seasonal trends requiring careful strategy. While the sections above show seasonal averages, it's also insightful to look at the extremes:
- During the high season, the absolute peak month showcases Oeiras's highest earning potential, with monthly revenues capable of climbing to $3,855, occupancy reaching a high of 64.3%, and ADRs peaking at $170.
- Conversely, the slowest single month of the year, typically falling within the low season, marks the market's lowest point. In this month, revenue might dip to $1,350, occupancy could drop to 30.6%, and ADRs may adjust down to $125.
- Understanding both the seasonal averages and these monthly peaks and troughs in revenue, occupancy, and ADR is crucial for maximizing your Airbnb profit potential in Oeiras.
Seasonal Strategies for Maximizing Profit
- Peak Season: Maximize revenue through premium pricing and potentially longer minimum stays. Ensure high availability.
- Low Season: Offer competitive pricing, special promotions (e.g., extended stay discounts), and flexible cancellation policies. Target off-season travelers like remote workers or budget-conscious guests.
- Shoulder Seasons: Implement dynamic pricing that balances peak and low rates. Target weekend travelers or specific events. Offer slightly more flexible terms than peak season.
- Regularly analyze your own performance against these Oeiras seasonality benchmarks and adjust your pricing and availability strategy accordingly.
Best Areas for Airbnb Investment in Oeiras (2026)
Exploring the top neighborhoods for short-term rentals in Oeiras? This section highlights key areas, outlining why they are attractive for hosts and guests, along with notable local attractions. Consider these locations based on your target guest profile and investment strategy.
| Neighborhood / Area | Why Host Here? (Target Guests & Appeal) | Key Attractions & Landmarks |
|---|---|---|
| Caxias | A charming coastal area known for its beautiful beaches and proximity to Lisbon. Ideal for both short and long-term stays, attracting beach lovers and tourists seeking relaxation. | Praia de Caxias, Centro Cultural de Belém, Jardim Marques de Pombal, Palácio dos Anjos |
| Oeiras Parque | A vibrant area known for its shopping and dining options, popular with locals and tourists alike. Great for those looking to experience local culture and cuisine. | Oeiras Parque Shopping Mall, Parque dos Poetas, Museu da Pólvora, Restaurants and cafes |
| Algés | A waterfront area with a mix of residential and commercial spaces, offering access to the Tagus River and various recreational activities. Attractive to families and vacationers alike. | Praia de Algés, Passeio Marítimo de Algés, Jardim da Praça 1º de Maio, Local restaurants and cafes |
| Paço de Arcos | Rich in history and charm, this area offers scenic river views and a relaxed atmosphere. It's ideal for visitors wanting a peaceful stay close to Lisbon. | Praia de Paço de Arcos, Castelo de Paço de Arcos, Local traditional restaurants, Largo da Igreja |
| Tercena | A suburban area offering a mix of nature and convenience, appealing to those looking to enjoy the tranquility away from the city, while still being close to Lisbon. | Parque Natural de Sintra-Cascais, Local nature trails, Cafes and small shops |
| São Julião da Barra | Famous for its historic fort and beautiful coastline, this area is attractive to history buffs and beach enthusiasts alike, making it a perfect Airbnb location. | Fortaleza de São Julião da Barra, Beaches, Waterfront promenades, Local fish restaurants |
| Carnaxide | A residential neighborhood with good connectivity to Lisbon, ideal for families and business travelers seeking affordable accommodations near the capital. | Local parks, Shopping centers, Good transport links to Lisbon |
| Linda-a-Velha | An up-and-coming area known for its modern amenities and proximity to the river, it appeals to those looking for a mix of urban life and nature. | Shopping centers, Parques e jardins, Cultural events |
Understanding Airbnb License Requirements & STR Laws in Oeiras (2026)
Yes, Oeiras, Lisbon, Portugal enforces high STR regulations. Obtaining a license and ensuring compliance is almost certainly required according to current 2026 STR laws. Always verify the latest short term rental regulations and Airbnb license requirements directly with local government authorities for Oeiras to ensure full compliance before hosting.
(Source: AirROI data, 2026, based on 87% licensed listings)
Top Performing Airbnb Properties in Oeiras (2026)
Benchmark your potential! Explore examples of top-performing Airbnb properties in Oeirasbased on Trailing Twelve Month (TTM) revenue. Analyze their characteristics, revenue, occupancy rate, and ADR to understand what drives success in this market.
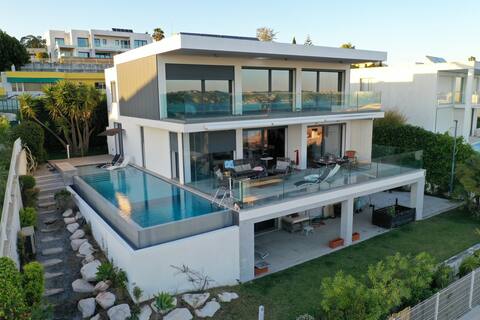
Modern Villa with Sea & River View Pool and Gym.
Entire Place • 3 bedrooms
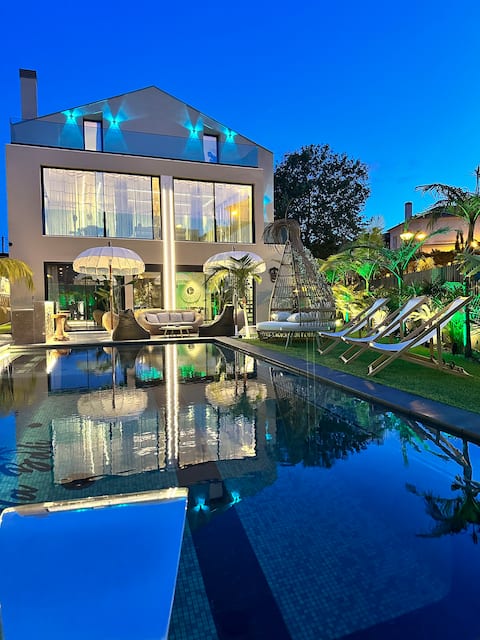
Retreat Villa (MiniGolf, Hot tub, BBQ) max 38 pp
Entire Place • 10 bedrooms
Villa w/ MiniGolf, Hot Tub, up to 28 ppl
Entire Place • 9 bedrooms
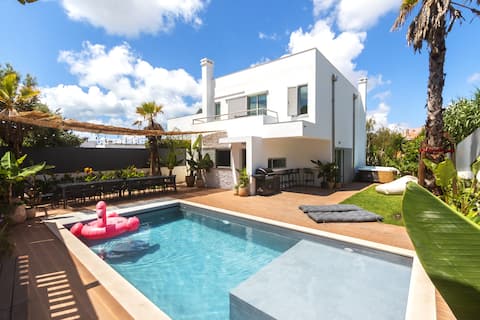
Villa Bali Lisbon
Entire Place • 5 bedrooms

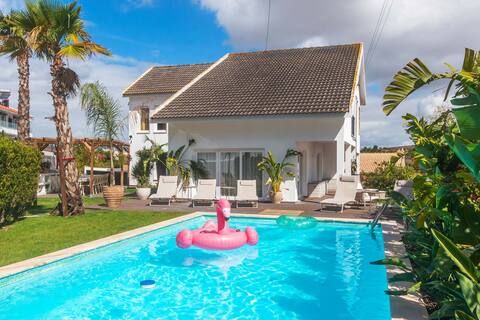
Palm Tree Villa
Entire Place • 4 bedrooms

GuestReady - Conde das Acáçovas 1E (Conde das Acáçovas 1E)
Entire Place • 1 bedroom
Note: Performance varies based on location, size, amenities, seasonality, and management quality. Data reflects the past 12 months.
Top Performing Airbnb Hosts in Oeiras (2026)
Learn from the best! This table showcases top-performing Airbnb hosts in Oeiras based on the number of properties managed and estimated total revenue over the past year. Analyze their scale and performance metrics.
| Host Name | Properties | Grossing Revenue | Stay Reviews | Avg Rating |
|---|---|---|---|---|
| GuestReady | 5 | $395,537 | 299 | 4.49/5.0 |
| Edra Retreats | 2 | $339,070 | 116 | 4.87/5.0 |
| LuxuryVilla’s | 2 | $260,640 | 540 | 4.87/5.0 |
| Albano | 1 | $190,789 | 28 | 5.00/5.0 |
| BnBird Homes Lda | 4 | $169,439 | 141 | 4.65/5.0 |
| Anthony | 4 | $152,326 | 127 | 4.89/5.0 |
| Carlos | 4 | $122,220 | 447 | 4.96/5.0 |
| Andrea | 4 | $109,664 | 178 | 4.57/5.0 |
| Maria | 2 | $104,238 | 211 | 4.84/5.0 |
| Pedro | 3 | $97,953 | 119 | 4.80/5.0 |
Analyzing the strategies of top hosts, such as their property selection, pricing, and guest communication, can offer valuable lessons for optimizing your own Airbnb operations in Oeiras.
Dive Deeper: Advanced Oeiras STR Market Data (2026)
Ready to unlock more insights? AirROI provides access to advanced metrics and comprehensive Airbnb data for Oeiras. Explore detailed analytics beyond this report to refine your investment strategy, optimize pricing, and maximize your vacation rental profits.
Explore Advanced MetricsOeiras Short-Term Rental Market Composition (2026): Property & Room Types
Room Type Distribution
Property Type Distribution
Market Composition Insights for Oeiras
- The Oeiras Airbnb market composition is heavily skewed towards Entire Home/Apt listings, which make up 75.9% of the 332 active rentals. This indicates strong guest preference for privacy and space.
- Looking at the property type distribution in Oeiras, Apartment/Condo properties are the most common (77.1%), reflecting the local real estate landscape.
- Houses represent a significant 17.8% portion, catering likely to families or larger groups.
- Smaller segments like hotel/boutique, others, outdoor/unique (combined 5.1%) offer potential for unique stay experiences.
Oeiras Airbnb Room Capacity Analysis (2026): Bedroom Distribution
Distribution of Listings by Number of Bedrooms
Room Capacity Insights for Oeiras
- The dominant room capacity in Oeiras is 1 bedroom listings, making up 29.8% of the market. This suggests a strong demand for properties suitable for couples or solo travelers.
- Together, 1 bedroom and 2 bedrooms properties represent 58.1% of the active Airbnb listings in Oeiras, indicating a high concentration in these sizes.
Oeiras Vacation Rental Guest Capacity Trends (2026)
Distribution of Listings by Guest Capacity
Guest Capacity Insights for Oeiras
- The most common guest capacity trend in Oeiras vacation rentals is listings accommodating 4 guests (27.7%). This suggests the primary traveler segment is likely small families or groups.
- Properties designed for 4 guests and 2 guests dominate the Oeiras STR market, accounting for 47.3% of listings.
- 22.3% of properties accommodate 6+ guests, serving the market segment for larger families or group travel in Oeiras.
- On average, properties in Oeiras are equipped to host 3.4 guests.
Oeiras Airbnb Booking Patterns (2026): Available vs. Booked Days
Available Days Distribution
Booked Days Distribution
Booking Pattern Insights for Oeiras
- The most common availability pattern in Oeiras falls within the 271-366 days range, representing 31.6% of listings. This suggests many properties have significant open periods on their calendars.
- Approximately 61.7% of listings show high availability (181+ days open annually), indicating potential for increased bookings or specific owner usage patterns.
- For booked days, the 181-270 days range is most frequent in Oeiras (31.3%), reflecting common guest stay durations or potential owner blocking patterns.
- A notable 39.4% of properties secure long booking periods (181+ days booked per year), highlighting successful long-term rental strategies or significant owner usage.
Oeiras Airbnb Minimum Stay Requirements Analysis
Distribution of Listings by Minimum Night Requirement
1 Night
55 listings
16.6% of total
2 Nights
49 listings
14.8% of total
3 Nights
51 listings
15.4% of total
4-6 Nights
36 listings
10.8% of total
7-29 Nights
17 listings
5.1% of total
30+ Nights
124 listings
37.3% of total
Key Insights
- The most prevalent minimum stay requirement in Oeiras is 30+ Nights, adopted by 37.3% of listings. This highlights the market's preference for longer commitments.
- A significant segment (37.3%) caters to monthly stays (30+ nights) in Oeiras, pointing to opportunities in the extended-stay market.
Recommendations
- Align with the market by considering a 30+ Nights minimum stay, as 37.3% of Oeiras hosts use this setting.
- If feasible, allowing 1-night stays, especially midweek or during low season, could capture last-minute bookings, as only 16.6% currently do.
- Explore offering discounts for stays of 30+ nights to attract the 37.3% of the market seeking extended stays.
- Adjust minimum nights based on seasonality – potentially shorter during low season and longer during peak demand periods in Oeiras.
Oeiras Airbnb Cancellation Policy Trends Analysis (2026)
Limited
10 listings
3% of total
Super Strict 60 Days
2 listings
0.6% of total
Super Strict 30 Days
6 listings
1.8% of total
Flexible
54 listings
16.3% of total
Moderate
112 listings
33.8% of total
Firm
97 listings
29.3% of total
Strict
50 listings
15.1% of total
Cancellation Policy Insights for Oeiras
- The prevailing Airbnb cancellation policy trend in Oeiras is Moderate, used by 33.8% of listings.
- There's a relatively balanced mix between guest-friendly (50.1%) and stricter (44.4%) policies, offering choices for different guest needs.
Recommendations for Hosts
- Consider adopting a Moderate policy to align with the 33.8% market standard in Oeiras.
- Regularly review your cancellation policy against competitors and market demand shifts in Oeiras.
Oeiras STR Booking Lead Time Analysis (2026)
Average Booking Lead Time by Month
Booking Lead Time Insights for Oeiras
- The overall average booking lead time for vacation rentals in Oeiras is 53 days.
- Guests book furthest in advance for stays during July (average 77 days), likely coinciding with peak travel demand or local events.
- The shortest booking windows occur for stays in February (average 28 days), indicating more last-minute travel plans during this time.
- Seasonally, Summer (74 days avg.) sees the longest lead times, while Winter (34 days avg.) has the shortest, reflecting typical travel planning cycles.
Recommendations for Hosts
- Use the overall average lead time (53 days) as a baseline for your pricing and availability strategy in Oeiras.
- For July stays, consider implementing length-of-stay discounts or slightly higher rates for bookings made less than 77 days out to capitalize on advance planning.
- Target marketing efforts for the Summer season well in advance (at least 74 days) to capture early planners.
- Monitor your own booking lead times against these Oeiras averages to identify opportunities for dynamic pricing adjustments.
Popular & Essential Airbnb Amenities in Oeiras (2026)
Amenity Prevalence
Amenity Insights for Oeiras
- Essential amenities in Oeiras that guests expect include: Wifi. Lacking these (this) could significantly impact bookings.
- Popular amenities like Kitchen, Hot water, Refrigerator are common but not universal. Offering these can provide a competitive edge.
Recommendations for Hosts
- Ensure your listing includes all essential amenities for Oeiras: Wifi.
- Prioritize adding missing essentials: Wifi.
- Consider adding popular differentiators like Kitchen or Hot water to increase appeal.
- Highlight unique or less common amenities you offer (e.g., hot tub, dedicated workspace, EV charger) in your listing description and photos.
- Regularly check competitor amenities in Oeiras to stay competitive.
Oeiras Airbnb Guest Demographics & Profile Analysis (2026)
Guest Profile Summary for Oeiras
- The typical guest profile for Airbnb in Oeiras consists of predominantly international visitors (92%), with top international origins including United Kingdom, typically belonging to the Post-2000s (Gen Z/Alpha) group (50%), primarily speaking English or Spanish.
- Domestic travelers account for 8.0% of guests.
- Key international markets include United States (14.8%) and United Kingdom (12.4%).
- Top languages spoken are English (38.7%) followed by Spanish (13.6%).
- A significant demographic segment is the Post-2000s (Gen Z/Alpha) group, representing 50% of guests.
Recommendations for Hosts
- Focus marketing internationally, particularly towards travelers from United Kingdom.
- Tailor amenities and listing descriptions to appeal to the dominant Post-2000s (Gen Z/Alpha) demographic (e.g., highlight fast WiFi, smart home features, local guides).
- Highlight unique local experiences or amenities relevant to the primary guest profile.
- Consider seasonal promotions aligned with peak travel times for key origin markets.
Nearby Short-Term Rental Market Comparison
How does the Oeiras Airbnb market stack up against its neighbors? Compare key performance metrics like average monthly revenue, ADR, and occupancy rates in surrounding areas to understand the broader regional STR landscape.
| Market | Active Properties | Monthly Revenue | Daily Rate | Avg. Occupancy |
|---|---|---|---|---|
| Comporta | 111 | $3,719 | $422.92 | 41% |
| Vale da Telha | 12 | $3,225 | $355.35 | 50% |
| Alcácer do Sal | 19 | $3,194 | $386.92 | 32% |
| Guia | 35 | $3,127 | $514.12 | 47% |
| Ferreira do Alentejo | 13 | $3,006 | $280.31 | 39% |
| Albufeira | 5,117 | $2,938 | $295.76 | 47% |
| Reguengo Grande | 13 | $2,843 | $319.66 | 40% |
| Lagoa e Carvoeiro | 1,055 | $2,735 | $258.75 | 50% |
| Olhos de Água | 31 | $2,685 | $326.36 | 49% |
| Grândola | 333 | $2,617 | $425.67 | 34% |