Carvalhal Airbnb Market Analysis 2026: Short Term Rental Data & Vacation Rental Statistics in Leiria, Portugal
Is Airbnb profitable in Carvalhal in 2026? Explore comprehensive Airbnb analytics for Carvalhal, Leiria, Portugal to uncover income potential. This 2026 STR market report for Carvalhal, based on AirROI data from February 2025 to January 2026, reveals key trends in the niche market of 26 active listings.
Whether you're considering an Airbnb investment in Carvalhal, optimizing your existing vacation rental, or exploring rental arbitrage opportunities, understanding the Carvalhal Airbnb data is crucial. Navigating the high regulation landscape is key to maximizing your short term rental income potential. Let's dive into the specifics.
Key Carvalhal Airbnb Performance Metrics Overview
Monthly Airbnb Revenue Variations & Income Potential in Carvalhal (2026)
Understanding the monthly revenue variations for Airbnb listings in Carvalhal is key to maximizing your short term rental income potential. Seasonality significantly impacts earnings. Our analysis, based on data from the past 12 months, shows that the peak revenue month for STRs in Carvalhal is typically August, while November often presents the lowest earnings, highlighting opportunities for strategic pricing adjustments during shoulder and low seasons. Explore the typical Airbnb income in Carvalhal across different performance tiers:
- Best-in-class properties (Top 10%) achieve $3,612+ monthly, often utilizing dynamic pricing and superior guest experiences.
- Strong performing properties (Top 25%) earn $2,422 or more, indicating effective management and desirable locations/amenities.
- Typical properties (Median) generate around $1,488 per month, representing the average market performance.
- Entry-level properties (Bottom 25%) see earnings around $550, often with potential for optimization.
Average Monthly Airbnb Earnings Trend in Carvalhal
Carvalhal Airbnb Occupancy Rate Trends (2026)
Maximize your bookings by understanding the Carvalhal STR occupancy trends. Seasonal demand shifts significantly influence how often properties are booked. Typically, Augustsees the highest demand (peak season occupancy), while January experiences the lowest (low season). Effective strategies, like adjusting minimum stays or offering promotions, can boost occupancy during slower periods. Here's how different property tiers perform in Carvalhal:
- Best-in-class properties (Top 10%) achieve 58%+ occupancy, indicating high desirability and potentially optimized availability.
- Strong performing properties (Top 25%) maintain 45% or higher occupancy, suggesting good market fit and guest satisfaction.
- Typical properties (Median) have an occupancy rate around 27%.
- Entry-level properties (Bottom 25%) average 12% occupancy, potentially facing higher vacancy.
Average Monthly Occupancy Rate Trend in Carvalhal
Average Daily Rate (ADR) Airbnb Trends in Carvalhal (2026)
Effective short term rental pricing strategy in Carvalhal involves understanding monthly ADR fluctuations. The Average Daily Rate (ADR) for Airbnb in Carvalhal typically peaks in August and dips lowest during February. Leveraging Airbnb dynamic pricing tools or strategies based on this seasonality can significantly boost revenue. Here's a look at the typical nightly rates achieved:
- Best-in-class properties (Top 10%) command rates of $334+ per night, often due to premium features or locations.
- Strong performing properties (Top 25%) achieve nightly rates of $229 or more.
- Typical properties (Median) charge around $144 per night.
- Entry-level properties (Bottom 25%) earn around $114 per night.
Average Daily Rate (ADR) Trend by Month in Carvalhal
Get Live Carvalhal Market Intelligence 👇

Explore Real-time Analytics
Airbnb Seasonality Analysis & Trends in Carvalhal (2026)
Peak Season (August, July, September)
- Revenue averages $3,432 per month
- Occupancy rates average 46.9%
- Daily rates average $202
Shoulder Season
- Revenue averages $1,364 per month
- Occupancy maintains around 27.4%
- Daily rates hold near $182
Low Season (January, March, November)
- Revenue drops to average $659 per month
- Occupancy decreases to average 17.2%
- Daily rates adjust to average $177
Seasonality Insights for Carvalhal
- The Airbnb seasonality in Carvalhal shows highly seasonal trends requiring careful strategy. While the sections above show seasonal averages, it's also insightful to look at the extremes:
- During the high season, the absolute peak month showcases Carvalhal's highest earning potential, with monthly revenues capable of climbing to $4,564, occupancy reaching a high of 55.6%, and ADRs peaking at $208.
- Conversely, the slowest single month of the year, typically falling within the low season, marks the market's lowest point. In this month, revenue might dip to $578, occupancy could drop to 9.4%, and ADRs may adjust down to $169.
- Understanding both the seasonal averages and these monthly peaks and troughs in revenue, occupancy, and ADR is crucial for maximizing your Airbnb profit potential in Carvalhal.
Seasonal Strategies for Maximizing Profit
- Peak Season: Maximize revenue through premium pricing and potentially longer minimum stays. Ensure high availability.
- Low Season: Offer competitive pricing, special promotions (e.g., extended stay discounts), and flexible cancellation policies. Target off-season travelers like remote workers or budget-conscious guests.
- Shoulder Seasons: Implement dynamic pricing that balances peak and low rates. Target weekend travelers or specific events. Offer slightly more flexible terms than peak season.
- Regularly analyze your own performance against these Carvalhal seasonality benchmarks and adjust your pricing and availability strategy accordingly.
Best Areas for Airbnb Investment in Carvalhal (2026)
Exploring the top neighborhoods for short-term rentals in Carvalhal? This section highlights key areas, outlining why they are attractive for hosts and guests, along with notable local attractions. Consider these locations based on your target guest profile and investment strategy.
| Neighborhood / Area | Why Host Here? (Target Guests & Appeal) | Key Attractions & Landmarks |
|---|---|---|
| Carvalhal Beach | A stunning beach area that attracts visitors year-round with its natural beauty and opportunities for water sports. Ideal for those looking for a relaxing getaway. | Carvalhal Beach, Surfing activities, Local seafood restaurants, Scenic walking trails, Natural parks nearby |
| Praia de Peralta | A beautiful beach known for its clear waters and tranquil environment. Perfect for families and tourists looking to unwind by the sea. | Praia de Peralta, Cliffside views, Snorkeling spots, Beachfront bars, Nature observation areas |
| Cascais dos Bichos | A serene area with proximity to both nature and beach. This area is gaining popularity for those wanting a balance of adventure and relaxation. | Wildlife observation, Coastal hiking trails, Access to surrounding villages, Scenic viewpoints, Local artisan shops |
| Centro de Carvalhal | The heart of Carvalhal with a mix of local culture, shops, and restaurants. A great spot for visitors wanting to experience local life. | Cafés and bakeries, Local art galleries, Cultural festivals, Historical landmarks, Community parks |
| Azenhas do Mar | A picturesque village perched on a cliff with stunning ocean views. A unique spot that attracts photographers and nature lovers. | Cliff-top views, Charming village streets, Nearby natural pools, Local fishing culture, Relaxing cafes overlooking the sea |
| Sangradouro | Known for its vibrant community and proximity to natural parks. Attracts hikers and outdoor enthusiasts looking for adventure. | Hiking trails, Nature reserves, Picnic spots, Birdwatching opportunities, Local markets |
| Praia do Magoito | A less crowded beach area that offers tranquility and beauty, perfect for visitors wanting to escape the more touristy spots. | Beautiful sandy beach, Coastal cliffs, Surfing and bodyboarding, Beachfront restaurants, Photography spots |
| Almoçageme | A charming village near the coastline, known for its hospitality and local experiences. Captivates visitors with its traditional Portuguese charm. | Local cuisine, Artisan shops, Cultural heritage sites, Access to beaches, Scenic drives nearby |
Understanding Airbnb License Requirements & STR Laws in Carvalhal (2026)
Yes, Carvalhal, Leiria, Portugal enforces high STR regulations. Obtaining a license and ensuring compliance is almost certainly required according to current 2026 STR laws. Always verify the latest short term rental regulations and Airbnb license requirements directly with local government authorities for Carvalhal to ensure full compliance before hosting.
(Source: AirROI data, 2026, based on 77% licensed listings)
Top Performing Airbnb Properties in Carvalhal (2026)
Benchmark your potential! Explore examples of top-performing Airbnb properties in Carvalhalbased on Trailing Twelve Month (TTM) revenue. Analyze their characteristics, revenue, occupancy rate, and ADR to understand what drives success in this market.
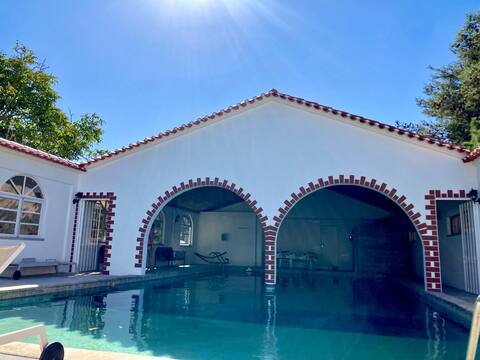
5 Bed Country Villa with Heated Pool near Óbidos
Entire Place • 5 bedrooms

Alma Country House - Private Pool & View
Entire Place • 5 bedrooms

Romantic luxury stone barn conversion with views
Entire Place • 1 bedroom

Pé no Campo Suites and Villa - Villa 5
Entire Place • 2 bedrooms
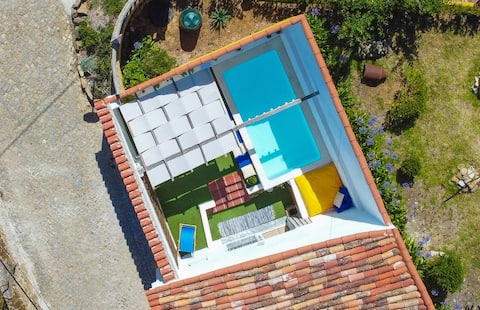
Casa São José
Entire Place • 1 bedroom

Barbonica House, private pool
Entire Place • 6 bedrooms
Note: Performance varies based on location, size, amenities, seasonality, and management quality. Data reflects the past 12 months.
Top Performing Airbnb Hosts in Carvalhal (2026)
Learn from the best! This table showcases top-performing Airbnb hosts in Carvalhal based on the number of properties managed and estimated total revenue over the past year. Analyze their scale and performance metrics.
| Host Name | Properties | Grossing Revenue | Stay Reviews | Avg Rating |
|---|---|---|---|---|
| Alexa | 1 | $40,686 | 8 | 4.88/5.0 |
| Rodrigo | 5 | $38,635 | 66 | 4.97/5.0 |
| Feathers Houses | 1 | $35,192 | 33 | 4.67/5.0 |
| Rich&SAM | 4 | $32,004 | 42 | 4.99/5.0 |
| José | 3 | $24,132 | 7 | 5.00/5.0 |
| We Stay Home Lda | 1 | $23,714 | 38 | 4.79/5.0 |
| Damien | 1 | $22,579 | 4 | 4.50/5.0 |
| Maria Da Conceição | 1 | $20,345 | 82 | 4.96/5.0 |
| Andrey | 1 | $19,896 | 41 | 4.95/5.0 |
| Roberto | 1 | $18,058 | 26 | 4.92/5.0 |
Analyzing the strategies of top hosts, such as their property selection, pricing, and guest communication, can offer valuable lessons for optimizing your own Airbnb operations in Carvalhal.
Dive Deeper: Advanced Carvalhal STR Market Data (2026)
Ready to unlock more insights? AirROI provides access to advanced metrics and comprehensive Airbnb data for Carvalhal. Explore detailed analytics beyond this report to refine your investment strategy, optimize pricing, and maximize your vacation rental profits.
Explore Advanced MetricsCarvalhal Short-Term Rental Market Composition (2026): Property & Room Types
Room Type Distribution
Property Type Distribution
Market Composition Insights for Carvalhal
- The Carvalhal Airbnb market composition is heavily skewed towards Entire Home/Apt listings, which make up 73.1% of the 26 active rentals. This indicates strong guest preference for privacy and space.
- Looking at the property type distribution in Carvalhal, House properties are the most common (69.2%), reflecting the local real estate landscape.
- Houses represent a significant 69.2% portion, catering likely to families or larger groups.
- Smaller segments like apartment/condo (combined 3.8%) offer potential for unique stay experiences.
Carvalhal Airbnb Room Capacity Analysis (2026): Bedroom Distribution
Distribution of Listings by Number of Bedrooms
Room Capacity Insights for Carvalhal
- The dominant room capacity in Carvalhal is 1 bedroom listings, making up 26.9% of the market. This suggests a strong demand for properties suitable for couples or solo travelers.
- Together, 1 bedroom and 2 bedrooms properties represent 46.1% of the active Airbnb listings in Carvalhal, indicating a high concentration in these sizes.
- A significant 38.5% of listings offer 3+ bedrooms, catering to larger groups and families seeking more space in Carvalhal.
Carvalhal Vacation Rental Guest Capacity Trends (2026)
Distribution of Listings by Guest Capacity
Guest Capacity Insights for Carvalhal
- The most common guest capacity trend in Carvalhal vacation rentals is listings accommodating 8+ guests (23.1%). This suggests the primary traveler segment is likely larger groups.
- Properties designed for 8+ guests and 6 guests dominate the Carvalhal STR market, accounting for 42.3% of listings.
- 42.3% of properties accommodate 6+ guests, serving the market segment for larger families or group travel in Carvalhal.
- On average, properties in Carvalhal are equipped to host 4.4 guests.
Carvalhal Airbnb Booking Patterns (2026): Available vs. Booked Days
Available Days Distribution
Booked Days Distribution
Booking Pattern Insights for Carvalhal
- The most common availability pattern in Carvalhal falls within the 271-366 days range, representing 69.2% of listings. This suggests many properties have significant open periods on their calendars.
- Approximately 96.1% of listings show high availability (181+ days open annually), indicating potential for increased bookings or specific owner usage patterns.
- For booked days, the 1-30 days range is most frequent in Carvalhal (38.5%), reflecting common guest stay durations or potential owner blocking patterns.
- A notable 3.8% of properties secure long booking periods (181+ days booked per year), highlighting successful long-term rental strategies or significant owner usage.
Carvalhal Airbnb Minimum Stay Requirements Analysis
Distribution of Listings by Minimum Night Requirement
1 Night
1 listings
3.8% of total
3 Nights
1 listings
3.8% of total
4-6 Nights
2 listings
7.7% of total
7-29 Nights
1 listings
3.8% of total
30+ Nights
21 listings
80.8% of total
Key Insights
- The most prevalent minimum stay requirement in Carvalhal is 30+ Nights, adopted by 80.8% of listings. This highlights the market's preference for longer commitments.
- Very short stays (1-2 nights) are less common (3.8%), suggesting hosts prefer slightly longer bookings to optimize turnover.
- A significant segment (80.8%) caters to monthly stays (30+ nights) in Carvalhal, pointing to opportunities in the extended-stay market.
Recommendations
- Align with the market by considering a 30+ Nights minimum stay, as 80.8% of Carvalhal hosts use this setting.
- If feasible, allowing 1-night stays, especially midweek or during low season, could capture last-minute bookings, as only 3.8% currently do.
- Explore offering discounts for stays of 30+ nights to attract the 80.8% of the market seeking extended stays.
- Adjust minimum nights based on seasonality – potentially shorter during low season and longer during peak demand periods in Carvalhal.
Carvalhal Airbnb Cancellation Policy Trends Analysis (2026)
Limited
1 listings
3.8% of total
Super Strict 60 Days
1 listings
3.8% of total
Flexible
2 listings
7.7% of total
Moderate
7 listings
26.9% of total
Firm
13 listings
50% of total
Strict
2 listings
7.7% of total
Cancellation Policy Insights for Carvalhal
- The prevailing Airbnb cancellation policy trend in Carvalhal is Firm, used by 50% of listings.
- A majority (57.7%) of hosts in Carvalhal utilize Firm or Strict policies, indicating a market where hosts prioritize booking security.
- Strict cancellation policies are quite rare (7.7%), potentially making listings with this policy less competitive unless justified by high demand or property type.
Recommendations for Hosts
- Consider adopting a Firm policy to align with the 50% market standard in Carvalhal.
- Using a Strict policy might deter some guests, as only 7.7% of listings use it. Evaluate if potential revenue protection outweighs possible lower booking rates.
- Regularly review your cancellation policy against competitors and market demand shifts in Carvalhal.
Carvalhal STR Booking Lead Time Analysis (2026)
Average Booking Lead Time by Month
Booking Lead Time Insights for Carvalhal
- The overall average booking lead time for vacation rentals in Carvalhal is 69 days.
- Guests book furthest in advance for stays during May (average 101 days), likely coinciding with peak travel demand or local events.
- The shortest booking windows occur for stays in February (average 11 days), indicating more last-minute travel plans during this time.
- Seasonally, Summer (63 days avg.) sees the longest lead times, while Winter (31 days avg.) has the shortest, reflecting typical travel planning cycles.
Recommendations for Hosts
- Use the overall average lead time (69 days) as a baseline for your pricing and availability strategy in Carvalhal.
- For May stays, consider implementing length-of-stay discounts or slightly higher rates for bookings made less than 101 days out to capitalize on advance planning.
- During February, focus on last-minute booking availability and promotions, as guests book with very short notice (11 days avg.).
- Target marketing efforts for the Summer season well in advance (at least 63 days) to capture early planners.
- Monitor your own booking lead times against these Carvalhal averages to identify opportunities for dynamic pricing adjustments.
Popular & Essential Airbnb Amenities in Carvalhal (2026)
Amenity Prevalence
Amenity Insights for Carvalhal
- Essential amenities in Carvalhal that guests expect include: Wifi, TV, Hot water. Lacking these (any) could significantly impact bookings.
- Popular amenities like Private entrance, Hangers, Fire extinguisher are common but not universal. Offering these can provide a competitive edge.
Recommendations for Hosts
- Ensure your listing includes all essential amenities for Carvalhal: Wifi, TV, Hot water.
- Prioritize adding missing essentials: Wifi, TV, Hot water.
- Consider adding popular differentiators like Private entrance or Hangers to increase appeal.
- Highlight unique or less common amenities you offer (e.g., hot tub, dedicated workspace, EV charger) in your listing description and photos.
- Regularly check competitor amenities in Carvalhal to stay competitive.
Carvalhal Airbnb Guest Demographics & Profile Analysis (2026)
Guest Profile Summary for Carvalhal
- The typical guest profile for Airbnb in Carvalhal consists of predominantly international visitors (68%), with top international origins including Germany, typically belonging to the Post-2000s (Gen Z/Alpha) group (50%), primarily speaking English or Spanish.
- Domestic travelers account for 32.5% of guests.
- Key international markets include Portugal (32.5%) and Germany (17.5%).
- Top languages spoken are English (38.3%) followed by Spanish (19.1%).
- A significant demographic segment is the Post-2000s (Gen Z/Alpha) group, representing 50% of guests.
Recommendations for Hosts
- Focus marketing internationally, particularly towards travelers from Germany.
- Tailor amenities and listing descriptions to appeal to the dominant Post-2000s (Gen Z/Alpha) demographic (e.g., highlight fast WiFi, smart home features, local guides).
- Highlight unique local experiences or amenities relevant to the primary guest profile.
- Consider seasonal promotions aligned with peak travel times for key origin markets.
Nearby Short-Term Rental Market Comparison
How does the Carvalhal Airbnb market stack up against its neighbors? Compare key performance metrics like average monthly revenue, ADR, and occupancy rates in surrounding areas to understand the broader regional STR landscape.
| Market | Active Properties | Monthly Revenue | Daily Rate | Avg. Occupancy |
|---|---|---|---|---|
| Comporta | 111 | $3,719 | $422.92 | 41% |
| Alcácer do Sal | 19 | $3,194 | $386.93 | 32% |
| Ferreira do Alentejo | 13 | $3,006 | $280.31 | 39% |
| Reguengo Grande | 13 | $2,843 | $319.66 | 40% |
| Grândola | 333 | $2,617 | $425.67 | 34% |
| Lisbon | 13,033 | $2,355 | $163.58 | 54% |
| Cascais | 1,613 | $2,314 | $217.29 | 47% |
| Ribamar | 19 | $2,267 | $265.61 | 40% |
| Colares | 13 | $2,156 | $321.52 | 40% |
| Seixal | 214 | $2,117 | $207.58 | 42% |