Silves Airbnb Market Analysis 2026: Short Term Rental Data & Vacation Rental Statistics in Faro, Portugal
Is Airbnb profitable in Silves in 2026? Explore comprehensive Airbnb analytics for Silves, Faro, Portugal to uncover income potential. This 2026 STR market report for Silves, based on AirROI data from February 2025 to January 2026, reveals key trends in the niche market of 178 active listings.
Whether you're considering an Airbnb investment in Silves, optimizing your existing vacation rental, or exploring rental arbitrage opportunities, understanding the Silves Airbnb data is crucial. Navigating the high regulation landscape is key to maximizing your short term rental income potential. Let's dive into the specifics.
Key Silves Airbnb Performance Metrics Overview
Monthly Airbnb Revenue Variations & Income Potential in Silves (2026)
Understanding the monthly revenue variations for Airbnb listings in Silves is key to maximizing your short term rental income potential. Seasonality significantly impacts earnings. Our analysis, based on data from the past 12 months, shows that the peak revenue month for STRs in Silves is typically August, while January often presents the lowest earnings, highlighting opportunities for strategic pricing adjustments during shoulder and low seasons. Explore the typical Airbnb income in Silves across different performance tiers:
- Best-in-class properties (Top 10%) achieve $6,814+ monthly, often utilizing dynamic pricing and superior guest experiences.
- Strong performing properties (Top 25%) earn $3,913 or more, indicating effective management and desirable locations/amenities.
- Typical properties (Median) generate around $1,970 per month, representing the average market performance.
- Entry-level properties (Bottom 25%) see earnings around $1,014, often with potential for optimization.
Average Monthly Airbnb Earnings Trend in Silves
Silves Airbnb Occupancy Rate Trends (2026)
Maximize your bookings by understanding the Silves STR occupancy trends. Seasonal demand shifts significantly influence how often properties are booked. Typically, Augustsees the highest demand (peak season occupancy), while January experiences the lowest (low season). Effective strategies, like adjusting minimum stays or offering promotions, can boost occupancy during slower periods. Here's how different property tiers perform in Silves:
- Best-in-class properties (Top 10%) achieve 82%+ occupancy, indicating high desirability and potentially optimized availability.
- Strong performing properties (Top 25%) maintain 67% or higher occupancy, suggesting good market fit and guest satisfaction.
- Typical properties (Median) have an occupancy rate around 45%.
- Entry-level properties (Bottom 25%) average 24% occupancy, potentially facing higher vacancy.
Average Monthly Occupancy Rate Trend in Silves
Average Daily Rate (ADR) Airbnb Trends in Silves (2026)
Effective short term rental pricing strategy in Silves involves understanding monthly ADR fluctuations. The Average Daily Rate (ADR) for Airbnb in Silves typically peaks in August and dips lowest during February. Leveraging Airbnb dynamic pricing tools or strategies based on this seasonality can significantly boost revenue. Here's a look at the typical nightly rates achieved:
- Best-in-class properties (Top 10%) command rates of $457+ per night, often due to premium features or locations.
- Strong performing properties (Top 25%) achieve nightly rates of $299 or more.
- Typical properties (Median) charge around $150 per night.
- Entry-level properties (Bottom 25%) earn around $88 per night.
Average Daily Rate (ADR) Trend by Month in Silves
Get Live Silves Market Intelligence 👇

Explore Real-time Analytics
Airbnb Seasonality Analysis & Trends in Silves (2026)
Peak Season (August, July, September)
- Revenue averages $5,290 per month
- Occupancy rates average 64.3%
- Daily rates average $260
Shoulder Season
- Revenue averages $2,736 per month
- Occupancy maintains around 43.9%
- Daily rates hold near $216
Low Season (January, February, November)
- Revenue drops to average $1,459 per month
- Occupancy decreases to average 31.4%
- Daily rates adjust to average $207
Seasonality Insights for Silves
- The Airbnb seasonality in Silves shows highly seasonal trends requiring careful strategy. While the sections above show seasonal averages, it's also insightful to look at the extremes:
- During the high season, the absolute peak month showcases Silves's highest earning potential, with monthly revenues capable of climbing to $6,224, occupancy reaching a high of 73.3%, and ADRs peaking at $260.
- Conversely, the slowest single month of the year, typically falling within the low season, marks the market's lowest point. In this month, revenue might dip to $1,138, occupancy could drop to 19.9%, and ADRs may adjust down to $193.
- Understanding both the seasonal averages and these monthly peaks and troughs in revenue, occupancy, and ADR is crucial for maximizing your Airbnb profit potential in Silves.
Seasonal Strategies for Maximizing Profit
- Peak Season: Maximize revenue through premium pricing and potentially longer minimum stays. Ensure high availability.
- Low Season: Offer competitive pricing, special promotions (e.g., extended stay discounts), and flexible cancellation policies. Target off-season travelers like remote workers or budget-conscious guests.
- Shoulder Seasons: Implement dynamic pricing that balances peak and low rates. Target weekend travelers or specific events. Offer slightly more flexible terms than peak season.
- Regularly analyze your own performance against these Silves seasonality benchmarks and adjust your pricing and availability strategy accordingly.
Best Areas for Airbnb Investment in Silves (2026)
Exploring the top neighborhoods for short-term rentals in Silves? This section highlights key areas, outlining why they are attractive for hosts and guests, along with notable local attractions. Consider these locations based on your target guest profile and investment strategy.
| Neighborhood / Area | Why Host Here? (Target Guests & Appeal) | Key Attractions & Landmarks |
|---|---|---|
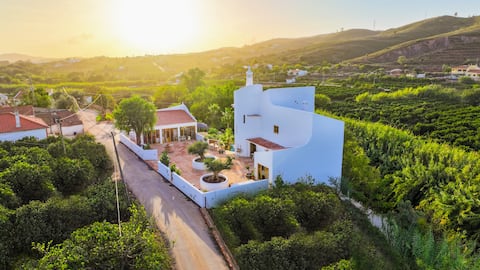
| Silves Castle Area | Historic center featuring the medieval Silves Castle, attracting tourists interested in history and architecture. Close to cafes and artisan shops, perfect for cultural tourism. | Silves Castle, Silves Cathedral, Museu Municipal de Silves, Paderne Castle, Old Town of Silves |
| Armação de Pêra | Popular beach destination known for its beautiful coastline and vibrant promenade. Families and beachgoers flock here, making it ideal for summer rentals. | Praia Grande, Praia dos Tremoços, Village Square, Centro de Armação de Pêra, local seafood restaurants |
| Algoz | Quaint village located inland, known for its traditional architecture and authentic Portuguese culture. Attractive to tourists seeking peace away from the busier coast. | Algoz's traditional market, Church of Nossa Senhora da Consolação, Rural trails |
| Livro de Ouro do Albufeira | An important cultural site in Silves, noted for its unique offerings. Draws visitors interested in culture and local folklore, providing a distinctive experience. | Cultural events, Traditional artisan shops, Café with local delicacies |
| Praia da Rocha | Famous for its stunning beaches and vibrant nightlife, makes for a hotspot for tourists and party-goers, suitable for short-term rentals year-round. | Praia da Rocha beach, Nightclubs and bars, Fortress of Santa Catarina, Marina Portimão |
| Portimão City Center | Urban center with a mix of history, shopping, and dining options. Ideal for business travelers and tourists who prefer urban experiences combined with leisure. | Museu de Portimão, Shopping mall, Restaurants and cafes, Riverside promenade |
| Albufeira | A bustling tourist hub known for its nightlife and numerous beaches. Attracts a young crowd looking for entertainment and activities, ideal for short-term rentals. | Old Town Albufeira, Beaches like Praia dos Pescadores, Clubs and bars, Albufeira Marina |
| Lagoa | Known for its vineyards and wine culture, appealing for tourists seeking wine tours and tastings. It combines nature with culinary tourism attractively. | Wine estates, Cacela Velha castle, Local wineries, Scenic viewpoints |
Understanding Airbnb License Requirements & STR Laws in Silves (2026)
Yes, Silves, Faro, Portugal enforces high STR regulations. Obtaining a license and ensuring compliance is almost certainly required according to current 2026 STR laws. Always verify the latest short term rental regulations and Airbnb license requirements directly with local government authorities for Silves to ensure full compliance before hosting.
(Source: AirROI data, 2026, based on 87% licensed listings)
Top Performing Airbnb Properties in Silves (2026)
Benchmark your potential! Explore examples of top-performing Airbnb properties in Silvesbased on Trailing Twelve Month (TTM) revenue. Analyze their characteristics, revenue, occupancy rate, and ADR to understand what drives success in this market.
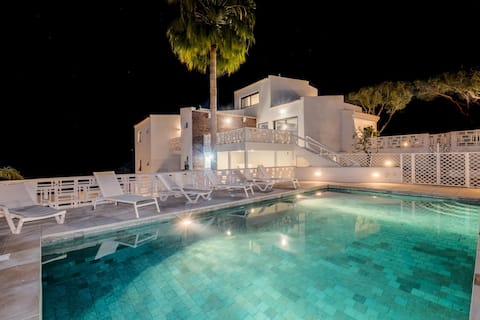
Groups, Retreats, Events, Jacuzzi, Sauna, Pool
Entire Place • 8 bedrooms
Belo Horizonte by Dreamplaces
Entire Place • 9 bedrooms

Vila Dria: Luxury in the best part of the Algarve
Entire Place • 5 bedrooms

Suites in luxury villa with pool and tennis court
Entire Place • 6 bedrooms
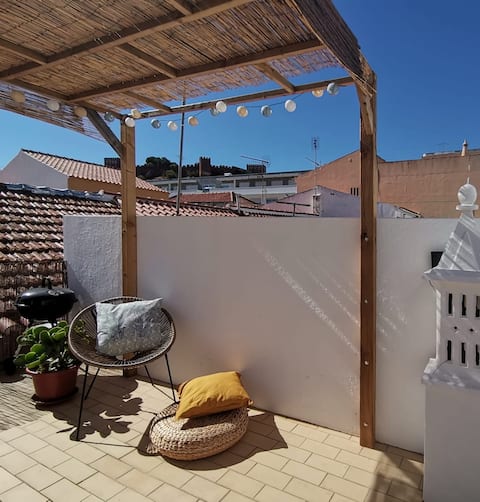
Algarve house, sun, patio, terrace and barbecue
Entire Place • 2 bedrooms

Casa Mourisca
Entire Place • 4 bedrooms
Note: Performance varies based on location, size, amenities, seasonality, and management quality. Data reflects the past 12 months.
Top Performing Airbnb Hosts in Silves (2026)
Learn from the best! This table showcases top-performing Airbnb hosts in Silves based on the number of properties managed and estimated total revenue over the past year. Analyze their scale and performance metrics.
| Host Name | Properties | Grossing Revenue | Stay Reviews | Avg Rating |
|---|---|---|---|---|
| Jeannette | 1 | $272,633 | 8 | 5.00/5.0 |
| Matthijs | 5 | $267,945 | 63 | 4.75/5.0 |
| Miguel | 3 | $194,389 | 151 | 4.96/5.0 |
| Sundayfind | 3 | $192,116 | 137 | 4.72/5.0 |
| Philippa And Paul | 2 | $163,142 | 114 | 4.98/5.0 |
| Dreamplaces Rentals Algarve | 1 | $138,239 | 38 | 4.45/5.0 |
| Carl & Karin | 1 | $129,943 | 61 | 4.98/5.0 |
| Alice | 3 | $118,507 | 35 | 5.00/5.0 |
| Alexandra | 3 | $110,649 | 92 | 4.76/5.0 |
| Marta | 1 | $98,357 | 95 | 4.99/5.0 |
Analyzing the strategies of top hosts, such as their property selection, pricing, and guest communication, can offer valuable lessons for optimizing your own Airbnb operations in Silves.
Dive Deeper: Advanced Silves STR Market Data (2026)
Ready to unlock more insights? AirROI provides access to advanced metrics and comprehensive Airbnb data for Silves. Explore detailed analytics beyond this report to refine your investment strategy, optimize pricing, and maximize your vacation rental profits.
Explore Advanced MetricsSilves Short-Term Rental Market Composition (2026): Property & Room Types
Room Type Distribution
Property Type Distribution
Market Composition Insights for Silves
- The Silves Airbnb market composition is heavily skewed towards Entire Home/Apt listings, which make up 88.8% of the 178 active rentals. This indicates strong guest preference for privacy and space.
- Looking at the property type distribution in Silves, House properties are the most common (69.7%), reflecting the local real estate landscape.
- Houses represent a significant 69.7% portion, catering likely to families or larger groups.
- The presence of 9.6% Hotel/Boutique listings indicates integration with traditional hospitality.
- Smaller segments like others, unique stays (combined 2.3%) offer potential for unique stay experiences.
Silves Airbnb Room Capacity Analysis (2026): Bedroom Distribution
Distribution of Listings by Number of Bedrooms
Room Capacity Insights for Silves
- The dominant room capacity in Silves is 1 bedroom listings, making up 30.9% of the market. This suggests a strong demand for properties suitable for couples or solo travelers.
- Together, 1 bedroom and 2 bedrooms properties represent 51.7% of the active Airbnb listings in Silves, indicating a high concentration in these sizes.
- A significant 42.7% of listings offer 3+ bedrooms, catering to larger groups and families seeking more space in Silves.
Silves Vacation Rental Guest Capacity Trends (2026)
Distribution of Listings by Guest Capacity
Guest Capacity Insights for Silves
- The most common guest capacity trend in Silves vacation rentals is listings accommodating 8+ guests (27%). This suggests the primary traveler segment is likely larger groups.
- Properties designed for 8+ guests and 2 guests dominate the Silves STR market, accounting for 49.5% of listings.
- 45.6% of properties accommodate 6+ guests, serving the market segment for larger families or group travel in Silves.
- On average, properties in Silves are equipped to host 4.8 guests.
Silves Airbnb Booking Patterns (2026): Available vs. Booked Days
Available Days Distribution
Booked Days Distribution
Booking Pattern Insights for Silves
- The most common availability pattern in Silves falls within the 271-366 days range, representing 42.7% of listings. This suggests many properties have significant open periods on their calendars.
- Approximately 77.5% of listings show high availability (181+ days open annually), indicating potential for increased bookings or specific owner usage patterns.
- For booked days, the 91-180 days range is most frequent in Silves (36%), reflecting common guest stay durations or potential owner blocking patterns.
- A notable 22.5% of properties secure long booking periods (181+ days booked per year), highlighting successful long-term rental strategies or significant owner usage.
Silves Airbnb Minimum Stay Requirements Analysis
Distribution of Listings by Minimum Night Requirement
1 Night
9 listings
5.1% of total
2 Nights
12 listings
6.7% of total
3 Nights
23 listings
12.9% of total
4-6 Nights
51 listings
28.7% of total
7-29 Nights
5 listings
2.8% of total
30+ Nights
78 listings
43.8% of total
Key Insights
- The most prevalent minimum stay requirement in Silves is 30+ Nights, adopted by 43.8% of listings. This highlights the market's preference for longer commitments.
- Very short stays (1-2 nights) are less common (11.8%), suggesting hosts prefer slightly longer bookings to optimize turnover.
- A significant segment (43.8%) caters to monthly stays (30+ nights) in Silves, pointing to opportunities in the extended-stay market.
Recommendations
- Align with the market by considering a 30+ Nights minimum stay, as 43.8% of Silves hosts use this setting.
- If feasible, allowing 1-night stays, especially midweek or during low season, could capture last-minute bookings, as only 5.1% currently do.
- Explore offering discounts for stays of 30+ nights to attract the 43.8% of the market seeking extended stays.
- Adjust minimum nights based on seasonality – potentially shorter during low season and longer during peak demand periods in Silves.
Silves Airbnb Cancellation Policy Trends Analysis (2026)
Super Strict 60 Days
4 listings
2.2% of total
Limited
3 listings
1.7% of total
Super Strict 30 Days
8 listings
4.5% of total
Flexible
26 listings
14.6% of total
Moderate
38 listings
21.3% of total
Firm
70 listings
39.3% of total
Strict
29 listings
16.3% of total
Cancellation Policy Insights for Silves
- The prevailing Airbnb cancellation policy trend in Silves is Firm, used by 39.3% of listings.
- A majority (55.6%) of hosts in Silves utilize Firm or Strict policies, indicating a market where hosts prioritize booking security.
Recommendations for Hosts
- Consider adopting a Firm policy to align with the 39.3% market standard in Silves.
- Regularly review your cancellation policy against competitors and market demand shifts in Silves.
Silves STR Booking Lead Time Analysis (2026)
Average Booking Lead Time by Month
Booking Lead Time Insights for Silves
- The overall average booking lead time for vacation rentals in Silves is 91 days.
- Guests book furthest in advance for stays during August (average 121 days), likely coinciding with peak travel demand or local events.
- The shortest booking windows occur for stays in January (average 40 days), indicating more last-minute travel plans during this time.
- Seasonally, Summer (110 days avg.) sees the longest lead times, while Winter (49 days avg.) has the shortest, reflecting typical travel planning cycles.
Recommendations for Hosts
- Use the overall average lead time (91 days) as a baseline for your pricing and availability strategy in Silves.
- For August stays, consider implementing length-of-stay discounts or slightly higher rates for bookings made less than 121 days out to capitalize on advance planning.
- Target marketing efforts for the Summer season well in advance (at least 110 days) to capture early planners.
- Monitor your own booking lead times against these Silves averages to identify opportunities for dynamic pricing adjustments.
Popular & Essential Airbnb Amenities in Silves (2026)
Amenity Prevalence
Amenity Insights for Silves
- Popular amenities like Kitchen, Wifi, TV are common but not universal. Offering these can provide a competitive edge.
- Warning: Wifi is not universally provided but is considered essential globally. Ensure reliable Wifi is offered.
Recommendations for Hosts
- Consider adding popular differentiators like Kitchen or Wifi to increase appeal.
- Highlight unique or less common amenities you offer (e.g., hot tub, dedicated workspace, EV charger) in your listing description and photos.
- Regularly check competitor amenities in Silves to stay competitive.
Silves Airbnb Guest Demographics & Profile Analysis (2026)
Guest Profile Summary for Silves
- The typical guest profile for Airbnb in Silves consists of predominantly international visitors (96%), with top international origins including France, typically belonging to the Post-2000s (Gen Z/Alpha) group (50%), primarily speaking English or French.
- Domestic travelers account for 3.8% of guests.
- Key international markets include United Kingdom (19.1%) and France (17.5%).
- Top languages spoken are English (40.1%) followed by French (16.3%).
- A significant demographic segment is the Post-2000s (Gen Z/Alpha) group, representing 50% of guests.
Recommendations for Hosts
- Focus marketing internationally, particularly towards travelers from France.
- Tailor amenities and listing descriptions to appeal to the dominant Post-2000s (Gen Z/Alpha) demographic (e.g., highlight fast WiFi, smart home features, local guides).
- Highlight unique local experiences or amenities relevant to the primary guest profile.
- Consider seasonal promotions aligned with peak travel times for key origin markets.
Nearby Short-Term Rental Market Comparison
How does the Silves Airbnb market stack up against its neighbors? Compare key performance metrics like average monthly revenue, ADR, and occupancy rates in surrounding areas to understand the broader regional STR landscape.
| Market | Active Properties | Monthly Revenue | Daily Rate | Avg. Occupancy |
|---|---|---|---|---|
| Comporta | 111 | $3,719 | $422.92 | 41% |
| Vale da Telha | 12 | $3,225 | $355.35 | 50% |
| Alcácer do Sal | 19 | $3,194 | $386.92 | 32% |
| Guia | 35 | $3,127 | $514.12 | 47% |
| Ferreira do Alentejo | 13 | $3,006 | $280.31 | 39% |
| Albufeira | 5,117 | $2,938 | $295.76 | 47% |
| Lagoa e Carvoeiro | 1,055 | $2,735 | $258.75 | 50% |
| Olhos de Água | 31 | $2,685 | $326.36 | 49% |
| Grândola | 333 | $2,617 | $425.67 | 34% |
| Ferragudo | 219 | $2,590 | $258.32 | 48% |