Tábua Airbnb Market Analysis 2026: Short Term Rental Data & Vacation Rental Statistics in Coimbra, Portugal
Is Airbnb profitable in Tábua in 2026? Explore comprehensive Airbnb analytics for Tábua, Coimbra, Portugal to uncover income potential. This 2026 STR market report for Tábua, based on AirROI data from February 2025 to January 2026, reveals key trends in the niche market of 83 active listings.
Whether you're considering an Airbnb investment in Tábua, optimizing your existing vacation rental, or exploring rental arbitrage opportunities, understanding the Tábua Airbnb data is crucial. Navigating the high regulation landscape is key to maximizing your short term rental income potential. Let's dive into the specifics.
Key Tábua Airbnb Performance Metrics Overview
Monthly Airbnb Revenue Variations & Income Potential in Tábua (2026)
Understanding the monthly revenue variations for Airbnb listings in Tábua is key to maximizing your short term rental income potential. Seasonality significantly impacts earnings. Our analysis, based on data from the past 12 months, shows that the peak revenue month for STRs in Tábua is typically August, while February often presents the lowest earnings, highlighting opportunities for strategic pricing adjustments during shoulder and low seasons. Explore the typical Airbnb income in Tábua across different performance tiers:
- Best-in-class properties (Top 10%) achieve $2,836+ monthly, often utilizing dynamic pricing and superior guest experiences.
- Strong performing properties (Top 25%) earn $1,630 or more, indicating effective management and desirable locations/amenities.
- Typical properties (Median) generate around $931 per month, representing the average market performance.
- Entry-level properties (Bottom 25%) see earnings around $465, often with potential for optimization.
Average Monthly Airbnb Earnings Trend in Tábua
Tábua Airbnb Occupancy Rate Trends (2026)
Maximize your bookings by understanding the Tábua STR occupancy trends. Seasonal demand shifts significantly influence how often properties are booked. Typically, Augustsees the highest demand (peak season occupancy), while January experiences the lowest (low season). Effective strategies, like adjusting minimum stays or offering promotions, can boost occupancy during slower periods. Here's how different property tiers perform in Tábua:
- Best-in-class properties (Top 10%) achieve 58%+ occupancy, indicating high desirability and potentially optimized availability.
- Strong performing properties (Top 25%) maintain 40% or higher occupancy, suggesting good market fit and guest satisfaction.
- Typical properties (Median) have an occupancy rate around 25%.
- Entry-level properties (Bottom 25%) average 14% occupancy, potentially facing higher vacancy.
Average Monthly Occupancy Rate Trend in Tábua
Average Daily Rate (ADR) Airbnb Trends in Tábua (2026)
Effective short term rental pricing strategy in Tábua involves understanding monthly ADR fluctuations. The Average Daily Rate (ADR) for Airbnb in Tábua typically peaks in July and dips lowest during March. Leveraging Airbnb dynamic pricing tools or strategies based on this seasonality can significantly boost revenue. Here's a look at the typical nightly rates achieved:
- Best-in-class properties (Top 10%) command rates of $229+ per night, often due to premium features or locations.
- Strong performing properties (Top 25%) achieve nightly rates of $155 or more.
- Typical properties (Median) charge around $112 per night.
- Entry-level properties (Bottom 25%) earn around $75 per night.
Average Daily Rate (ADR) Trend by Month in Tábua
Get Live Tábua Market Intelligence 👇

Explore Real-time Analytics
Airbnb Seasonality Analysis & Trends in Tábua (2026)
Peak Season (August, July, September)
- Revenue averages $2,613 per month
- Occupancy rates average 48.2%
- Daily rates average $147
Shoulder Season
- Revenue averages $1,269 per month
- Occupancy maintains around 25.1%
- Daily rates hold near $134
Low Season (February, November, December)
- Revenue drops to average $899 per month
- Occupancy decreases to average 20.5%
- Daily rates adjust to average $137
Seasonality Insights for Tábua
- The Airbnb seasonality in Tábua shows highly seasonal trends requiring careful strategy. While the sections above show seasonal averages, it's also insightful to look at the extremes:
- During the high season, the absolute peak month showcases Tábua's highest earning potential, with monthly revenues capable of climbing to $3,515, occupancy reaching a high of 64.4%, and ADRs peaking at $148.
- Conversely, the slowest single month of the year, typically falling within the low season, marks the market's lowest point. In this month, revenue might dip to $650, occupancy could drop to 15.3%, and ADRs may adjust down to $127.
- Understanding both the seasonal averages and these monthly peaks and troughs in revenue, occupancy, and ADR is crucial for maximizing your Airbnb profit potential in Tábua.
Seasonal Strategies for Maximizing Profit
- Peak Season: Maximize revenue through premium pricing and potentially longer minimum stays. Ensure high availability.
- Low Season: Offer competitive pricing, special promotions (e.g., extended stay discounts), and flexible cancellation policies. Target off-season travelers like remote workers or budget-conscious guests.
- Shoulder Seasons: Implement dynamic pricing that balances peak and low rates. Target weekend travelers or specific events. Offer slightly more flexible terms than peak season.
- Regularly analyze your own performance against these Tábua seasonality benchmarks and adjust your pricing and availability strategy accordingly.
Best Areas for Airbnb Investment in Tábua (2026)
Exploring the top neighborhoods for short-term rentals in Tábua? This section highlights key areas, outlining why they are attractive for hosts and guests, along with notable local attractions. Consider these locations based on your target guest profile and investment strategy.
| Neighborhood / Area | Why Host Here? (Target Guests & Appeal) | Key Attractions & Landmarks |
|---|---|---|
| Tábua City Center | The heart of Tábua, offering a mix of local shops, cafes, and cultural sites. It's ideal for visitors wanting to experience authentic Portuguese life and easy access to attractions. | Tábua Castle, Praça do Comércio, Chapel of São Miguel, Local markets, Pensão São Pedro |
| Serra do Açor | A beautiful natural area perfect for nature lovers and hikers. Offers stunning landscapes and outdoor activities, attracting tourists looking for adventure and tranquility. | Açor River, Cascata das Pombas, Natural Park trails, Local wildlife, Scenic viewpoints |
| Municipality of Tábua | Surrounding areas of Tábua offer rural tourism opportunities with traditional Portuguese living. Perfect for visitors interested in agrotourism and rural experiences. | Local farms, Traditional restaurants, Wine tasting tours, Village festivals, Nature walks |
| Gois | A charming town close to Tábua with rich history and stunning views. Ideal for visitors wanting to explore rural Portugal while being near to urban amenities. | Gois River, Historic architecture, Local artisan shops, Hiking trails, Nearby vineyards |
| Lousã | Known for its beautiful mountains and historical castles, Lousã offers outdoor adventures with cultural experiences. Great for families and adventure seekers. | Castle of Lousã, Roman ruins, Schist Villages, Forest parks, Coasteering activities |
| Celorico da Beira | A historic town with medieval charm. It offers a glimpse into local history and is ideal for guests interested in culture and heritage. | Celorico Castle, Local museums, Heritage architecture, Cultural events, Festivals |
| Penacova | Nestled along the river, Penacova is known for its natural beauty and historical sites. Attracts visitors seeking a peaceful retreat close to nature. | Penacova River Beach, Old mill sites, Cultural heritage, Hiking paths, Canopy Walk |
| Coimbra | One of the oldest universities in the world, Coimbra is a vibrant city full of history and student life. It offers a plethora of cultural attractions for tourists. | University of Coimbra, Joanina Library, Portugal dos Pequenitos, Old Cathedral of Coimbra, Botanical Garden |
Understanding Airbnb License Requirements & STR Laws in Tábua (2026)
Yes, Tábua, Coimbra, Portugal enforces high STR regulations. Obtaining a license and ensuring compliance is almost certainly required according to current 2026 STR laws. Always verify the latest short term rental regulations and Airbnb license requirements directly with local government authorities for Tábua to ensure full compliance before hosting.
(Source: AirROI data, 2026, based on 86% licensed listings)
Top Performing Airbnb Properties in Tábua (2026)
Benchmark your potential! Explore examples of top-performing Airbnb properties in Tábuabased on Trailing Twelve Month (TTM) revenue. Analyze their characteristics, revenue, occupancy rate, and ADR to understand what drives success in this market.
![Casa Grande de Loureiro [Loureiro's Big House]](https://a0.muscache.com/im/pictures/miso/Hosting-643885430173747308/original/17c028f9-de6b-4e71-b388-b884037610c9.jpeg?im_w=480&im_format=avif)
Casa Grande de Loureiro [Loureiro's Big House]
Entire Place • 12 bedrooms

Quinta da Alegria, Carapinha with a large pool
Entire Place • 7 bedrooms
5 bdrm villa, pool, river, BBQ 4 family & friends
Entire Place • 5 bedrooms

Serene 3 Bedroom cottage with river views
Entire Place • 3 bedrooms

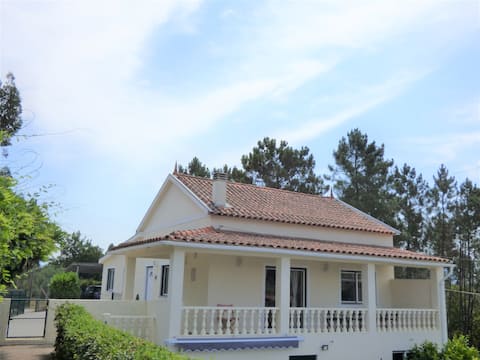
Fully private villa with pool, spa and jacuzzi
Entire Place • 1 bedroom
2 bedroom house in Mouronho with parking and pool.
Entire Place • 2 bedrooms
Note: Performance varies based on location, size, amenities, seasonality, and management quality. Data reflects the past 12 months.
Top Performing Airbnb Hosts in Tábua (2026)
Learn from the best! This table showcases top-performing Airbnb hosts in Tábua based on the number of properties managed and estimated total revenue over the past year. Analyze their scale and performance metrics.
| Host Name | Properties | Grossing Revenue | Stay Reviews | Avg Rating |
|---|---|---|---|---|
| Arjen | 20 | $194,224 | 57 | 4.89/5.0 |
| Alexandra | 1 | $151,809 | 23 | 4.96/5.0 |
| Sally | 5 | $81,074 | 169 | 4.94/5.0 |
| Elen | 1 | $60,894 | 85 | 4.89/5.0 |
| Matthew | 3 | $55,389 | 20 | 4.86/5.0 |
| Quinta Do Rabaçal | 1 | $39,123 | 14 | 5.00/5.0 |
| HostWise | 3 | $38,885 | 13 | 5.00/5.0 |
| Natalia | 1 | $34,515 | 53 | 4.81/5.0 |
| Joanne | 1 | $23,208 | 58 | 4.93/5.0 |
| Quinta Do Retiro Small Scale H | 4 | $21,378 | 37 | 4.92/5.0 |
Analyzing the strategies of top hosts, such as their property selection, pricing, and guest communication, can offer valuable lessons for optimizing your own Airbnb operations in Tábua.
Dive Deeper: Advanced Tábua STR Market Data (2026)
Ready to unlock more insights? AirROI provides access to advanced metrics and comprehensive Airbnb data for Tábua. Explore detailed analytics beyond this report to refine your investment strategy, optimize pricing, and maximize your vacation rental profits.
Explore Advanced MetricsTábua Short-Term Rental Market Composition (2026): Property & Room Types
Room Type Distribution
Property Type Distribution
Market Composition Insights for Tábua
- The Tábua Airbnb market composition is heavily skewed towards Entire Home/Apt listings, which make up 85.5% of the 83 active rentals. This indicates strong guest preference for privacy and space.
- Looking at the property type distribution in Tábua, House properties are the most common (44.6%), reflecting the local real estate landscape.
- Houses represent a significant 44.6% portion, catering likely to families or larger groups.
- The presence of 10.8% Hotel/Boutique listings indicates integration with traditional hospitality.
- Smaller segments like others (combined 4.8%) offer potential for unique stay experiences.
Tábua Airbnb Room Capacity Analysis (2026): Bedroom Distribution
Distribution of Listings by Number of Bedrooms
Room Capacity Insights for Tábua
- The dominant room capacity in Tábua is 1 bedroom listings, making up 32.5% of the market. This suggests a strong demand for properties suitable for couples or solo travelers.
- Together, 1 bedroom and 2 bedrooms properties represent 61.4% of the active Airbnb listings in Tábua, indicating a high concentration in these sizes.
- A significant 31.3% of listings offer 3+ bedrooms, catering to larger groups and families seeking more space in Tábua.
Tábua Vacation Rental Guest Capacity Trends (2026)
Distribution of Listings by Guest Capacity
Guest Capacity Insights for Tábua
- The most common guest capacity trend in Tábua vacation rentals is listings accommodating 6 guests (24.1%). This suggests the primary traveler segment is likely larger groups.
- Properties designed for 6 guests and 4 guests dominate the Tábua STR market, accounting for 44.6% of listings.
- 36.1% of properties accommodate 6+ guests, serving the market segment for larger families or group travel in Tábua.
- On average, properties in Tábua are equipped to host 4.4 guests.
Tábua Airbnb Booking Patterns (2026): Available vs. Booked Days
Available Days Distribution
Booked Days Distribution
Booking Pattern Insights for Tábua
- The most common availability pattern in Tábua falls within the 271-366 days range, representing 75.9% of listings. This suggests many properties have significant open periods on their calendars.
- Approximately 97.6% of listings show high availability (181+ days open annually), indicating potential for increased bookings or specific owner usage patterns.
- For booked days, the 31-90 days range is most frequent in Tábua (53%), reflecting common guest stay durations or potential owner blocking patterns.
- A notable 2.4% of properties secure long booking periods (181+ days booked per year), highlighting successful long-term rental strategies or significant owner usage.
Tábua Airbnb Minimum Stay Requirements Analysis
Distribution of Listings by Minimum Night Requirement
1 Night
29 listings
34.9% of total
2 Nights
21 listings
25.3% of total
3 Nights
6 listings
7.2% of total
4-6 Nights
6 listings
7.2% of total
7-29 Nights
3 listings
3.6% of total
30+ Nights
18 listings
21.7% of total
Key Insights
- The most prevalent minimum stay requirement in Tábua is 1 Night, adopted by 34.9% of listings. This highlights the market's preference for shorter, flexible bookings.
- A strong majority (60.2%) of the Tábua Airbnb data shows acceptance of very short stays (1-2 nights), indicating a dynamic, high-turnover market.
- A significant segment (21.7%) caters to monthly stays (30+ nights) in Tábua, pointing to opportunities in the extended-stay market.
Recommendations
- Align with the market by considering a 1 Night minimum stay, as 34.9% of Tábua hosts use this setting.
- Explore offering discounts for stays of 30+ nights to attract the 21.7% of the market seeking extended stays.
- Adjust minimum nights based on seasonality – potentially shorter during low season and longer during peak demand periods in Tábua.
Tábua Airbnb Cancellation Policy Trends Analysis (2026)
Super Strict 30 Days
20 listings
24.1% of total
Limited
3 listings
3.6% of total
Flexible
12 listings
14.5% of total
Moderate
10 listings
12% of total
Firm
27 listings
32.5% of total
Strict
11 listings
13.3% of total
Cancellation Policy Insights for Tábua
- The prevailing Airbnb cancellation policy trend in Tábua is Firm, used by 32.5% of listings.
- There's a relatively balanced mix between guest-friendly (26.5%) and stricter (45.8%) policies, offering choices for different guest needs.
Recommendations for Hosts
- Consider adopting a Firm policy to align with the 32.5% market standard in Tábua.
- Using a Strict policy might deter some guests, as only 13.3% of listings use it. Evaluate if potential revenue protection outweighs possible lower booking rates.
- Regularly review your cancellation policy against competitors and market demand shifts in Tábua.
Tábua STR Booking Lead Time Analysis (2026)
Average Booking Lead Time by Month
Booking Lead Time Insights for Tábua
- The overall average booking lead time for vacation rentals in Tábua is 57 days.
- Guests book furthest in advance for stays during December (average 116 days), likely coinciding with peak travel demand or local events.
- The shortest booking windows occur for stays in February (average 22 days), indicating more last-minute travel plans during this time.
- Seasonally, Winter (73 days avg.) sees the longest lead times, while Fall (41 days avg.) has the shortest, reflecting typical travel planning cycles.
Recommendations for Hosts
- Use the overall average lead time (57 days) as a baseline for your pricing and availability strategy in Tábua.
- For December stays, consider implementing length-of-stay discounts or slightly higher rates for bookings made less than 116 days out to capitalize on advance planning.
- Target marketing efforts for the Winter season well in advance (at least 73 days) to capture early planners.
- Monitor your own booking lead times against these Tábua averages to identify opportunities for dynamic pricing adjustments.
Popular & Essential Airbnb Amenities in Tábua (2026)
Amenity Prevalence
Amenity Insights for Tábua
- Essential amenities in Tábua that guests expect include: Wifi. Lacking these (this) could significantly impact bookings.
- Popular amenities like Free parking on premises, Essentials, Fire extinguisher are common but not universal. Offering these can provide a competitive edge.
- A pool is a highly desired but not standard amenity, making it a key feature for attracting guests seeking leisure in Tábua.
Recommendations for Hosts
- Ensure your listing includes all essential amenities for Tábua: Wifi.
- Prioritize adding missing essentials: Wifi.
- Consider adding popular differentiators like Free parking on premises or Essentials to increase appeal.
- Highlight unique or less common amenities you offer (e.g., hot tub, dedicated workspace, EV charger) in your listing description and photos.
- Regularly check competitor amenities in Tábua to stay competitive.
Tábua Airbnb Guest Demographics & Profile Analysis (2026)
Guest Profile Summary for Tábua
- The typical guest profile for Airbnb in Tábua consists of predominantly international visitors (75%), with top international origins including France, typically belonging to the Post-2000s (Gen Z/Alpha) group (50%), primarily speaking English or Spanish.
- Domestic travelers account for 25.5% of guests.
- Key international markets include Portugal (25.5%) and France (15.3%).
- Top languages spoken are English (36%) followed by Spanish (16%).
- A significant demographic segment is the Post-2000s (Gen Z/Alpha) group, representing 50% of guests.
Recommendations for Hosts
- Focus marketing internationally, particularly towards travelers from France.
- Tailor amenities and listing descriptions to appeal to the dominant Post-2000s (Gen Z/Alpha) demographic (e.g., highlight fast WiFi, smart home features, local guides).
- Highlight unique local experiences or amenities relevant to the primary guest profile.
- Consider seasonal promotions aligned with peak travel times for key origin markets.
Nearby Short-Term Rental Market Comparison
How does the Tábua Airbnb market stack up against its neighbors? Compare key performance metrics like average monthly revenue, ADR, and occupancy rates in surrounding areas to understand the broader regional STR landscape.
| Market | Active Properties | Monthly Revenue | Daily Rate | Avg. Occupancy |
|---|---|---|---|---|
| Penhalonga e Paços de Gaiolo | 23 | $4,304 | $357.04 | 40% |
| Sande e São Lourenço do Douro | 19 | $3,009 | $319.97 | 37% |
| Reguengo Grande | 13 | $2,843 | $319.66 | 40% |
| Armamar | 66 | $2,578 | $266.43 | 36% |
| Alpendorada, Várzea e Torrão | 19 | $2,503 | $264.40 | 35% |
| Vila Boa de Quires e Maureles | 10 | $2,316 | $202.63 | 48% |
| Ribamar | 19 | $2,267 | $265.61 | 40% |
| Santa Bárbara | 24 | $2,115 | $273.89 | 38% |
| Alijó | 69 | $2,072 | $250.65 | 30% |
| Cinfães | 16 | $2,059 | $253.86 | 28% |