Soure Airbnb Market Analysis 2026: Short Term Rental Data & Vacation Rental Statistics in Coimbra, Portugal
Is Airbnb profitable in Soure in 2026? Explore comprehensive Airbnb analytics for Soure, Coimbra, Portugal to uncover income potential. This 2026 STR market report for Soure, based on AirROI data from February 2025 to January 2026, reveals key trends in the niche market of 38 active listings.
Whether you're considering an Airbnb investment in Soure, optimizing your existing vacation rental, or exploring rental arbitrage opportunities, understanding the Soure Airbnb data is crucial. Navigating the high regulation landscape is key to maximizing your short term rental income potential. Let's dive into the specifics.
Key Soure Airbnb Performance Metrics Overview
Monthly Airbnb Revenue Variations & Income Potential in Soure (2026)
Understanding the monthly revenue variations for Airbnb listings in Soure is key to maximizing your short term rental income potential. Seasonality significantly impacts earnings. Our analysis, based on data from the past 12 months, shows that the peak revenue month for STRs in Soure is typically August, while January often presents the lowest earnings, highlighting opportunities for strategic pricing adjustments during shoulder and low seasons. Explore the typical Airbnb income in Soure across different performance tiers:
- Best-in-class properties (Top 10%) achieve $2,733+ monthly, often utilizing dynamic pricing and superior guest experiences.
- Strong performing properties (Top 25%) earn $1,538 or more, indicating effective management and desirable locations/amenities.
- Typical properties (Median) generate around $883 per month, representing the average market performance.
- Entry-level properties (Bottom 25%) see earnings around $418, often with potential for optimization.
Average Monthly Airbnb Earnings Trend in Soure
Soure Airbnb Occupancy Rate Trends (2026)
Maximize your bookings by understanding the Soure STR occupancy trends. Seasonal demand shifts significantly influence how often properties are booked. Typically, Augustsees the highest demand (peak season occupancy), while January experiences the lowest (low season). Effective strategies, like adjusting minimum stays or offering promotions, can boost occupancy during slower periods. Here's how different property tiers perform in Soure:
- Best-in-class properties (Top 10%) achieve 67%+ occupancy, indicating high desirability and potentially optimized availability.
- Strong performing properties (Top 25%) maintain 46% or higher occupancy, suggesting good market fit and guest satisfaction.
- Typical properties (Median) have an occupancy rate around 23%.
- Entry-level properties (Bottom 25%) average 12% occupancy, potentially facing higher vacancy.
Average Monthly Occupancy Rate Trend in Soure
Average Daily Rate (ADR) Airbnb Trends in Soure (2026)
Effective short term rental pricing strategy in Soure involves understanding monthly ADR fluctuations. The Average Daily Rate (ADR) for Airbnb in Soure typically peaks in July and dips lowest during January. Leveraging Airbnb dynamic pricing tools or strategies based on this seasonality can significantly boost revenue. Here's a look at the typical nightly rates achieved:
- Best-in-class properties (Top 10%) command rates of $208+ per night, often due to premium features or locations.
- Strong performing properties (Top 25%) achieve nightly rates of $162 or more.
- Typical properties (Median) charge around $108 per night.
- Entry-level properties (Bottom 25%) earn around $68 per night.
Average Daily Rate (ADR) Trend by Month in Soure
Get Live Soure Market Intelligence 👇

Explore Real-time Analytics
Airbnb Seasonality Analysis & Trends in Soure (2026)
Peak Season (August, July, September)
- Revenue averages $1,932 per month
- Occupancy rates average 44.6%
- Daily rates average $132
Shoulder Season
- Revenue averages $1,049 per month
- Occupancy maintains around 31.0%
- Daily rates hold near $123
Low Season (January, March, December)
- Revenue drops to average $601 per month
- Occupancy decreases to average 18.5%
- Daily rates adjust to average $119
Seasonality Insights for Soure
- The Airbnb seasonality in Soure shows highly seasonal trends requiring careful strategy. While the sections above show seasonal averages, it's also insightful to look at the extremes:
- During the high season, the absolute peak month showcases Soure's highest earning potential, with monthly revenues capable of climbing to $2,468, occupancy reaching a high of 47.8%, and ADRs peaking at $135.
- Conversely, the slowest single month of the year, typically falling within the low season, marks the market's lowest point. In this month, revenue might dip to $511, occupancy could drop to 14.2%, and ADRs may adjust down to $118.
- Understanding both the seasonal averages and these monthly peaks and troughs in revenue, occupancy, and ADR is crucial for maximizing your Airbnb profit potential in Soure.
Seasonal Strategies for Maximizing Profit
- Peak Season: Maximize revenue through premium pricing and potentially longer minimum stays. Ensure high availability.
- Low Season: Offer competitive pricing, special promotions (e.g., extended stay discounts), and flexible cancellation policies. Target off-season travelers like remote workers or budget-conscious guests.
- Shoulder Seasons: Implement dynamic pricing that balances peak and low rates. Target weekend travelers or specific events. Offer slightly more flexible terms than peak season.
- Regularly analyze your own performance against these Soure seasonality benchmarks and adjust your pricing and availability strategy accordingly.
Best Areas for Airbnb Investment in Soure (2026)
Exploring the top neighborhoods for short-term rentals in Soure? This section highlights key areas, outlining why they are attractive for hosts and guests, along with notable local attractions. Consider these locations based on your target guest profile and investment strategy.
| Neighborhood / Area | Why Host Here? (Target Guests & Appeal) | Key Attractions & Landmarks |
|---|---|---|
| Coimbra University Area | Home to one of the oldest universities in Europe, this area attracts students, academics, and tourists interested in history and culture. The vibrant student life provides a lively atmosphere. | University of Coimbra, Joanina Library, Botanical Garden of Coimbra, Santa Clara-a-Velha, Monastery of Santa Cruz |
| Almedina | A historic and picturesque neighborhood known for its medieval architecture and winding streets. It draws both tourists and locals looking for traditional Portuguese charm. | Almedina Tower, Old Cathedral of Coimbra, New Cathedral of Coimbra, Rua Ferreira Borges, Praça do Comércio |
| Praça da República | The main square in Coimbra, surrounded by cafes and restaurants, making it a popular gathering spot. Ideal for short-term rentals due to high foot traffic and amenities. | Praça da República, Cafe Santa Cruz, University Botanic Garden, Portugal dos Pequenitos, Chafariz da Praça |
| Botanical Gardens | A beautiful and serene area near the University, offering green spaces and a variety of plants. This attracts tourists seeking relaxation and nature walks. | Botanical Garden of Coimbra, Casa de Senhor da Pedra, Ceres Garden, The Glasshouse |
| Santa Clara | A charming neighborhood close to the river, it's known for its picturesque views and cultural sites. Perfect for those wanting a tranquil stay near the city. | Monastery of Santa Clara-a-Velha, Pedro e Inês Footbridge, River Mondego, Cultural Centre of Spain, Cais da Rainha |
| Cárcavelos Street | A vibrant street filled with shops, bars, and eateries, making it a popular choice for tourists and locals alike. Ideal for those looking for an urban experience. | Cárcavelos Street shops, Restaurants of Cárcavelos, Cultural events, Nightlife spots |
| Municipal Market | A central market that attracts locals and tourists, this area offers a taste of local culture and cuisine. Great for short-term rentals due to its lively atmosphere. | Mercado Municipal, Local vendors, Culinary experiences, Traditional Portuguese food |
| Portagem | A historical area known for its iconic Roman bridge and proximity to the Mondego River. This area is great for tourists looking to explore Coimbra's history. | Roman Bridge, Mondego River, Historical buildings, Old Town exploration |
Understanding Airbnb License Requirements & STR Laws in Soure (2026)
Yes, Soure, Coimbra, Portugal enforces high STR regulations. Obtaining a license and ensuring compliance is almost certainly required according to current 2026 STR laws. Always verify the latest short term rental regulations and Airbnb license requirements directly with local government authorities for Soure to ensure full compliance before hosting.
(Source: AirROI data, 2026, based on 97% licensed listings)
Top Performing Airbnb Properties in Soure (2026)
Benchmark your potential! Explore examples of top-performing Airbnb properties in Sourebased on Trailing Twelve Month (TTM) revenue. Analyze their characteristics, revenue, occupancy rate, and ADR to understand what drives success in this market.
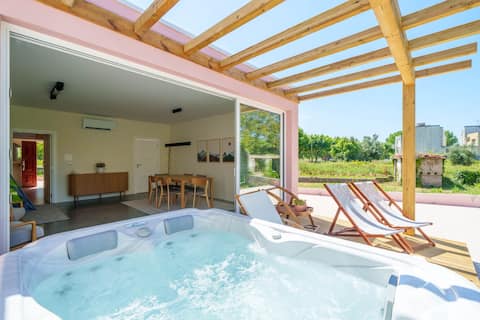
Riverfront pink house
Entire Place • 2 bedrooms

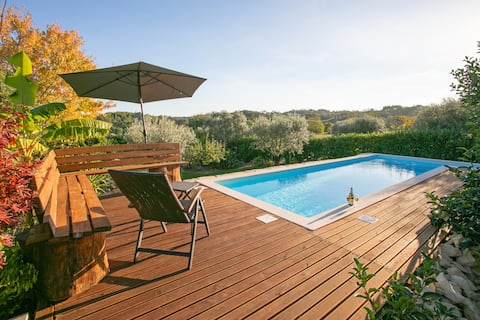
Sunflower Gardenhouse
Entire Place • 3 bedrooms

Countryside Chalet
Entire Place • 3 bedrooms
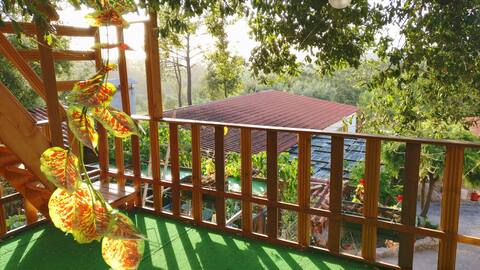
Sunflower Treehouse
Entire Place • 2 bedrooms
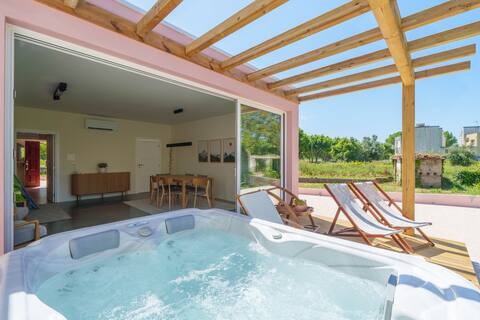
Riverfront house with jacuzzi & kids play area!
Entire Place • 2 bedrooms
Casa da Passarinha
Entire Place • 2 bedrooms
Note: Performance varies based on location, size, amenities, seasonality, and management quality. Data reflects the past 12 months.
Top Performing Airbnb Hosts in Soure (2026)
Learn from the best! This table showcases top-performing Airbnb hosts in Soure based on the number of properties managed and estimated total revenue over the past year. Analyze their scale and performance metrics.
| Host Name | Properties | Grossing Revenue | Stay Reviews | Avg Rating |
|---|---|---|---|---|
| Daniel | 6 | $97,249 | 616 | 4.92/5.0 |
| Sandra | 1 | $34,231 | 25 | 5.00/5.0 |
| Priscila | 9 | $28,030 | 20 | 4.83/5.0 |
| Sérgio | 3 | $27,302 | 289 | 4.95/5.0 |
| Lucília | 1 | $19,035 | 3 | 5.00/5.0 |
| José | 1 | $16,850 | 27 | 4.81/5.0 |
| José | 1 | $14,111 | 29 | 4.45/5.0 |
| Domingos Henrique | 1 | $12,081 | 28 | 4.89/5.0 |
| Quintinha Serranita | 2 | $11,800 | 128 | 4.85/5.0 |
| Estrela | 1 | $9,483 | 52 | 4.75/5.0 |
Analyzing the strategies of top hosts, such as their property selection, pricing, and guest communication, can offer valuable lessons for optimizing your own Airbnb operations in Soure.
Dive Deeper: Advanced Soure STR Market Data (2026)
Ready to unlock more insights? AirROI provides access to advanced metrics and comprehensive Airbnb data for Soure. Explore detailed analytics beyond this report to refine your investment strategy, optimize pricing, and maximize your vacation rental profits.
Explore Advanced MetricsSoure Short-Term Rental Market Composition (2026): Property & Room Types
Room Type Distribution
Property Type Distribution
Market Composition Insights for Soure
- The Soure Airbnb market composition is heavily skewed towards Entire Home/Apt listings, which make up 86.8% of the 38 active rentals. This indicates strong guest preference for privacy and space.
- Looking at the property type distribution in Soure, House properties are the most common (84.2%), reflecting the local real estate landscape.
- Houses represent a significant 84.2% portion, catering likely to families or larger groups.
- The presence of 5.3% Hotel/Boutique listings indicates integration with traditional hospitality.
- Smaller segments like unique stays (combined 2.6%) offer potential for unique stay experiences.
Soure Airbnb Room Capacity Analysis (2026): Bedroom Distribution
Distribution of Listings by Number of Bedrooms
Room Capacity Insights for Soure
- The dominant room capacity in Soure is 1 bedroom listings, making up 31.6% of the market. This suggests a strong demand for properties suitable for couples or solo travelers.
- Together, 1 bedroom and 2 bedrooms properties represent 63.2% of the active Airbnb listings in Soure, indicating a high concentration in these sizes.
- A significant 23.6% of listings offer 3+ bedrooms, catering to larger groups and families seeking more space in Soure.
Soure Vacation Rental Guest Capacity Trends (2026)
Distribution of Listings by Guest Capacity
Guest Capacity Insights for Soure
- The most common guest capacity trend in Soure vacation rentals is listings accommodating 4 guests (21.1%). This suggests the primary traveler segment is likely small families or groups.
- Properties designed for 4 guests and 6 guests dominate the Soure STR market, accounting for 39.5% of listings.
- 29.0% of properties accommodate 6+ guests, serving the market segment for larger families or group travel in Soure.
- On average, properties in Soure are equipped to host 3.8 guests.
Soure Airbnb Booking Patterns (2026): Available vs. Booked Days
Available Days Distribution
Booked Days Distribution
Booking Pattern Insights for Soure
- The most common availability pattern in Soure falls within the 271-366 days range, representing 68.4% of listings. This suggests many properties have significant open periods on their calendars.
- Approximately 94.7% of listings show high availability (181+ days open annually), indicating potential for increased bookings or specific owner usage patterns.
- For booked days, the 1-30 days range is most frequent in Soure (44.7%), reflecting common guest stay durations or potential owner blocking patterns.
- A notable 5.3% of properties secure long booking periods (181+ days booked per year), highlighting successful long-term rental strategies or significant owner usage.
Soure Airbnb Minimum Stay Requirements Analysis
Distribution of Listings by Minimum Night Requirement
1 Night
7 listings
18.4% of total
2 Nights
13 listings
34.2% of total
3 Nights
2 listings
5.3% of total
4-6 Nights
3 listings
7.9% of total
7-29 Nights
1 listings
2.6% of total
30+ Nights
12 listings
31.6% of total
Key Insights
- The most prevalent minimum stay requirement in Soure is 2 Nights, adopted by 34.2% of listings. This highlights the market's preference for shorter, flexible bookings.
- A significant segment (31.6%) caters to monthly stays (30+ nights) in Soure, pointing to opportunities in the extended-stay market.
Recommendations
- Align with the market by considering a 2 Nights minimum stay, as 34.2% of Soure hosts use this setting.
- If feasible, allowing 1-night stays, especially midweek or during low season, could capture last-minute bookings, as only 18.4% currently do.
- A 2-night minimum appears standard (34.2%). Consider this for weekends or peak periods.
- Explore offering discounts for stays of 30+ nights to attract the 31.6% of the market seeking extended stays.
- Adjust minimum nights based on seasonality – potentially shorter during low season and longer during peak demand periods in Soure.
Soure Airbnb Cancellation Policy Trends Analysis (2026)
Flexible
9 listings
23.7% of total
Moderate
4 listings
10.5% of total
Firm
20 listings
52.6% of total
Strict
5 listings
13.2% of total
Cancellation Policy Insights for Soure
- The prevailing Airbnb cancellation policy trend in Soure is Firm, used by 52.6% of listings.
- A majority (65.8%) of hosts in Soure utilize Firm or Strict policies, indicating a market where hosts prioritize booking security.
Recommendations for Hosts
- Consider adopting a Firm policy to align with the 52.6% market standard in Soure.
- Using a Strict policy might deter some guests, as only 13.2% of listings use it. Evaluate if potential revenue protection outweighs possible lower booking rates.
- Regularly review your cancellation policy against competitors and market demand shifts in Soure.
Soure STR Booking Lead Time Analysis (2026)
Average Booking Lead Time by Month
Booking Lead Time Insights for Soure
- The overall average booking lead time for vacation rentals in Soure is 56 days.
- Guests book furthest in advance for stays during August (average 117 days), likely coinciding with peak travel demand or local events.
- The shortest booking windows occur for stays in January (average 14 days), indicating more last-minute travel plans during this time.
- Seasonally, Summer (85 days avg.) sees the longest lead times, while Winter (31 days avg.) has the shortest, reflecting typical travel planning cycles.
Recommendations for Hosts
- Use the overall average lead time (56 days) as a baseline for your pricing and availability strategy in Soure.
- For August stays, consider implementing length-of-stay discounts or slightly higher rates for bookings made less than 117 days out to capitalize on advance planning.
- During January, focus on last-minute booking availability and promotions, as guests book with very short notice (14 days avg.).
- Target marketing efforts for the Summer season well in advance (at least 85 days) to capture early planners.
- Monitor your own booking lead times against these Soure averages to identify opportunities for dynamic pricing adjustments.
Popular & Essential Airbnb Amenities in Soure (2026)
Amenity Prevalence
Amenity Insights for Soure
- Essential amenities in Soure that guests expect include: Refrigerator. Lacking these (this) could significantly impact bookings.
- Popular amenities like TV, Microwave, Hot water are common but not universal. Offering these can provide a competitive edge.
- Warning: Wifi is not universally provided but is considered essential globally. Ensure reliable Wifi is offered.
Recommendations for Hosts
- Ensure your listing includes all essential amenities for Soure: Refrigerator.
- Prioritize adding missing essentials: Refrigerator.
- Consider adding popular differentiators like TV or Microwave to increase appeal.
- Highlight unique or less common amenities you offer (e.g., hot tub, dedicated workspace, EV charger) in your listing description and photos.
- Regularly check competitor amenities in Soure to stay competitive.
Soure Airbnb Guest Demographics & Profile Analysis (2026)
Guest Profile Summary for Soure
- The typical guest profile for Airbnb in Soure consists of predominantly international visitors (78%), with top international origins including France, typically belonging to the Post-2000s (Gen Z/Alpha) group (50%), primarily speaking English or French.
- Domestic travelers account for 21.6% of guests.
- Key international markets include Portugal (21.6%) and France (19.6%).
- Top languages spoken are English (31.8%) followed by French (16.3%).
- A significant demographic segment is the Post-2000s (Gen Z/Alpha) group, representing 50% of guests.
Recommendations for Hosts
- Focus marketing internationally, particularly towards travelers from France.
- Tailor amenities and listing descriptions to appeal to the dominant Post-2000s (Gen Z/Alpha) demographic (e.g., highlight fast WiFi, smart home features, local guides).
- Highlight unique local experiences or amenities relevant to the primary guest profile.
- Consider seasonal promotions aligned with peak travel times for key origin markets.
Nearby Short-Term Rental Market Comparison
How does the Soure Airbnb market stack up against its neighbors? Compare key performance metrics like average monthly revenue, ADR, and occupancy rates in surrounding areas to understand the broader regional STR landscape.
| Market | Active Properties | Monthly Revenue | Daily Rate | Avg. Occupancy |
|---|---|---|---|---|
| Penhalonga e Paços de Gaiolo | 23 | $4,304 | $357.04 | 40% |
| Sande e São Lourenço do Douro | 19 | $3,009 | $319.97 | 37% |
| Reguengo Grande | 13 | $2,843 | $319.66 | 40% |
| Armamar | 66 | $2,578 | $266.43 | 36% |
| Alpendorada, Várzea e Torrão | 19 | $2,503 | $264.40 | 35% |
| Vila Boa de Quires e Maureles | 10 | $2,316 | $202.63 | 48% |
| Ribamar | 19 | $2,267 | $265.61 | 40% |
| Santa Bárbara | 24 | $2,115 | $273.89 | 38% |
| Alijó | 69 | $2,072 | $250.65 | 30% |
| Cinfães | 16 | $2,059 | $253.86 | 28% |