Montemor-o-Velho Airbnb Market Analysis 2026: Short Term Rental Data & Vacation Rental Statistics in Coimbra, Portugal
Is Airbnb profitable in Montemor-o-Velho in 2026? Explore comprehensive Airbnb analytics for Montemor-o-Velho, Coimbra, Portugal to uncover income potential. This 2026 STR market report for Montemor-o-Velho, based on AirROI data from February 2025 to January 2026, reveals key trends in the niche market of 19 active listings.
Whether you're considering an Airbnb investment in Montemor-o-Velho, optimizing your existing vacation rental, or exploring rental arbitrage opportunities, understanding the Montemor-o-Velho Airbnb data is crucial. Navigating the high regulation landscape is key to maximizing your short term rental income potential. Let's dive into the specifics.
Key Montemor-o-Velho Airbnb Performance Metrics Overview
Monthly Airbnb Revenue Variations & Income Potential in Montemor-o-Velho (2026)
Understanding the monthly revenue variations for Airbnb listings in Montemor-o-Velho is key to maximizing your short term rental income potential. Seasonality significantly impacts earnings. Our analysis, based on data from the past 12 months, shows that the peak revenue month for STRs in Montemor-o-Velho is typically August, while January often presents the lowest earnings, highlighting opportunities for strategic pricing adjustments during shoulder and low seasons. Explore the typical Airbnb income in Montemor-o-Velho across different performance tiers:
- Best-in-class properties (Top 10%) achieve $1,962+ monthly, often utilizing dynamic pricing and superior guest experiences.
- Strong performing properties (Top 25%) earn $1,347 or more, indicating effective management and desirable locations/amenities.
- Typical properties (Median) generate around $694 per month, representing the average market performance.
- Entry-level properties (Bottom 25%) see earnings around $397, often with potential for optimization.
Average Monthly Airbnb Earnings Trend in Montemor-o-Velho
Montemor-o-Velho Airbnb Occupancy Rate Trends (2026)
Maximize your bookings by understanding the Montemor-o-Velho STR occupancy trends. Seasonal demand shifts significantly influence how often properties are booked. Typically, Augustsees the highest demand (peak season occupancy), while January experiences the lowest (low season). Effective strategies, like adjusting minimum stays or offering promotions, can boost occupancy during slower periods. Here's how different property tiers perform in Montemor-o-Velho:
- Best-in-class properties (Top 10%) achieve 51%+ occupancy, indicating high desirability and potentially optimized availability.
- Strong performing properties (Top 25%) maintain 35% or higher occupancy, suggesting good market fit and guest satisfaction.
- Typical properties (Median) have an occupancy rate around 21%.
- Entry-level properties (Bottom 25%) average 12% occupancy, potentially facing higher vacancy.
Average Monthly Occupancy Rate Trend in Montemor-o-Velho
Average Daily Rate (ADR) Airbnb Trends in Montemor-o-Velho (2026)
Effective short term rental pricing strategy in Montemor-o-Velho involves understanding monthly ADR fluctuations. The Average Daily Rate (ADR) for Airbnb in Montemor-o-Velho typically peaks in June and dips lowest during February. Leveraging Airbnb dynamic pricing tools or strategies based on this seasonality can significantly boost revenue. Here's a look at the typical nightly rates achieved:
- Best-in-class properties (Top 10%) command rates of $229+ per night, often due to premium features or locations.
- Strong performing properties (Top 25%) achieve nightly rates of $156 or more.
- Typical properties (Median) charge around $108 per night.
- Entry-level properties (Bottom 25%) earn around $88 per night.
Average Daily Rate (ADR) Trend by Month in Montemor-o-Velho
Get Live Montemor-o-Velho Market Intelligence 👇

Explore Real-time Analytics
Airbnb Seasonality Analysis & Trends in Montemor-o-Velho (2026)
Peak Season (August, July, June)
- Revenue averages $1,963 per month
- Occupancy rates average 46.2%
- Daily rates average $140
Shoulder Season
- Revenue averages $771 per month
- Occupancy maintains around 23.9%
- Daily rates hold near $126
Low Season (January, November, December)
- Revenue drops to average $239 per month
- Occupancy decreases to average 8.6%
- Daily rates adjust to average $137
Seasonality Insights for Montemor-o-Velho
- The Airbnb seasonality in Montemor-o-Velho shows highly seasonal trends requiring careful strategy. While the sections above show seasonal averages, it's also insightful to look at the extremes:
- During the high season, the absolute peak month showcases Montemor-o-Velho's highest earning potential, with monthly revenues capable of climbing to $2,688, occupancy reaching a high of 61.9%, and ADRs peaking at $142.
- Conversely, the slowest single month of the year, typically falling within the low season, marks the market's lowest point. In this month, revenue might dip to $126, occupancy could drop to 4.0%, and ADRs may adjust down to $115.
- Understanding both the seasonal averages and these monthly peaks and troughs in revenue, occupancy, and ADR is crucial for maximizing your Airbnb profit potential in Montemor-o-Velho.
Seasonal Strategies for Maximizing Profit
- Peak Season: Maximize revenue through premium pricing and potentially longer minimum stays. Ensure high availability.
- Low Season: Offer competitive pricing, special promotions (e.g., extended stay discounts), and flexible cancellation policies. Target off-season travelers like remote workers or budget-conscious guests.
- Shoulder Seasons: Implement dynamic pricing that balances peak and low rates. Target weekend travelers or specific events. Offer slightly more flexible terms than peak season.
- Regularly analyze your own performance against these Montemor-o-Velho seasonality benchmarks and adjust your pricing and availability strategy accordingly.
Best Areas for Airbnb Investment in Montemor-o-Velho (2026)
Exploring the top neighborhoods for short-term rentals in Montemor-o-Velho? This section highlights key areas, outlining why they are attractive for hosts and guests, along with notable local attractions. Consider these locations based on your target guest profile and investment strategy.
| Neighborhood / Area | Why Host Here? (Target Guests & Appeal) | Key Attractions & Landmarks |
|---|---|---|
| Montemor-o-Velho Castle | A historic and picturesque area that attracts tourists interested in culture and history, with breathtaking views and medieval architecture. | Montemor-o-Velho Castle, Monastery of Lorvão, River Mondego, Local artisan shops, Historical walking tours |
| Praia de Mira | Known for its beautiful sandy beaches and natural landscapes, this area suits tourists looking for a relaxing beach experience with various water activities. | Praia de Mira Beach, Natural Reserve of the River Mondego, Beaches of the Atlantic Coast, Local seafood restaurants, Beachside promenades |
| Agueda | This vibrant town is known for its colorful umbrellas and cultural festivals, appealing to those interested in local traditions and events. | Umbrella Sky Project, Agueda’s Municipal Museum, Cultural events and festivals, Parks and gardens, Restaurants and cafés |
| Coimbra city center | The historic university city is a major tourist attraction, offering a rich educational history and vibrant student life, perfect for short-term rentals. | University of Coimbra, Joanina Library, Old Cathedral of Coimbra, Monastery of Santa Cruz, Botanical Garden of Coimbra |
| Vila Nova de Poiares | A charming town known for its natural landscapes and tranquility, attracting visitors looking for a peaceful getaway close to nature. | Poiares River, Nature trails and hiking, Local wine production, Quiet village atmosphere, Traditional restaurants |
| Lousã | Set in a mountainous region, it draws visitors looking for outdoor activities like hiking and exploring local villages with traditional architecture. | Lousã Mountain, Historical villages of Lousã, Parks and outdoor activities, Local gastronomy, Stunning natural views |
| Penoita | This quiet situation allows travelers to connect with Portuguese countryside life and enjoy rural tourism, ideal for those seeking an escape from city life. | Countryside landscapes, Rural tourism activities, Local festivals, Traditional agritourism experiences, Tranquil environment |
| Figueira da Foz | A coastal city famous for its beaches and nightlife, ideal for tourists searching for entertainment along with sun and sand. | Figueira da Foz Beach, Casino Figueira, Local seafood markets, Water sports, Nightlife and bars |
Understanding Airbnb License Requirements & STR Laws in Montemor-o-Velho (2026)
Yes, Montemor-o-Velho, Coimbra, Portugal enforces high STR regulations. Obtaining a license and ensuring compliance is almost certainly required according to current 2026 STR laws. Always verify the latest short term rental regulations and Airbnb license requirements directly with local government authorities for Montemor-o-Velho to ensure full compliance before hosting.
(Source: AirROI data, 2026, based on 74% licensed listings)
Top Performing Airbnb Properties in Montemor-o-Velho (2026)
Benchmark your potential! Explore examples of top-performing Airbnb properties in Montemor-o-Velhobased on Trailing Twelve Month (TTM) revenue. Analyze their characteristics, revenue, occupancy rate, and ADR to understand what drives success in this market.

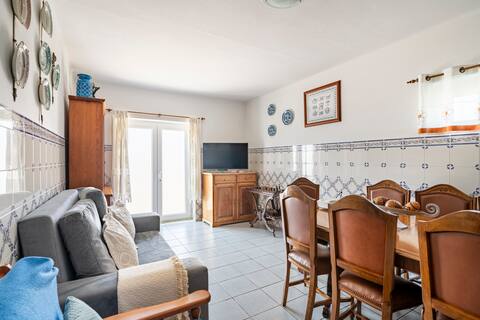
Vacation home in Baixo Mondego
Entire Place • 2 bedrooms
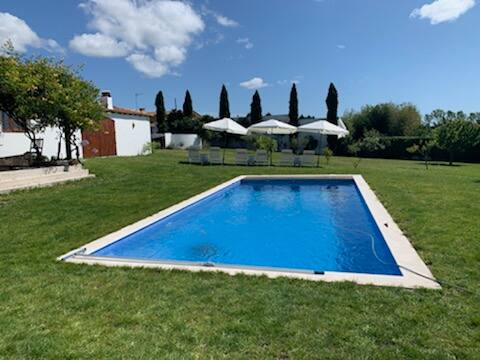
Villa + pool near the beach
Entire Place • 4 bedrooms

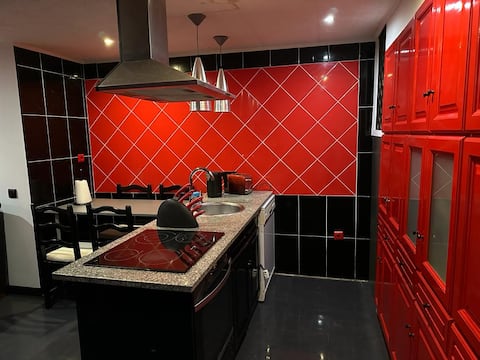
Adriano's House
Entire Place • 5 bedrooms
Quintinha Teresinha
Entire Place • 4 bedrooms
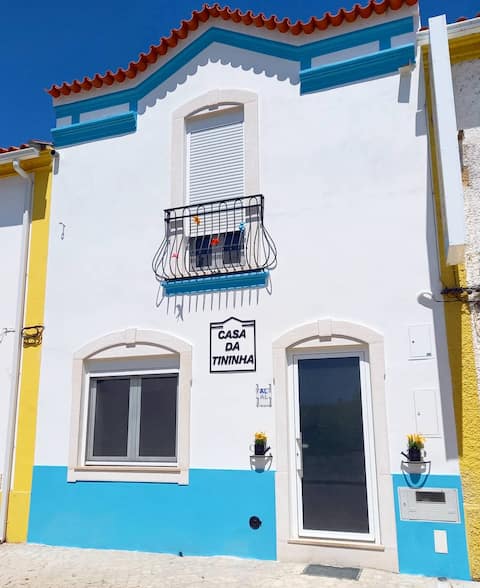
Casa da Tininha
Entire Place • 2 bedrooms
Vacation home on the river beach
Entire Place • 1 bedroom
Note: Performance varies based on location, size, amenities, seasonality, and management quality. Data reflects the past 12 months.
Top Performing Airbnb Hosts in Montemor-o-Velho (2026)
Learn from the best! This table showcases top-performing Airbnb hosts in Montemor-o-Velho based on the number of properties managed and estimated total revenue over the past year. Analyze their scale and performance metrics.
| Host Name | Properties | Grossing Revenue | Stay Reviews | Avg Rating |
|---|---|---|---|---|
| Edite | 2 | $35,459 | 45 | 4.88/5.0 |
| Isabelle | 1 | $18,388 | 11 | 4.82/5.0 |
| Manuela | 1 | $17,088 | 29 | 4.62/5.0 |
| Inês | 2 | $16,460 | 110 | 4.78/5.0 |
| Nuno Zylberberg | 3 | $14,851 | 424 | 4.60/5.0 |
| Paula | 1 | $13,817 | 89 | 4.91/5.0 |
| Cristina | 1 | $13,625 | 92 | 4.96/5.0 |
| MyStay | 2 | $9,873 | 2 | Not Rated |
| Paulo | 1 | $9,002 | 3 | 5.00/5.0 |
| Monica Filipa | 1 | $6,754 | 44 | 4.55/5.0 |
Analyzing the strategies of top hosts, such as their property selection, pricing, and guest communication, can offer valuable lessons for optimizing your own Airbnb operations in Montemor-o-Velho.
Dive Deeper: Advanced Montemor-o-Velho STR Market Data (2026)
Ready to unlock more insights? AirROI provides access to advanced metrics and comprehensive Airbnb data for Montemor-o-Velho. Explore detailed analytics beyond this report to refine your investment strategy, optimize pricing, and maximize your vacation rental profits.
Explore Advanced MetricsMontemor-o-Velho Short-Term Rental Market Composition (2026): Property & Room Types
Room Type Distribution
Property Type Distribution
Market Composition Insights for Montemor-o-Velho
- The Montemor-o-Velho Airbnb market composition is heavily skewed towards Entire Home/Apt listings, which make up 78.9% of the 19 active rentals. This indicates strong guest preference for privacy and space.
- Looking at the property type distribution in Montemor-o-Velho, House properties are the most common (57.9%), reflecting the local real estate landscape.
- Houses represent a significant 57.9% portion, catering likely to families or larger groups.
- The presence of 15.8% Hotel/Boutique listings indicates integration with traditional hospitality.
Montemor-o-Velho Airbnb Room Capacity Analysis (2026): Bedroom Distribution
Distribution of Listings by Number of Bedrooms
Room Capacity Insights for Montemor-o-Velho
- The dominant room capacity in Montemor-o-Velho is 2 bedrooms listings, making up 31.6% of the market. This suggests a strong demand for properties suitable for couples or solo travelers.
- Together, 2 bedrooms and 1 bedroom properties represent 63.2% of the active Airbnb listings in Montemor-o-Velho, indicating a high concentration in these sizes.
- A significant 21.1% of listings offer 3+ bedrooms, catering to larger groups and families seeking more space in Montemor-o-Velho.
Montemor-o-Velho Vacation Rental Guest Capacity Trends (2026)
Distribution of Listings by Guest Capacity
Guest Capacity Insights for Montemor-o-Velho
- The most common guest capacity trend in Montemor-o-Velho vacation rentals is listings accommodating 4 guests (26.3%). This suggests the primary traveler segment is likely small families or groups.
- Properties designed for 4 guests and 6 guests dominate the Montemor-o-Velho STR market, accounting for 47.4% of listings.
- 36.9% of properties accommodate 6+ guests, serving the market segment for larger families or group travel in Montemor-o-Velho.
- On average, properties in Montemor-o-Velho are equipped to host 4.2 guests.
Montemor-o-Velho Airbnb Booking Patterns (2026): Available vs. Booked Days
Available Days Distribution
Booked Days Distribution
Booking Pattern Insights for Montemor-o-Velho
- The most common availability pattern in Montemor-o-Velho falls within the 271-366 days range, representing 78.9% of listings. This suggests many properties have significant open periods on their calendars.
- Approximately 100.0% of listings show high availability (181+ days open annually), indicating potential for increased bookings or specific owner usage patterns.
- For booked days, the 31-90 days range is most frequent in Montemor-o-Velho (63.2%), reflecting common guest stay durations or potential owner blocking patterns.
Montemor-o-Velho Airbnb Minimum Stay Requirements Analysis
Distribution of Listings by Minimum Night Requirement
1 Night
7 listings
36.8% of total
2 Nights
6 listings
31.6% of total
4-6 Nights
1 listings
5.3% of total
30+ Nights
5 listings
26.3% of total
Key Insights
- The most prevalent minimum stay requirement in Montemor-o-Velho is 1 Night, adopted by 36.8% of listings. This highlights the market's preference for shorter, flexible bookings.
- A strong majority (68.4%) of the Montemor-o-Velho Airbnb data shows acceptance of very short stays (1-2 nights), indicating a dynamic, high-turnover market.
- A significant segment (26.3%) caters to monthly stays (30+ nights) in Montemor-o-Velho, pointing to opportunities in the extended-stay market.
Recommendations
- Align with the market by considering a 1 Night minimum stay, as 36.8% of Montemor-o-Velho hosts use this setting.
- Explore offering discounts for stays of 30+ nights to attract the 26.3% of the market seeking extended stays.
- Adjust minimum nights based on seasonality – potentially shorter during low season and longer during peak demand periods in Montemor-o-Velho.
Montemor-o-Velho Airbnb Cancellation Policy Trends Analysis (2026)
Flexible
5 listings
26.3% of total
Moderate
7 listings
36.8% of total
Firm
6 listings
31.6% of total
Strict
1 listings
5.3% of total
Cancellation Policy Insights for Montemor-o-Velho
- The prevailing Airbnb cancellation policy trend in Montemor-o-Velho is Moderate, used by 36.8% of listings.
- There's a relatively balanced mix between guest-friendly (63.1%) and stricter (36.9%) policies, offering choices for different guest needs.
- Strict cancellation policies are quite rare (5.3%), potentially making listings with this policy less competitive unless justified by high demand or property type.
Recommendations for Hosts
- Consider adopting a Moderate policy to align with the 36.8% market standard in Montemor-o-Velho.
- Using a Strict policy might deter some guests, as only 5.3% of listings use it. Evaluate if potential revenue protection outweighs possible lower booking rates.
- Regularly review your cancellation policy against competitors and market demand shifts in Montemor-o-Velho.
Montemor-o-Velho STR Booking Lead Time Analysis (2026)
Average Booking Lead Time by Month
Booking Lead Time Insights for Montemor-o-Velho
- The overall average booking lead time for vacation rentals in Montemor-o-Velho is 54 days.
- Guests book furthest in advance for stays during August (average 97 days), likely coinciding with peak travel demand or local events.
- The shortest booking windows occur for stays in January (average 1 days), indicating more last-minute travel plans during this time.
- Seasonally, Summer (73 days avg.) sees the longest lead times, while Winter (30 days avg.) has the shortest, reflecting typical travel planning cycles.
Recommendations for Hosts
- Use the overall average lead time (54 days) as a baseline for your pricing and availability strategy in Montemor-o-Velho.
- For August stays, consider implementing length-of-stay discounts or slightly higher rates for bookings made less than 97 days out to capitalize on advance planning.
- During January, focus on last-minute booking availability and promotions, as guests book with very short notice (1 days avg.).
- Target marketing efforts for the Summer season well in advance (at least 73 days) to capture early planners.
- Monitor your own booking lead times against these Montemor-o-Velho averages to identify opportunities for dynamic pricing adjustments.
Popular & Essential Airbnb Amenities in Montemor-o-Velho (2026)
Amenity Prevalence
Amenity Insights for Montemor-o-Velho
- Essential amenities in Montemor-o-Velho that guests expect include: Wifi. Lacking these (this) could significantly impact bookings.
- Popular amenities like Essentials, Free parking on premises, Hot water are common but not universal. Offering these can provide a competitive edge.
Recommendations for Hosts
- Ensure your listing includes all essential amenities for Montemor-o-Velho: Wifi.
- Consider adding popular differentiators like Essentials or Free parking on premises to increase appeal.
- Highlight unique or less common amenities you offer (e.g., hot tub, dedicated workspace, EV charger) in your listing description and photos.
- Regularly check competitor amenities in Montemor-o-Velho to stay competitive.
Montemor-o-Velho Airbnb Guest Demographics & Profile Analysis (2026)
Guest Profile Summary for Montemor-o-Velho
- The typical guest profile for Airbnb in Montemor-o-Velho consists of predominantly international visitors (83%), with top international origins including France, typically belonging to the Post-2000s (Gen Z/Alpha) group (50%), primarily speaking English or Spanish.
- Domestic travelers account for 16.7% of guests.
- Key international markets include Portugal (16.7%) and France (15%).
- Top languages spoken are English (37.7%) followed by Spanish (13.1%).
- A significant demographic segment is the Post-2000s (Gen Z/Alpha) group, representing 50% of guests.
Recommendations for Hosts
- Focus marketing internationally, particularly towards travelers from France.
- Tailor amenities and listing descriptions to appeal to the dominant Post-2000s (Gen Z/Alpha) demographic (e.g., highlight fast WiFi, smart home features, local guides).
- Highlight unique local experiences or amenities relevant to the primary guest profile.
- Consider seasonal promotions aligned with peak travel times for key origin markets.
Nearby Short-Term Rental Market Comparison
How does the Montemor-o-Velho Airbnb market stack up against its neighbors? Compare key performance metrics like average monthly revenue, ADR, and occupancy rates in surrounding areas to understand the broader regional STR landscape.
| Market | Active Properties | Monthly Revenue | Daily Rate | Avg. Occupancy |
|---|---|---|---|---|
| Penhalonga e Paços de Gaiolo | 23 | $4,304 | $357.04 | 40% |
| Sande e São Lourenço do Douro | 19 | $3,009 | $319.97 | 37% |
| Reguengo Grande | 13 | $2,843 | $319.66 | 40% |
| Armamar | 66 | $2,578 | $266.43 | 36% |
| Alpendorada, Várzea e Torrão | 19 | $2,503 | $264.40 | 35% |
| Vila Boa de Quires e Maureles | 10 | $2,316 | $202.63 | 48% |
| Ribamar | 19 | $2,267 | $265.61 | 40% |
| Santa Bárbara | 24 | $2,115 | $273.89 | 38% |
| Alijó | 69 | $2,072 | $250.65 | 30% |
| Cinfães | 16 | $2,059 | $253.86 | 28% |