Coimbra Airbnb Market Analysis 2026: Short Term Rental Data & Vacation Rental Statistics in Coimbra, Portugal
Is Airbnb profitable in Coimbra in 2026? Explore comprehensive Airbnb analytics for Coimbra, Coimbra, Portugal to uncover income potential. This 2026 STR market report for Coimbra, based on AirROI data from February 2025 to January 2026, reveals key trends in the market of 548 active listings.
Whether you're considering an Airbnb investment in Coimbra, optimizing your existing vacation rental, or exploring rental arbitrage opportunities, understanding the Coimbra Airbnb data is crucial. Navigating the high regulation landscape is key to maximizing your short term rental income potential. Let's dive into the specifics.
Key Coimbra Airbnb Performance Metrics Overview
Monthly Airbnb Revenue Variations & Income Potential in Coimbra (2026)
Understanding the monthly revenue variations for Airbnb listings in Coimbra is key to maximizing your short term rental income potential. Seasonality significantly impacts earnings. Our analysis, based on data from the past 12 months, shows that the peak revenue month for STRs in Coimbra is typically August, while January often presents the lowest earnings, highlighting opportunities for strategic pricing adjustments during shoulder and low seasons. Explore the typical Airbnb income in Coimbra across different performance tiers:
- Best-in-class properties (Top 10%) achieve $2,654+ monthly, often utilizing dynamic pricing and superior guest experiences.
- Strong performing properties (Top 25%) earn $1,739 or more, indicating effective management and desirable locations/amenities.
- Typical properties (Median) generate around $1,034 per month, representing the average market performance.
- Entry-level properties (Bottom 25%) see earnings around $480, often with potential for optimization.
Average Monthly Airbnb Earnings Trend in Coimbra
Coimbra Airbnb Occupancy Rate Trends (2026)
Maximize your bookings by understanding the Coimbra STR occupancy trends. Seasonal demand shifts significantly influence how often properties are booked. Typically, Maysees the highest demand (peak season occupancy), while January experiences the lowest (low season). Effective strategies, like adjusting minimum stays or offering promotions, can boost occupancy during slower periods. Here's how different property tiers perform in Coimbra:
- Best-in-class properties (Top 10%) achieve 79%+ occupancy, indicating high desirability and potentially optimized availability.
- Strong performing properties (Top 25%) maintain 64% or higher occupancy, suggesting good market fit and guest satisfaction.
- Typical properties (Median) have an occupancy rate around 42%.
- Entry-level properties (Bottom 25%) average 21% occupancy, potentially facing higher vacancy.
Average Monthly Occupancy Rate Trend in Coimbra
Average Daily Rate (ADR) Airbnb Trends in Coimbra (2026)
Effective short term rental pricing strategy in Coimbra involves understanding monthly ADR fluctuations. The Average Daily Rate (ADR) for Airbnb in Coimbra typically peaks in September and dips lowest during February. Leveraging Airbnb dynamic pricing tools or strategies based on this seasonality can significantly boost revenue. Here's a look at the typical nightly rates achieved:
- Best-in-class properties (Top 10%) command rates of $155+ per night, often due to premium features or locations.
- Strong performing properties (Top 25%) achieve nightly rates of $115 or more.
- Typical properties (Median) charge around $82 per night.
- Entry-level properties (Bottom 25%) earn around $57 per night.
Average Daily Rate (ADR) Trend by Month in Coimbra
Get Live Coimbra Market Intelligence 👇

Explore Real-time Analytics
Airbnb Seasonality Analysis & Trends in Coimbra (2026)
Peak Season (August, July, May)
- Revenue averages $1,705 per month
- Occupancy rates average 53.8%
- Daily rates average $99
Shoulder Season
- Revenue averages $1,308 per month
- Occupancy maintains around 44.7%
- Daily rates hold near $94
Low Season (January, February, December)
- Revenue drops to average $816 per month
- Occupancy decreases to average 30.7%
- Daily rates adjust to average $89
Seasonality Insights for Coimbra
- The Airbnb seasonality in Coimbra shows highly seasonal trends requiring careful strategy. While the sections above show seasonal averages, it's also insightful to look at the extremes:
- During the high season, the absolute peak month showcases Coimbra's highest earning potential, with monthly revenues capable of climbing to $1,718, occupancy reaching a high of 55.5%, and ADRs peaking at $103.
- Conversely, the slowest single month of the year, typically falling within the low season, marks the market's lowest point. In this month, revenue might dip to $710, occupancy could drop to 25.2%, and ADRs may adjust down to $85.
- Understanding both the seasonal averages and these monthly peaks and troughs in revenue, occupancy, and ADR is crucial for maximizing your Airbnb profit potential in Coimbra.
Seasonal Strategies for Maximizing Profit
- Peak Season: Maximize revenue through premium pricing and potentially longer minimum stays. Ensure high availability.
- Low Season: Offer competitive pricing, special promotions (e.g., extended stay discounts), and flexible cancellation policies. Target off-season travelers like remote workers or budget-conscious guests.
- Shoulder Seasons: Implement dynamic pricing that balances peak and low rates. Target weekend travelers or specific events. Offer slightly more flexible terms than peak season.
- Regularly analyze your own performance against these Coimbra seasonality benchmarks and adjust your pricing and availability strategy accordingly.
Best Areas for Airbnb Investment in Coimbra (2026)
Exploring the top neighborhoods for short-term rentals in Coimbra? This section highlights key areas, outlining why they are attractive for hosts and guests, along with notable local attractions. Consider these locations based on your target guest profile and investment strategy.
| Neighborhood / Area | Why Host Here? (Target Guests & Appeal) | Key Attractions & Landmarks |
|---|---|---|
| Baixa | The historic downtown area of Coimbra with its beautiful architecture, vibrant atmosphere, and numerous cafes and shops. Perfect for tourists wanting to experience the city's history and culture. | University of Coimbra, Joanina Library, Santa Clara-a-Velha, Coimbra Old Cathedral, Pedra de Ançã |
| Almedina | The neighborhood surrounding the Almedina arch boasts charming streets and proximity to the university, attracting students and tourists alike. | Almedina Tower, Monastery of Santa Cruz, Quinta das Lágrimas, Coimbra Botanical Garden, Cafe Santa Cruz |
| Praceta João Paulo II | A lively area filled with restaurants and bars that cater to both locals and students. Great for those looking to enjoy Coimbra's night scene. | Focus Café, Praça da República, Mondego River Promenade, Morraria District, Alma Mourisca |
| Pedrulha | A tranquil residential area that offers beautiful views of the city and green spaces, ideal for families and long-term renters. | Puppet Museum, Santo António dos Olivais, Bairro Novo, Local parks, Caminho dos Fossos |
| Santo António dos Olivais | A peaceful neighborhood known for its family-friendly atmosphere and proximity to the university. | Coimbra Botanical Garden, Mata Nacional do Choupal, Santos Populares festival, Local artisan shops, Santo António Church |
| Lapa | A picturesque district that is both traditional and charming, attracting tourists seeking authenticity and local culture. | Lapa Church, Museum of Science of the University of Coimbra, Praça do Comércio, Local art galleries, Market of Coimbra |
| São Martinho do Bispo | Emerging neighborhood with affordable housing options, attracting both students and young professionals, becoming popular among Airbnb hosts. | Local parks, University's athletic facilities, Mata do Choupal, Food markets, Cultural events |
| Ribeira de Santa Clara | Located by the river, this area offers fantastic views and is ideal for guests looking for a scenic experience. | Santa Clara Bridge, Riverside cafes, Mouraria district, Scenic walking paths, Local restaurants |
Understanding Airbnb License Requirements & STR Laws in Coimbra (2026)
Yes, Coimbra, Coimbra, Portugal enforces high STR regulations. Obtaining a license and ensuring compliance is almost certainly required according to current 2026 STR laws. Always verify the latest short term rental regulations and Airbnb license requirements directly with local government authorities for Coimbra to ensure full compliance before hosting.
(Source: AirROI data, 2026, based on 92% licensed listings)
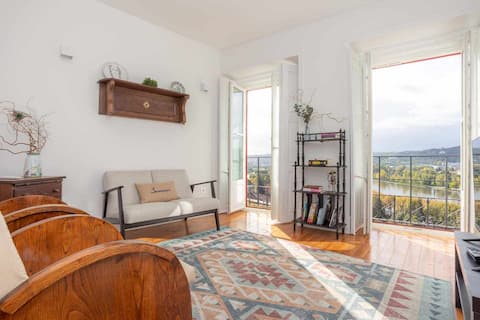
Top Performing Airbnb Properties in Coimbra (2026)
Benchmark your potential! Explore examples of top-performing Airbnb properties in Coimbrabased on Trailing Twelve Month (TTM) revenue. Analyze their characteristics, revenue, occupancy rate, and ADR to understand what drives success in this market.

Granja da Cabrita - Connect with Nature
Entire Place • 5 bedrooms

Between Ruas 3.1 - Large/Garden/AC/Parking
Entire Place • 3 bedrooms

Entre Ruas 4.1 - Large/Garden/AC/Views
Entire Place • 3 bedrooms

Entre Ruas 1.2
Entire Place • 2 bedrooms

Casas da Couraça – Bright T2 Amazing River View
Entire Place • 2 bedrooms
Casas da Couraça – Spacious T2 Top River Views
Entire Place • 2 bedrooms
Note: Performance varies based on location, size, amenities, seasonality, and management quality. Data reflects the past 12 months.
Top Performing Airbnb Hosts in Coimbra (2026)
Learn from the best! This table showcases top-performing Airbnb hosts in Coimbra based on the number of properties managed and estimated total revenue over the past year. Analyze their scale and performance metrics.
| Host Name | Properties | Grossing Revenue | Stay Reviews | Avg Rating |
|---|---|---|---|---|
| Nuno Miguel | 22 | $372,504 | 1346 | 4.83/5.0 |
| Coimbra Vintage Lofts | 9 | $287,575 | 454 | 4.69/5.0 |
| André E Joana | 15 | $282,237 | 543 | 4.87/5.0 |
| Atlantic | 8 | $249,240 | 789 | 4.86/5.0 |
| Miguel | 24 | $222,250 | 2256 | 4.54/5.0 |
| Vitor | 11 | $212,676 | 1415 | 4.91/5.0 |
| Suse | 17 | $198,172 | 2430 | 4.56/5.0 |
| Miguel | 6 | $147,335 | 56 | 4.91/5.0 |
| Carina | 21 | $137,174 | 3011 | 4.70/5.0 |
| Passeata | 4 | $134,003 | 496 | 4.89/5.0 |
Analyzing the strategies of top hosts, such as their property selection, pricing, and guest communication, can offer valuable lessons for optimizing your own Airbnb operations in Coimbra.
Dive Deeper: Advanced Coimbra STR Market Data (2026)
Ready to unlock more insights? AirROI provides access to advanced metrics and comprehensive Airbnb data for Coimbra. Explore detailed analytics beyond this report to refine your investment strategy, optimize pricing, and maximize your vacation rental profits.
Explore Advanced MetricsCoimbra Short-Term Rental Market Composition (2026): Property & Room Types
Room Type Distribution
Property Type Distribution
Market Composition Insights for Coimbra
- The Coimbra Airbnb market composition is heavily skewed towards Entire Home/Apt listings, which make up 66.8% of the 548 active rentals. This indicates strong guest preference for privacy and space.
- However, a notable 33.2% share for Private Rooms suggests opportunities for budget-conscious travelers or hosts renting out spare rooms.
- Looking at the property type distribution in Coimbra, Apartment/Condo properties are the most common (65.7%), reflecting the local real estate landscape.
- The presence of 19% Hotel/Boutique listings indicates integration with traditional hospitality.
- Smaller segments like others, outdoor/unique, unique stays (combined 2.0%) offer potential for unique stay experiences.
Coimbra Airbnb Room Capacity Analysis (2026): Bedroom Distribution
Distribution of Listings by Number of Bedrooms
Room Capacity Insights for Coimbra
- The dominant room capacity in Coimbra is 1 bedroom listings, making up 53.8% of the market. This suggests a strong demand for properties suitable for couples or solo travelers.
- Together, 1 bedroom and 2 bedrooms properties represent 68.0% of the active Airbnb listings in Coimbra, indicating a high concentration in these sizes.
- With over half the market (53.8%) consisting of studios or 1-bedroom units, Coimbra is particularly well-suited for individuals or couples.
Coimbra Vacation Rental Guest Capacity Trends (2026)
Distribution of Listings by Guest Capacity
Guest Capacity Insights for Coimbra
- The most common guest capacity trend in Coimbra vacation rentals is listings accommodating 2 guests (34.7%). This suggests the primary traveler segment is likely couples or solo travelers.
- Properties designed for 2 guests and 4 guests dominate the Coimbra STR market, accounting for 53.3% of listings.
- 11.1% of properties accommodate 6+ guests, serving the market segment for larger families or group travel in Coimbra.
- On average, properties in Coimbra are equipped to host 2.7 guests.
Coimbra Airbnb Booking Patterns (2026): Available vs. Booked Days
Available Days Distribution
Booked Days Distribution
Booking Pattern Insights for Coimbra
- The most common availability pattern in Coimbra falls within the 271-366 days range, representing 41.1% of listings. This suggests many properties have significant open periods on their calendars.
- Approximately 75.2% of listings show high availability (181+ days open annually), indicating potential for increased bookings or specific owner usage patterns.
- For booked days, the 91-180 days range is most frequent in Coimbra (33.9%), reflecting common guest stay durations or potential owner blocking patterns.
- A notable 26.7% of properties secure long booking periods (181+ days booked per year), highlighting successful long-term rental strategies or significant owner usage.
Coimbra Airbnb Minimum Stay Requirements Analysis
Distribution of Listings by Minimum Night Requirement
1 Night
230 listings
42% of total
2 Nights
176 listings
32.1% of total
3 Nights
9 listings
1.6% of total
4-6 Nights
8 listings
1.5% of total
7-29 Nights
17 listings
3.1% of total
30+ Nights
108 listings
19.7% of total
Key Insights
- The most prevalent minimum stay requirement in Coimbra is 1 Night, adopted by 42% of listings. This highlights the market's preference for shorter, flexible bookings.
- A strong majority (74.1%) of the Coimbra Airbnb data shows acceptance of very short stays (1-2 nights), indicating a dynamic, high-turnover market.
- A significant segment (19.7%) caters to monthly stays (30+ nights) in Coimbra, pointing to opportunities in the extended-stay market.
Recommendations
- Align with the market by considering a 1 Night minimum stay, as 42% of Coimbra hosts use this setting.
- Explore offering discounts for stays of 30+ nights to attract the 19.7% of the market seeking extended stays.
- Adjust minimum nights based on seasonality – potentially shorter during low season and longer during peak demand periods in Coimbra.
Coimbra Airbnb Cancellation Policy Trends Analysis (2026)
Limited
1 listings
0.2% of total
Super Strict 60 Days
3 listings
0.5% of total
Super Strict 30 Days
2 listings
0.4% of total
Flexible
130 listings
23.7% of total
Moderate
176 listings
32.1% of total
Firm
169 listings
30.8% of total
Strict
67 listings
12.2% of total
Cancellation Policy Insights for Coimbra
- The prevailing Airbnb cancellation policy trend in Coimbra is Moderate, used by 32.1% of listings.
- There's a relatively balanced mix between guest-friendly (55.8%) and stricter (43.0%) policies, offering choices for different guest needs.
Recommendations for Hosts
- Consider adopting a Moderate policy to align with the 32.1% market standard in Coimbra.
- Using a Strict policy might deter some guests, as only 12.2% of listings use it. Evaluate if potential revenue protection outweighs possible lower booking rates.
- Regularly review your cancellation policy against competitors and market demand shifts in Coimbra.
Coimbra STR Booking Lead Time Analysis (2026)
Average Booking Lead Time by Month
Booking Lead Time Insights for Coimbra
- The overall average booking lead time for vacation rentals in Coimbra is 51 days.
- Guests book furthest in advance for stays during June (average 74 days), likely coinciding with peak travel demand or local events.
- The shortest booking windows occur for stays in February (average 30 days), indicating more last-minute travel plans during this time.
- Seasonally, Summer (61 days avg.) sees the longest lead times, while Winter (39 days avg.) has the shortest, reflecting typical travel planning cycles.
Recommendations for Hosts
- Use the overall average lead time (51 days) as a baseline for your pricing and availability strategy in Coimbra.
- For June stays, consider implementing length-of-stay discounts or slightly higher rates for bookings made less than 74 days out to capitalize on advance planning.
- Target marketing efforts for the Summer season well in advance (at least 61 days) to capture early planners.
- Monitor your own booking lead times against these Coimbra averages to identify opportunities for dynamic pricing adjustments.
Popular & Essential Airbnb Amenities in Coimbra (2026)
Amenity Prevalence
Amenity Insights for Coimbra
- Essential amenities in Coimbra that guests expect include: Wifi. Lacking these (this) could significantly impact bookings.
- Popular amenities like Hot water, TV, Fire extinguisher are common but not universal. Offering these can provide a competitive edge.
Recommendations for Hosts
- Ensure your listing includes all essential amenities for Coimbra: Wifi.
- Prioritize adding missing essentials: Wifi.
- Consider adding popular differentiators like Hot water or TV to increase appeal.
- Highlight unique or less common amenities you offer (e.g., hot tub, dedicated workspace, EV charger) in your listing description and photos.
- Regularly check competitor amenities in Coimbra to stay competitive.
Coimbra Airbnb Guest Demographics & Profile Analysis (2026)
Guest Profile Summary for Coimbra
- The typical guest profile for Airbnb in Coimbra consists of predominantly international visitors (91%), with top international origins including Canada, typically belonging to the Post-2000s (Gen Z/Alpha) group (50%), primarily speaking English or Spanish.
- Domestic travelers account for 8.9% of guests.
- Key international markets include United States (24.1%) and Canada (9.5%).
- Top languages spoken are English (40.7%) followed by Spanish (13.9%).
- A significant demographic segment is the Post-2000s (Gen Z/Alpha) group, representing 50% of guests.
Recommendations for Hosts
- Focus marketing internationally, particularly towards travelers from Canada.
- Tailor amenities and listing descriptions to appeal to the dominant Post-2000s (Gen Z/Alpha) demographic (e.g., highlight fast WiFi, smart home features, local guides).
- Highlight unique local experiences or amenities relevant to the primary guest profile.
- Consider seasonal promotions aligned with peak travel times for key origin markets.
Nearby Short-Term Rental Market Comparison
How does the Coimbra Airbnb market stack up against its neighbors? Compare key performance metrics like average monthly revenue, ADR, and occupancy rates in surrounding areas to understand the broader regional STR landscape.
| Market | Active Properties | Monthly Revenue | Daily Rate | Avg. Occupancy |
|---|---|---|---|---|
| Penhalonga e Paços de Gaiolo | 23 | $4,304 | $357.04 | 40% |
| Sande e São Lourenço do Douro | 19 | $3,009 | $319.97 | 37% |
| Reguengo Grande | 13 | $2,843 | $319.66 | 40% |
| Armamar | 66 | $2,578 | $266.43 | 36% |
| Alpendorada, Várzea e Torrão | 19 | $2,503 | $264.40 | 35% |
| Vila Boa de Quires e Maureles | 10 | $2,316 | $202.63 | 48% |
| Ribamar | 19 | $2,267 | $265.61 | 40% |
| Santa Bárbara | 24 | $2,115 | $273.89 | 38% |
| Alijó | 69 | $2,072 | $250.65 | 30% |
| Cinfães | 16 | $2,059 | $253.86 | 28% |