Olsztyn Airbnb Market Analysis 2026: Short Term Rental Data & Vacation Rental Statistics in Warmian-Masurian Voivodeship, Poland
Is Airbnb profitable in Olsztyn in 2026? Explore comprehensive Airbnb analytics for Olsztyn, Warmian-Masurian Voivodeship, Poland to uncover income potential. This 2026 STR market report for Olsztyn, based on AirROI data from February 2025 to January 2026, reveals key trends in the niche market of 141 active listings.
Whether you're considering an Airbnb investment in Olsztyn, optimizing your existing vacation rental, or exploring rental arbitrage opportunities, understanding the Olsztyn Airbnb data is crucial. Leveraging the low regulation environment is key to maximizing your short term rental income potential. Let's dive into the specifics.
Key Olsztyn Airbnb Performance Metrics Overview
Monthly Airbnb Revenue Variations & Income Potential in Olsztyn (2026)
Understanding the monthly revenue variations for Airbnb listings in Olsztyn is key to maximizing your short term rental income potential. Seasonality significantly impacts earnings. Our analysis, based on data from the past 12 months, shows that the peak revenue month for STRs in Olsztyn is typically July, while March often presents the lowest earnings, highlighting opportunities for strategic pricing adjustments during shoulder and low seasons. Explore the typical Airbnb income in Olsztyn across different performance tiers:
- Best-in-class properties (Top 10%) achieve $1,317+ monthly, often utilizing dynamic pricing and superior guest experiences.
- Strong performing properties (Top 25%) earn $895 or more, indicating effective management and desirable locations/amenities.
- Typical properties (Median) generate around $546 per month, representing the average market performance.
- Entry-level properties (Bottom 25%) see earnings around $308, often with potential for optimization.
Average Monthly Airbnb Earnings Trend in Olsztyn
Olsztyn Airbnb Occupancy Rate Trends (2026)
Maximize your bookings by understanding the Olsztyn STR occupancy trends. Seasonal demand shifts significantly influence how often properties are booked. Typically, Julysees the highest demand (peak season occupancy), while January experiences the lowest (low season). Effective strategies, like adjusting minimum stays or offering promotions, can boost occupancy during slower periods. Here's how different property tiers perform in Olsztyn:
- Best-in-class properties (Top 10%) achieve 65%+ occupancy, indicating high desirability and potentially optimized availability.
- Strong performing properties (Top 25%) maintain 43% or higher occupancy, suggesting good market fit and guest satisfaction.
- Typical properties (Median) have an occupancy rate around 26%.
- Entry-level properties (Bottom 25%) average 14% occupancy, potentially facing higher vacancy.
Average Monthly Occupancy Rate Trend in Olsztyn
Average Daily Rate (ADR) Airbnb Trends in Olsztyn (2026)
Effective short term rental pricing strategy in Olsztyn involves understanding monthly ADR fluctuations. The Average Daily Rate (ADR) for Airbnb in Olsztyn typically peaks in August and dips lowest during March. Leveraging Airbnb dynamic pricing tools or strategies based on this seasonality can significantly boost revenue. Here's a look at the typical nightly rates achieved:
- Best-in-class properties (Top 10%) command rates of $128+ per night, often due to premium features or locations.
- Strong performing properties (Top 25%) achieve nightly rates of $90 or more.
- Typical properties (Median) charge around $68 per night.
- Entry-level properties (Bottom 25%) earn around $53 per night.
Average Daily Rate (ADR) Trend by Month in Olsztyn
Get Live Olsztyn Market Intelligence 👇

Explore Real-time Analytics
Airbnb Seasonality Analysis & Trends in Olsztyn (2026)
Peak Season (July, August, June)
- Revenue averages $994 per month
- Occupancy rates average 38.3%
- Daily rates average $87
Shoulder Season
- Revenue averages $638 per month
- Occupancy maintains around 30.5%
- Daily rates hold near $83
Low Season (January, February, March)
- Revenue drops to average $452 per month
- Occupancy decreases to average 25.4%
- Daily rates adjust to average $78
Seasonality Insights for Olsztyn
- The Airbnb seasonality in Olsztyn shows highly seasonal trends requiring careful strategy. While the sections above show seasonal averages, it's also insightful to look at the extremes:
- During the high season, the absolute peak month showcases Olsztyn's highest earning potential, with monthly revenues capable of climbing to $1,096, occupancy reaching a high of 43.4%, and ADRs peaking at $94.
- Conversely, the slowest single month of the year, typically falling within the low season, marks the market's lowest point. In this month, revenue might dip to $433, occupancy could drop to 19.6%, and ADRs may adjust down to $73.
- Understanding both the seasonal averages and these monthly peaks and troughs in revenue, occupancy, and ADR is crucial for maximizing your Airbnb profit potential in Olsztyn.
Seasonal Strategies for Maximizing Profit
- Peak Season: Maximize revenue through premium pricing and potentially longer minimum stays. Ensure high availability.
- Low Season: Offer competitive pricing, special promotions (e.g., extended stay discounts), and flexible cancellation policies. Target off-season travelers like remote workers or budget-conscious guests.
- Shoulder Seasons: Implement dynamic pricing that balances peak and low rates. Target weekend travelers or specific events. Offer slightly more flexible terms than peak season.
- Regularly analyze your own performance against these Olsztyn seasonality benchmarks and adjust your pricing and availability strategy accordingly.
Best Areas for Airbnb Investment in Olsztyn (2026)
Exploring the top neighborhoods for short-term rentals in Olsztyn? This section highlights key areas, outlining why they are attractive for hosts and guests, along with notable local attractions. Consider these locations based on your target guest profile and investment strategy.
| Neighborhood / Area | Why Host Here? (Target Guests & Appeal) | Key Attractions & Landmarks |
|---|---|---|
| Old Town | Historic area with charming architecture, cobblestone streets, and a vibrant atmosphere. It's a favorite among tourists for its cafes, shops, and cultural sites. | Warmia Chapter Cathedral, Olsztyn Castle, Old Town Hall, Market Square, Castle Museum |
| Lake Ukiel | A beautiful lakeside area perfect for outdoor activities. Attracts tourists seeking relaxation and nature, with opportunities for swimming, kayaking, and cycling. | Lake Ukiel beaches, Cycling paths, Water sports, Nature trails, Picnic areas |
| Solaris Shopping Center | A central shopping hub with numerous shops and dining options. Attracts visitors for its modern amenities and entertainment options. | Various retail stores, Restaurants, Cafes, Cinema, Family entertainment center |
| Katedralna Hill | Offers stunning views of the city and the surrounding nature, making it popular among tourists and locals for walks and relaxation. | Scenic viewpoints, Parks, Walking paths, Cafes nearby, Historical significance |
| Municipal Stadium | Home to local sports events, it's an area frequented by sports fans and families visiting during games. | Stadium events, Nearby parks, Sports facilities, Food stalls, Community events |
| University of Warmia and Mazury | Vibrant area with a large student population. Attracts younger travelers and visitors for conferences and educational events. | University grounds, Student cafes, Libraries, Cultural events, Sports facilities |
| Zalew Olsztyński | A stunning reservoir perfect for summer activities, drawing both tourists and locals for relaxation and watersports. | Fishing spots, Recreational activities, Walking paths around the water, Boat rentals, Picnicking areas |
| Brzezówka Housing Estate | A quiet residential area known for its family-friendly atmosphere, popular among those seeking a peaceful retreat close to the city. | Family parks, Local shops, Community events, Quiet streets, Green spaces |
Understanding Airbnb License Requirements & STR Laws in Olsztyn (2026)
While Olsztyn, Warmian-Masurian Voivodeship, Poland currently shows low STR regulations, specific Airbnb license requirements might still exist or change. Always verify the latest short term rental regulations and Airbnb license requirements directly with local government authorities for Olsztyn to ensure full compliance before hosting.
(Source: AirROI data, 2026, finding no licensed listings among those analyzed)
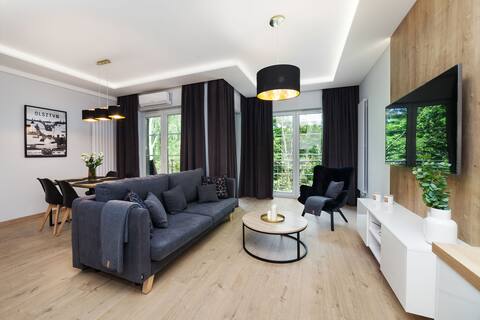
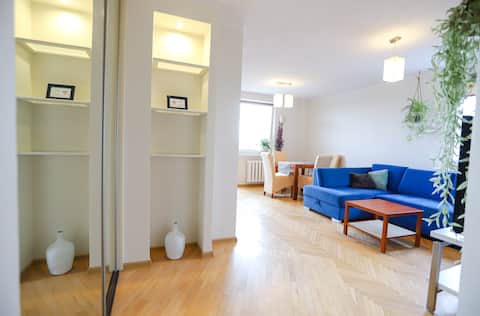
Top Performing Airbnb Properties in Olsztyn (2026)
Benchmark your potential! Explore examples of top-performing Airbnb properties in Olsztynbased on Trailing Twelve Month (TTM) revenue. Analyze their characteristics, revenue, occupancy rate, and ADR to understand what drives success in this market.

The Green Chairs Apartment — Center, Old Town
Entire Place • 1 bedroom

Warmia Orchard
Entire Place • 1 bedroom

Neptune 46 apartment - downtown, 2 bedrooms.
Entire Place • 2 bedrooms

Ukiel Apartment No9
Entire Place • 2 bedrooms
Villa Jana I
Entire Place • 1 bedroom
Zero noise, close to the beach and the Old Town - with a view
Entire Place • 2 bedrooms
Note: Performance varies based on location, size, amenities, seasonality, and management quality. Data reflects the past 12 months.
Top Performing Airbnb Hosts in Olsztyn (2026)
Learn from the best! This table showcases top-performing Airbnb hosts in Olsztyn based on the number of properties managed and estimated total revenue over the past year. Analyze their scale and performance metrics.
| Host Name | Properties | Grossing Revenue | Stay Reviews | Avg Rating |
|---|---|---|---|---|
| Dorota | 7 | $54,932 | 113 | 4.96/5.0 |
| Aleksandra | 10 | $42,230 | 130 | 4.94/5.0 |
| Sebastian | 3 | $35,340 | 42 | 5.00/5.0 |
| Ewa | 3 | $30,089 | 93 | 4.91/5.0 |
| Alicja | 4 | $29,307 | 206 | 4.90/5.0 |
| Paweł | 10 | $27,883 | 210 | 4.84/5.0 |
| Kacper | 1 | $25,250 | 33 | 4.97/5.0 |
| Marek Krzysztof | 4 | $24,590 | 156 | 4.84/5.0 |
| Grzegorz | 7 | $22,251 | 24 | 4.75/5.0 |
| Anna | 5 | $21,056 | 95 | 4.94/5.0 |
Analyzing the strategies of top hosts, such as their property selection, pricing, and guest communication, can offer valuable lessons for optimizing your own Airbnb operations in Olsztyn.
Dive Deeper: Advanced Olsztyn STR Market Data (2026)
Ready to unlock more insights? AirROI provides access to advanced metrics and comprehensive Airbnb data for Olsztyn. Explore detailed analytics beyond this report to refine your investment strategy, optimize pricing, and maximize your vacation rental profits.
Explore Advanced MetricsOlsztyn Short-Term Rental Market Composition (2026): Property & Room Types
Room Type Distribution
Property Type Distribution
Market Composition Insights for Olsztyn
- The Olsztyn Airbnb market composition is heavily skewed towards Entire Home/Apt listings, which make up 92.9% of the 141 active rentals. This indicates strong guest preference for privacy and space.
- Looking at the property type distribution in Olsztyn, Apartment/Condo properties are the most common (92.9%), reflecting the local real estate landscape.
- Smaller segments like others (combined 2.1%) offer potential for unique stay experiences.
Olsztyn Airbnb Room Capacity Analysis (2026): Bedroom Distribution
Distribution of Listings by Number of Bedrooms
Room Capacity Insights for Olsztyn
- The dominant room capacity in Olsztyn is 1 bedroom listings, making up 58.2% of the market. This suggests a strong demand for properties suitable for couples or solo travelers.
- Together, 1 bedroom and 2 bedrooms properties represent 83.0% of the active Airbnb listings in Olsztyn, indicating a high concentration in these sizes.
- With over half the market (58.2%) consisting of studios or 1-bedroom units, Olsztyn is particularly well-suited for individuals or couples.
- Listings with 3+ bedrooms (6.4%) represent a smaller niche, potentially indicating an underserved market for larger group accommodations in Olsztyn.
Olsztyn Vacation Rental Guest Capacity Trends (2026)
Distribution of Listings by Guest Capacity
Guest Capacity Insights for Olsztyn
- The most common guest capacity trend in Olsztyn vacation rentals is listings accommodating 4 guests (46.8%). This suggests the primary traveler segment is likely small families or groups.
- Properties designed for 4 guests and 2 guests dominate the Olsztyn STR market, accounting for 69.5% of listings.
- 14.8% of properties accommodate 6+ guests, serving the market segment for larger families or group travel in Olsztyn.
- On average, properties in Olsztyn are equipped to host 3.7 guests.
Olsztyn Airbnb Booking Patterns (2026): Available vs. Booked Days
Available Days Distribution
Booked Days Distribution
Booking Pattern Insights for Olsztyn
- The most common availability pattern in Olsztyn falls within the 271-366 days range, representing 68.8% of listings. This suggests many properties have significant open periods on their calendars.
- Approximately 94.3% of listings show high availability (181+ days open annually), indicating potential for increased bookings or specific owner usage patterns.
- For booked days, the 31-90 days range is most frequent in Olsztyn (37.6%), reflecting common guest stay durations or potential owner blocking patterns.
- A notable 5.7% of properties secure long booking periods (181+ days booked per year), highlighting successful long-term rental strategies or significant owner usage.
Olsztyn Airbnb Minimum Stay Requirements Analysis
Distribution of Listings by Minimum Night Requirement
1 Night
44 listings
31.2% of total
2 Nights
41 listings
29.1% of total
3 Nights
5 listings
3.5% of total
4-6 Nights
4 listings
2.8% of total
7-29 Nights
3 listings
2.1% of total
30+ Nights
44 listings
31.2% of total
Key Insights
- The most prevalent minimum stay requirement in Olsztyn is 1 Night, adopted by 31.2% of listings. This highlights the market's preference for shorter, flexible bookings.
- A strong majority (60.3%) of the Olsztyn Airbnb data shows acceptance of very short stays (1-2 nights), indicating a dynamic, high-turnover market.
- A significant segment (31.2%) caters to monthly stays (30+ nights) in Olsztyn, pointing to opportunities in the extended-stay market.
Recommendations
- Align with the market by considering a 1 Night minimum stay, as 31.2% of Olsztyn hosts use this setting.
- Explore offering discounts for stays of 30+ nights to attract the 31.2% of the market seeking extended stays.
- Adjust minimum nights based on seasonality – potentially shorter during low season and longer during peak demand periods in Olsztyn.
Olsztyn Airbnb Cancellation Policy Trends Analysis (2026)
Limited
2 listings
1.4% of total
Refundable
1 listings
0.7% of total
Non-refundable
2 listings
1.4% of total
Flexible
67 listings
47.9% of total
Moderate
45 listings
32.1% of total
Firm
22 listings
15.7% of total
Strict
1 listings
0.7% of total
Cancellation Policy Insights for Olsztyn
- The prevailing Airbnb cancellation policy trend in Olsztyn is Flexible, used by 47.9% of listings.
- The market strongly favors guest-friendly terms, with 80.0% of listings offering Flexible or Moderate policies. This suggests guests in Olsztyn may expect booking flexibility.
- Strict cancellation policies are quite rare (0.7%), potentially making listings with this policy less competitive unless justified by high demand or property type.
Recommendations for Hosts
- Consider adopting a Flexible policy to align with the 47.9% market standard in Olsztyn.
- Using a Strict policy might deter some guests, as only 0.7% of listings use it. Evaluate if potential revenue protection outweighs possible lower booking rates.
- Regularly review your cancellation policy against competitors and market demand shifts in Olsztyn.
Olsztyn STR Booking Lead Time Analysis (2026)
Average Booking Lead Time by Month
Booking Lead Time Insights for Olsztyn
- The overall average booking lead time for vacation rentals in Olsztyn is 41 days.
- Guests book furthest in advance for stays during August (average 79 days), likely coinciding with peak travel demand or local events.
- The shortest booking windows occur for stays in March (average 15 days), indicating more last-minute travel plans during this time.
- Seasonally, Summer (55 days avg.) sees the longest lead times, while Winter (24 days avg.) has the shortest, reflecting typical travel planning cycles.
Recommendations for Hosts
- Use the overall average lead time (41 days) as a baseline for your pricing and availability strategy in Olsztyn.
- For August stays, consider implementing length-of-stay discounts or slightly higher rates for bookings made less than 79 days out to capitalize on advance planning.
- Target marketing efforts for the Summer season well in advance (at least 55 days) to capture early planners.
- Monitor your own booking lead times against these Olsztyn averages to identify opportunities for dynamic pricing adjustments.
Popular & Essential Airbnb Amenities in Olsztyn (2026)
Amenity Prevalence
Amenity Insights for Olsztyn
- Essential amenities in Olsztyn that guests expect include: Wifi. Lacking these (this) could significantly impact bookings.
- Popular amenities like TV, Kitchen, Heating are common but not universal. Offering these can provide a competitive edge.
Recommendations for Hosts
- Ensure your listing includes all essential amenities for Olsztyn: Wifi.
- Prioritize adding missing essentials: Wifi.
- Consider adding popular differentiators like TV or Kitchen to increase appeal.
- Highlight unique or less common amenities you offer (e.g., hot tub, dedicated workspace, EV charger) in your listing description and photos.
- Regularly check competitor amenities in Olsztyn to stay competitive.
Olsztyn Airbnb Guest Demographics & Profile Analysis (2026)
Guest Profile Summary for Olsztyn
- The typical guest profile for Airbnb in Olsztyn consists of a mix of domestic (47%) and international guests, with top international origins including Germany, typically belonging to the Post-2000s (Gen Z/Alpha) group (50%), primarily speaking English or Polish.
- Domestic travelers account for 46.8% of guests.
- Key international markets include Poland (46.8%) and Germany (13.2%).
- Top languages spoken are English (38.5%) followed by Polish (24.9%).
- A significant demographic segment is the Post-2000s (Gen Z/Alpha) group, representing 50% of guests.
Recommendations for Hosts
- Balance marketing efforts between domestic and international channels based on the guest mix.
- Tailor amenities and listing descriptions to appeal to the dominant Post-2000s (Gen Z/Alpha) demographic (e.g., highlight fast WiFi, smart home features, local guides).
- Highlight unique local experiences or amenities relevant to the primary guest profile.
- Consider seasonal promotions aligned with peak travel times for key origin markets.
Nearby Short-Term Rental Market Comparison
How does the Olsztyn Airbnb market stack up against its neighbors? Compare key performance metrics like average monthly revenue, ADR, and occupancy rates in surrounding areas to understand the broader regional STR landscape.
| Market | Active Properties | Monthly Revenue | Daily Rate | Avg. Occupancy |
|---|---|---|---|---|
| Warsaw | 8,100 | $932 | $108.99 | 39% |
| Serock | 11 | $898 | $127.77 | 25% |
| Czerwonki | 12 | $852 | $148.69 | 29% |
| Pasym | 11 | $769 | $279.02 | 23% |
| Piaseczno | 15 | $756 | $104.25 | 28% |
| gmina Ryn | 12 | $690 | $217.78 | 32% |
| Ostróda | 25 | $682 | $127.40 | 26% |
| Siemiany | 15 | $631 | $212.89 | 23% |
| Krynica Morska | 66 | $609 | $191.80 | 23% |
| Żyrardów | 18 | $565 | $70.96 | 32% |