Rowy Airbnb Market Analysis 2026: Short Term Rental Data & Vacation Rental Statistics in Pomeranian Voivodeship, Poland
Is Airbnb profitable in Rowy in 2026? Explore comprehensive Airbnb analytics for Rowy, Pomeranian Voivodeship, Poland to uncover income potential. This 2026 STR market report for Rowy, based on AirROI data from February 2025 to January 2026, reveals key trends in the niche market of 57 active listings.
Whether you're considering an Airbnb investment in Rowy, optimizing your existing vacation rental, or exploring rental arbitrage opportunities, understanding the Rowy Airbnb data is crucial. Leveraging the low regulation environment is key to maximizing your short term rental income potential. Let's dive into the specifics.
Key Rowy Airbnb Performance Metrics Overview
Monthly Airbnb Revenue Variations & Income Potential in Rowy (2026)
Understanding the monthly revenue variations for Airbnb listings in Rowy is key to maximizing your short term rental income potential. Seasonality significantly impacts earnings. Our analysis, based on data from the past 12 months, shows that the peak revenue month for STRs in Rowy is typically July, while February often presents the lowest earnings, highlighting opportunities for strategic pricing adjustments during shoulder and low seasons. Explore the typical Airbnb income in Rowy across different performance tiers:
- Best-in-class properties (Top 10%) achieve $1,901+ monthly, often utilizing dynamic pricing and superior guest experiences.
- Strong performing properties (Top 25%) earn $1,380 or more, indicating effective management and desirable locations/amenities.
- Typical properties (Median) generate around $788 per month, representing the average market performance.
- Entry-level properties (Bottom 25%) see earnings around $399, often with potential for optimization.
Average Monthly Airbnb Earnings Trend in Rowy
Rowy Airbnb Occupancy Rate Trends (2026)
Maximize your bookings by understanding the Rowy STR occupancy trends. Seasonal demand shifts significantly influence how often properties are booked. Typically, Augustsees the highest demand (peak season occupancy), while January experiences the lowest (low season). Effective strategies, like adjusting minimum stays or offering promotions, can boost occupancy during slower periods. Here's how different property tiers perform in Rowy:
- Best-in-class properties (Top 10%) achieve 43%+ occupancy, indicating high desirability and potentially optimized availability.
- Strong performing properties (Top 25%) maintain 33% or higher occupancy, suggesting good market fit and guest satisfaction.
- Typical properties (Median) have an occupancy rate around 18%.
- Entry-level properties (Bottom 25%) average 10% occupancy, potentially facing higher vacancy.
Average Monthly Occupancy Rate Trend in Rowy
Average Daily Rate (ADR) Airbnb Trends in Rowy (2026)
Effective short term rental pricing strategy in Rowy involves understanding monthly ADR fluctuations. The Average Daily Rate (ADR) for Airbnb in Rowy typically peaks in January and dips lowest during April. Leveraging Airbnb dynamic pricing tools or strategies based on this seasonality can significantly boost revenue. Here's a look at the typical nightly rates achieved:
- Best-in-class properties (Top 10%) command rates of $197+ per night, often due to premium features or locations.
- Strong performing properties (Top 25%) achieve nightly rates of $159 or more.
- Typical properties (Median) charge around $139 per night.
- Entry-level properties (Bottom 25%) earn around $119 per night.
Average Daily Rate (ADR) Trend by Month in Rowy
Get Live Rowy Market Intelligence 👇

Explore Real-time Analytics
Airbnb Seasonality Analysis & Trends in Rowy (2026)
Peak Season (July, August, December)
- Revenue averages $1,598 per month
- Occupancy rates average 33.2%
- Daily rates average $154
Shoulder Season
- Revenue averages $863 per month
- Occupancy maintains around 20.6%
- Daily rates hold near $151
Low Season (February, April, November)
- Revenue drops to average $347 per month
- Occupancy decreases to average 9.1%
- Daily rates adjust to average $138
Seasonality Insights for Rowy
- The Airbnb seasonality in Rowy shows highly seasonal trends requiring careful strategy. While the sections above show seasonal averages, it's also insightful to look at the extremes:
- During the high season, the absolute peak month showcases Rowy's highest earning potential, with monthly revenues capable of climbing to $1,841, occupancy reaching a high of 40.6%, and ADRs peaking at $215.
- Conversely, the slowest single month of the year, typically falling within the low season, marks the market's lowest point. In this month, revenue might dip to $0, occupancy could drop to 0.0%, and ADRs may adjust down to $131.
- Understanding both the seasonal averages and these monthly peaks and troughs in revenue, occupancy, and ADR is crucial for maximizing your Airbnb profit potential in Rowy.
Seasonal Strategies for Maximizing Profit
- Peak Season: Maximize revenue through premium pricing and potentially longer minimum stays. Ensure high availability.
- Low Season: Offer competitive pricing, special promotions (e.g., extended stay discounts), and flexible cancellation policies. Target off-season travelers like remote workers or budget-conscious guests.
- Shoulder Seasons: Implement dynamic pricing that balances peak and low rates. Target weekend travelers or specific events. Offer slightly more flexible terms than peak season.
- Regularly analyze your own performance against these Rowy seasonality benchmarks and adjust your pricing and availability strategy accordingly.
Best Areas for Airbnb Investment in Rowy (2026)
Exploring the top neighborhoods for short-term rentals in Rowy? This section highlights key areas, outlining why they are attractive for hosts and guests, along with notable local attractions. Consider these locations based on your target guest profile and investment strategy.
| Neighborhood / Area | Why Host Here? (Target Guests & Appeal) | Key Attractions & Landmarks |
|---|---|---|
| Rowy Beach | Rowy Beach is known for its beautiful sandy shores and proximity to the Słowiński National Park, making it a serene getaway for families and nature lovers. | Słowiński National Park, Rowy Lighthouse, Rowy Beach Boardwalk, Local restaurants and cafes, Walking trails in nature |
| Center of Rowy | The center of Rowy offers easy access to shops, cafes, and local amenities, making it a convenient location for tourists looking to explore the area. | Local shops, Restaurants, Cultural events, Nearby parks, Weekly markets |
| Słupsk | Nearby city of Słupsk is a cultural hub with historical sites and interesting museums, appealing to those who want a mix of beach and city life. | Castle of the Dukes of Pomerania, Słupsk Cathedral, Museums, City parks, Cafes and bars |
| Łebsko Lake | Located near the picturesque Łebsko Lake, this area is perfect for water sports enthusiasts and nature lovers looking for a peaceful escape. | Lake Łebsko, Birdwatching, Fishing spots, Cycling routes, Picnic areas |
| Dębina | Dębina is a small village close to Rowy, known for its tranquility and close proximity to the beach, attracting those seeking a quiet retreat. | Quiet beaches, Rural landscapes, Local farms, Hiking trails, Nature exploration |
| Ustka | The popular seaside town of Ustka is close to Rowy and offers a bustling promenade, beach activities, and entertainment for all ages. | Ustka Beach, Promenade, Local seafood restaurants, Entertainment venues, Water sports |
| Czarna Dąbrówka | Czarna Dąbrówka provides a rural escape with beautiful forests and traditional Polish countryside, perfect for those searching for a unique experience. | Biking trails, Local folklore, Hiking, Nature reserves, Tranquil environment |
| Słowiński National Park | This national park is renowned for its shifting sand dunes and rich biodiversity, attracting nature lovers and adventurers looking to explore this natural wonder. | Shifting sand dunes, Unique flora and fauna, Nature trails, Beach access, Wildlife watching |
Understanding Airbnb License Requirements & STR Laws in Rowy (2026)
While Rowy, Pomeranian Voivodeship, Poland currently shows low STR regulations, specific Airbnb license requirements might still exist or change. Always verify the latest short term rental regulations and Airbnb license requirements directly with local government authorities for Rowy to ensure full compliance before hosting.
(Source: AirROI data, 2026, finding no licensed listings among those analyzed)
Top Performing Airbnb Properties in Rowy (2026)
Benchmark your potential! Explore examples of top-performing Airbnb properties in Rowybased on Trailing Twelve Month (TTM) revenue. Analyze their characteristics, revenue, occupancy rate, and ADR to understand what drives success in this market.

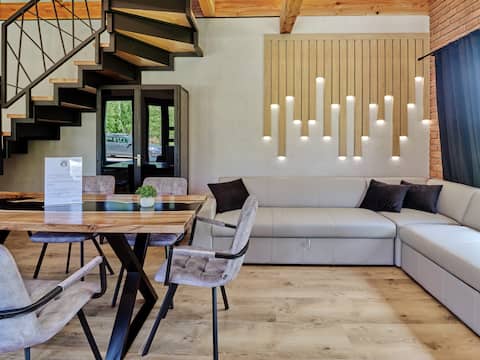
Aura Fold.
Entire Place • 5 bedrooms
Rowy Lofts Apartment 3
Entire Place • 2 bedrooms
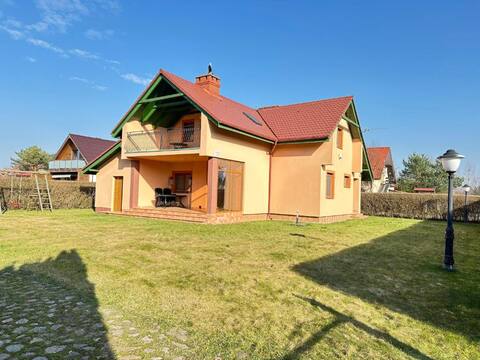
Year-round house by the sea in Rowy
Entire Place • 4 bedrooms
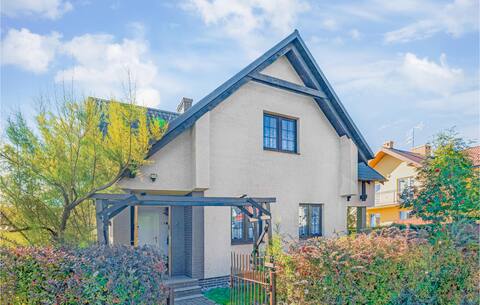
Beautiful home in Rowy with sauna
Entire Place • 4 bedrooms

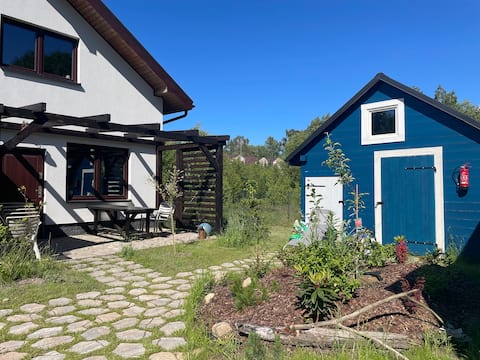
Domek NaturalnieTu
Entire Place • 2 bedrooms
NaturalnieTu
Entire Place • 2 bedrooms
Note: Performance varies based on location, size, amenities, seasonality, and management quality. Data reflects the past 12 months.
Top Performing Airbnb Hosts in Rowy (2026)
Learn from the best! This table showcases top-performing Airbnb hosts in Rowy based on the number of properties managed and estimated total revenue over the past year. Analyze their scale and performance metrics.
| Host Name | Properties | Grossing Revenue | Stay Reviews | Avg Rating |
|---|---|---|---|---|
| Łukasz | 19 | $68,413 | 54 | 5.00/5.0 |
| Maciej | 4 | $40,804 | 42 | 4.77/5.0 |
| Marta I Marcin | 3 | $31,471 | 16 | 4.93/5.0 |
| Michał | 1 | $28,671 | 20 | 4.85/5.0 |
| Sun & Snow | 6 | $28,200 | 9 | 4.33/5.0 |
| Paweł | 1 | $13,901 | 1 | Not Rated |
| Novasol | 1 | $12,456 | 3 | 5.00/5.0 |
| Leszek | 4 | $10,783 | 8 | 4.50/5.0 |
| Andrzej | 1 | $9,748 | 39 | 4.95/5.0 |
| Tom | 2 | $9,389 | 6 | 5.00/5.0 |
Analyzing the strategies of top hosts, such as their property selection, pricing, and guest communication, can offer valuable lessons for optimizing your own Airbnb operations in Rowy.
Dive Deeper: Advanced Rowy STR Market Data (2026)
Ready to unlock more insights? AirROI provides access to advanced metrics and comprehensive Airbnb data for Rowy. Explore detailed analytics beyond this report to refine your investment strategy, optimize pricing, and maximize your vacation rental profits.
Explore Advanced MetricsRowy Short-Term Rental Market Composition (2026): Property & Room Types
Room Type Distribution
Property Type Distribution
Market Composition Insights for Rowy
- The Rowy Airbnb market composition is heavily skewed towards Entire Home/Apt listings, which make up 96.5% of the 57 active rentals. This indicates strong guest preference for privacy and space.
- Looking at the property type distribution in Rowy, House properties are the most common (56.1%), reflecting the local real estate landscape.
- Houses represent a significant 56.1% portion, catering likely to families or larger groups.
- The presence of 8.8% Hotel/Boutique listings indicates integration with traditional hospitality.
- Smaller segments like others (combined 1.8%) offer potential for unique stay experiences.
Rowy Airbnb Room Capacity Analysis (2026): Bedroom Distribution
Distribution of Listings by Number of Bedrooms
Room Capacity Insights for Rowy
- The dominant room capacity in Rowy is 2 bedrooms listings, making up 52.6% of the market. This suggests a strong demand for properties suitable for couples or solo travelers.
- Together, 2 bedrooms and 1 bedroom properties represent 78.9% of the active Airbnb listings in Rowy, indicating a high concentration in these sizes.
Rowy Vacation Rental Guest Capacity Trends (2026)
Distribution of Listings by Guest Capacity
Guest Capacity Insights for Rowy
- The most common guest capacity trend in Rowy vacation rentals is listings accommodating 6 guests (38.6%). This suggests the primary traveler segment is likely larger groups.
- Properties designed for 6 guests and 5 guests dominate the Rowy STR market, accounting for 57.9% of listings.
- 61.4% of properties accommodate 6+ guests, serving the market segment for larger families or group travel in Rowy.
- On average, properties in Rowy are equipped to host 5.6 guests.
Rowy Airbnb Booking Patterns (2026): Available vs. Booked Days
Available Days Distribution
Booked Days Distribution
Booking Pattern Insights for Rowy
- The most common availability pattern in Rowy falls within the 271-366 days range, representing 94.7% of listings. This suggests many properties have significant open periods on their calendars.
- Approximately 100.0% of listings show high availability (181+ days open annually), indicating potential for increased bookings or specific owner usage patterns.
- For booked days, the 1-30 days range is most frequent in Rowy (57.9%), reflecting common guest stay durations or potential owner blocking patterns.
Rowy Airbnb Minimum Stay Requirements Analysis
Distribution of Listings by Minimum Night Requirement
1 Night
3 listings
5.3% of total
2 Nights
4 listings
7% of total
3 Nights
2 listings
3.5% of total
4-6 Nights
10 listings
17.5% of total
7-29 Nights
4 listings
7% of total
30+ Nights
34 listings
59.6% of total
Key Insights
- The most prevalent minimum stay requirement in Rowy is 30+ Nights, adopted by 59.6% of listings. This highlights the market's preference for longer commitments.
- Very short stays (1-2 nights) are less common (12.3%), suggesting hosts prefer slightly longer bookings to optimize turnover.
- A significant segment (59.6%) caters to monthly stays (30+ nights) in Rowy, pointing to opportunities in the extended-stay market.
Recommendations
- Align with the market by considering a 30+ Nights minimum stay, as 59.6% of Rowy hosts use this setting.
- If feasible, allowing 1-night stays, especially midweek or during low season, could capture last-minute bookings, as only 5.3% currently do.
- Explore offering discounts for stays of 30+ nights to attract the 59.6% of the market seeking extended stays.
- Adjust minimum nights based on seasonality – potentially shorter during low season and longer during peak demand periods in Rowy.
Rowy Airbnb Cancellation Policy Trends Analysis (2026)
Non-refundable
3 listings
5.3% of total
Refundable
1 listings
1.8% of total
Super Strict 60 Days
1 listings
1.8% of total
Flexible
7 listings
12.3% of total
Moderate
11 listings
19.3% of total
Firm
31 listings
54.4% of total
Strict
3 listings
5.3% of total
Cancellation Policy Insights for Rowy
- The prevailing Airbnb cancellation policy trend in Rowy is Firm, used by 54.4% of listings.
- A majority (59.7%) of hosts in Rowy utilize Firm or Strict policies, indicating a market where hosts prioritize booking security.
- Strict cancellation policies are quite rare (5.3%), potentially making listings with this policy less competitive unless justified by high demand or property type.
Recommendations for Hosts
- Consider adopting a Firm policy to align with the 54.4% market standard in Rowy.
- Using a Strict policy might deter some guests, as only 5.3% of listings use it. Evaluate if potential revenue protection outweighs possible lower booking rates.
- Regularly review your cancellation policy against competitors and market demand shifts in Rowy.
Rowy STR Booking Lead Time Analysis (2026)
Average Booking Lead Time by Month
Booking Lead Time Insights for Rowy
- The overall average booking lead time for vacation rentals in Rowy is 52 days.
- Guests book furthest in advance for stays during July (average 64 days), likely coinciding with peak travel demand or local events.
- The shortest booking windows occur for stays in November (average 0 days), indicating more last-minute travel plans during this time.
- Seasonally, Summer (54 days avg.) sees the longest lead times, while Fall (16 days avg.) has the shortest, reflecting typical travel planning cycles.
Recommendations for Hosts
- Use the overall average lead time (52 days) as a baseline for your pricing and availability strategy in Rowy.
- For July stays, consider implementing length-of-stay discounts or slightly higher rates for bookings made less than 64 days out to capitalize on advance planning.
- During November, focus on last-minute booking availability and promotions, as guests book with very short notice (0 days avg.).
- Target marketing efforts for the Summer season well in advance (at least 54 days) to capture early planners.
- Monitor your own booking lead times against these Rowy averages to identify opportunities for dynamic pricing adjustments.
Popular & Essential Airbnb Amenities in Rowy (2026)
Amenity Prevalence
Amenity Insights for Rowy
- Essential amenities in Rowy that guests expect include: TV. Lacking these (this) could significantly impact bookings.
- Popular amenities like Free parking on premises, Hot water, Bed linens are common but not universal. Offering these can provide a competitive edge.
Recommendations for Hosts
- Ensure your listing includes all essential amenities for Rowy: TV.
- Prioritize adding missing essentials: TV.
- Consider adding popular differentiators like Free parking on premises or Hot water to increase appeal.
- Highlight unique or less common amenities you offer (e.g., hot tub, dedicated workspace, EV charger) in your listing description and photos.
- Regularly check competitor amenities in Rowy to stay competitive.
Rowy Airbnb Guest Demographics & Profile Analysis (2026)
Guest Profile Summary for Rowy
- The typical guest profile for Airbnb in Rowy consists of predominantly international visitors (70%), with top international origins including Poland, typically belonging to the Post-2000s (Gen Z/Alpha) group (50%), primarily speaking English or German.
- Domestic travelers account for 30.4% of guests.
- Key international markets include Germany (45.7%) and Poland (30.4%).
- Top languages spoken are English (45.9%) followed by German (18.9%).
- A significant demographic segment is the Post-2000s (Gen Z/Alpha) group, representing 50% of guests.
Recommendations for Hosts
- Focus marketing internationally, particularly towards travelers from Poland.
- Tailor amenities and listing descriptions to appeal to the dominant Post-2000s (Gen Z/Alpha) demographic (e.g., highlight fast WiFi, smart home features, local guides).
- Highlight unique local experiences or amenities relevant to the primary guest profile.
- Consider seasonal promotions aligned with peak travel times for key origin markets.
Nearby Short-Term Rental Market Comparison
How does the Rowy Airbnb market stack up against its neighbors? Compare key performance metrics like average monthly revenue, ADR, and occupancy rates in surrounding areas to understand the broader regional STR landscape.
| Market | Active Properties | Monthly Revenue | Daily Rate | Avg. Occupancy |
|---|---|---|---|---|
| Odargowo | 10 | $1,341 | $205.47 | 31% |
| Dąbki | 10 | $1,285 | $159.97 | 29% |
| Wiślinka | 18 | $1,274 | $173.33 | 31% |
| Karwieńskie Błoto Drugie | 12 | $1,068 | $159.69 | 41% |
| Gdańsk | 4,759 | $1,004 | $163.31 | 35% |
| Sopot | 1,122 | $966 | $219.90 | 31% |
| Sasino | 23 | $809 | $168.26 | 25% |
| Gdynia | 800 | $756 | $147.97 | 33% |
| Jastarnia | 189 | $743 | $153.77 | 29% |
| Rozewie | 12 | $738 | $185.79 | 25% |