Krynica Morska Airbnb Market Analysis 2026: Short Term Rental Data & Vacation Rental Statistics in Pomeranian Voivodeship, Poland
Is Airbnb profitable in Krynica Morska in 2026? Explore comprehensive Airbnb analytics for Krynica Morska, Pomeranian Voivodeship, Poland to uncover income potential. This 2026 STR market report for Krynica Morska, based on AirROI data from February 2025 to January 2026, reveals key trends in the niche market of 66 active listings.
Whether you're considering an Airbnb investment in Krynica Morska, optimizing your existing vacation rental, or exploring rental arbitrage opportunities, understanding the Krynica Morska Airbnb data is crucial. Leveraging the low regulation environment is key to maximizing your short term rental income potential. Let's dive into the specifics.
Key Krynica Morska Airbnb Performance Metrics Overview
Monthly Airbnb Revenue Variations & Income Potential in Krynica Morska (2026)
Understanding the monthly revenue variations for Airbnb listings in Krynica Morska is key to maximizing your short term rental income potential. Seasonality significantly impacts earnings. Our analysis, based on data from the past 12 months, shows that the peak revenue month for STRs in Krynica Morska is typically April, while March often presents the lowest earnings, highlighting opportunities for strategic pricing adjustments during shoulder and low seasons. Explore the typical Airbnb income in Krynica Morska across different performance tiers:
- Best-in-class properties (Top 10%) achieve $2,023+ monthly, often utilizing dynamic pricing and superior guest experiences.
- Strong performing properties (Top 25%) earn $1,373 or more, indicating effective management and desirable locations/amenities.
- Typical properties (Median) generate around $741 per month, representing the average market performance.
- Entry-level properties (Bottom 25%) see earnings around $424, often with potential for optimization.
Average Monthly Airbnb Earnings Trend in Krynica Morska
Krynica Morska Airbnb Occupancy Rate Trends (2026)
Maximize your bookings by understanding the Krynica Morska STR occupancy trends. Seasonal demand shifts significantly influence how often properties are booked. Typically, Julysees the highest demand (peak season occupancy), while October experiences the lowest (low season). Effective strategies, like adjusting minimum stays or offering promotions, can boost occupancy during slower periods. Here's how different property tiers perform in Krynica Morska:
- Best-in-class properties (Top 10%) achieve 40%+ occupancy, indicating high desirability and potentially optimized availability.
- Strong performing properties (Top 25%) maintain 30% or higher occupancy, suggesting good market fit and guest satisfaction.
- Typical properties (Median) have an occupancy rate around 19%.
- Entry-level properties (Bottom 25%) average 10% occupancy, potentially facing higher vacancy.
Average Monthly Occupancy Rate Trend in Krynica Morska
Average Daily Rate (ADR) Airbnb Trends in Krynica Morska (2026)
Effective short term rental pricing strategy in Krynica Morska involves understanding monthly ADR fluctuations. The Average Daily Rate (ADR) for Airbnb in Krynica Morska typically peaks in January and dips lowest during November. Leveraging Airbnb dynamic pricing tools or strategies based on this seasonality can significantly boost revenue. Here's a look at the typical nightly rates achieved:
- Best-in-class properties (Top 10%) command rates of $253+ per night, often due to premium features or locations.
- Strong performing properties (Top 25%) achieve nightly rates of $203 or more.
- Typical properties (Median) charge around $140 per night.
- Entry-level properties (Bottom 25%) earn around $101 per night.
Average Daily Rate (ADR) Trend by Month in Krynica Morska
Get Live Krynica Morska Market Intelligence 👇
Explore Real-time Analytics
Airbnb Seasonality Analysis & Trends in Krynica Morska (2026)
Peak Season (April, May, July)
- Revenue averages $1,854 per month
- Occupancy rates average 24.0%
- Daily rates average $173
Shoulder Season
- Revenue averages $1,208 per month
- Occupancy maintains around 22.4%
- Daily rates hold near $187
Low Season (March, October, November)
- Revenue drops to average $642 per month
- Occupancy decreases to average 16.7%
- Daily rates adjust to average $155
Seasonality Insights for Krynica Morska
- The Airbnb seasonality in Krynica Morska shows highly seasonal trends requiring careful strategy. While the sections above show seasonal averages, it's also insightful to look at the extremes:
- During the high season, the absolute peak month showcases Krynica Morska's highest earning potential, with monthly revenues capable of climbing to $2,056, occupancy reaching a high of 35.5%, and ADRs peaking at $310.
- Conversely, the slowest single month of the year, typically falling within the low season, marks the market's lowest point. In this month, revenue might dip to $563, occupancy could drop to 14.5%, and ADRs may adjust down to $135.
- Understanding both the seasonal averages and these monthly peaks and troughs in revenue, occupancy, and ADR is crucial for maximizing your Airbnb profit potential in Krynica Morska.
Seasonal Strategies for Maximizing Profit
- Peak Season: Maximize revenue through premium pricing and potentially longer minimum stays. Ensure high availability.
- Low Season: Offer competitive pricing, special promotions (e.g., extended stay discounts), and flexible cancellation policies. Target off-season travelers like remote workers or budget-conscious guests.
- Shoulder Seasons: Implement dynamic pricing that balances peak and low rates. Target weekend travelers or specific events. Offer slightly more flexible terms than peak season.
- Regularly analyze your own performance against these Krynica Morska seasonality benchmarks and adjust your pricing and availability strategy accordingly.
Best Areas for Airbnb Investment in Krynica Morska (2026)
Exploring the top neighborhoods for short-term rentals in Krynica Morska? This section highlights key areas, outlining why they are attractive for hosts and guests, along with notable local attractions. Consider these locations based on your target guest profile and investment strategy.
| Neighborhood / Area | Why Host Here? (Target Guests & Appeal) | Key Attractions & Landmarks |
|---|---|---|
| Krynica Morska Beach | Popular seaside destination known for its sandy beaches and family-friendly atmosphere. Ideal for tourists looking to relax by the Baltic Sea and enjoy water activities. | Krynica Morska Beach, The Lighthouse in Krynica Morska, Water sports rentals, Sunset views, Seaside Promenade |
| Vistula Spit National Park | A beautiful natural reserve that offers scenic views and outdoor activities. It's perfect for nature lovers and hiking enthusiasts exploring the unique landscapes of the region. | Vistula Spit, Bird watching, Hiking trails, Natural wildlife, Ferry rides to the Spit |
| Góra Szwedów | A local mountain known for its panoramic views of the Bay of Gdańsk and surrounding areas. Great for tourists looking for outdoor adventure and breathtaking scenery. | Observation deck, Hiking trails, Biking routes, Photography spots |
| Town Center of Krynica Morska | The bustling heart of the town filled with shops, restaurants, and entertainment options. Great for visitors wanting to be in the middle of local culture and activities. | Local shops, Restaurants and cafes, Markets, Cultural events |
| Port of Krynica Morska | A picturesque port area that's perfect for enjoying seaside activities such as boat trips and seafood dining. Ideal for travelers seeking maritime experiences. | Boat tours, Fishing opportunities, Seafood restaurants |
| Krynica Morska Forests | Surrounding forests offer tranquility and nature walks. A perfect retreat for those looking to escape to nature while being close to the beach. | Nature trails, Picnic spots, Wildlife viewing |
| Amber Museum in Krynica Morska | A unique attraction showcasing the history and beauty of amber, appealing to tourists interested in local crafts and cultural experiences. | Exhibits on amber, Workshops, Local crafts |
| Nearby Attractions in Nowy Dwór Gdański | The proximity to this nearby town provides additional cultural and historical excursions for curious travelers. | Historical sites, City parks, Cafes and local eateries |
Understanding Airbnb License Requirements & STR Laws in Krynica Morska (2026)
While Krynica Morska, Pomeranian Voivodeship, Poland currently shows low STR regulations, specific Airbnb license requirements might still exist or change. Always verify the latest short term rental regulations and Airbnb license requirements directly with local government authorities for Krynica Morska to ensure full compliance before hosting.
(Source: AirROI data, 2026, finding no licensed listings among those analyzed)
Top Performing Airbnb Properties in Krynica Morska (2026)
Benchmark your potential! Explore examples of top-performing Airbnb properties in Krynica Morskabased on Trailing Twelve Month (TTM) revenue. Analyze their characteristics, revenue, occupancy rate, and ADR to understand what drives success in this market.
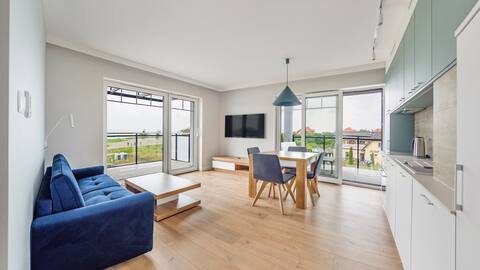
Port Krynica Apartment 17 Sun&Snow
Entire Place • 2 bedrooms

Port Krynica Apartment 14 Sun&Snow
Entire Place • 1 bedroom
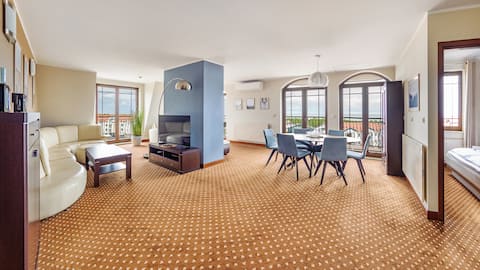
Continental Apartament A 56 Sun&Snow
Entire Place • 2 bedrooms
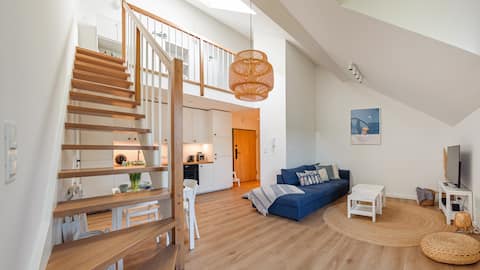
Nautikka Resort, Apartament B 7 Sun&Snow
Entire Place • 2 bedrooms
Nautikka Resort, Apartament A1 Sun&Snow
Entire Place • 1 bedroom

Port Krynica Apartment 26 Sun&Snow
Entire Place • 1 bedroom
Note: Performance varies based on location, size, amenities, seasonality, and management quality. Data reflects the past 12 months.
Top Performing Airbnb Hosts in Krynica Morska (2026)
Learn from the best! This table showcases top-performing Airbnb hosts in Krynica Morska based on the number of properties managed and estimated total revenue over the past year. Analyze their scale and performance metrics.
| Host Name | Properties | Grossing Revenue | Stay Reviews | Avg Rating |
|---|---|---|---|---|
| Sun & Snow | 42 | $393,579 | 85 | 4.70/5.0 |
| Arkadiusz | 7 | $26,667 | 24 | 4.70/5.0 |
| Tomasz | 1 | $10,943 | 9 | 4.78/5.0 |
| Kornelia | 2 | $8,630 | 5 | 5.00/5.0 |
| Aneta | 2 | $7,936 | 35 | 4.63/5.0 |
| Natalia | 1 | $6,882 | 1 | Not Rated |
| Beata | 1 | $6,162 | 1 | Not Rated |
| Łucja | 1 | $5,936 | 24 | 4.71/5.0 |
| Bozena | 1 | $4,195 | 2 | Not Rated |
| Zofia - Belvilla | 1 | $3,843 | 1 | Not Rated |
Analyzing the strategies of top hosts, such as their property selection, pricing, and guest communication, can offer valuable lessons for optimizing your own Airbnb operations in Krynica Morska.
Dive Deeper: Advanced Krynica Morska STR Market Data (2026)
Ready to unlock more insights? AirROI provides access to advanced metrics and comprehensive Airbnb data for Krynica Morska. Explore detailed analytics beyond this report to refine your investment strategy, optimize pricing, and maximize your vacation rental profits.
Explore Advanced MetricsKrynica Morska Short-Term Rental Market Composition (2026): Property & Room Types
Room Type Distribution
Property Type Distribution
Market Composition Insights for Krynica Morska
- The Krynica Morska Airbnb market composition is heavily skewed towards Entire Home/Apt listings, which make up 90.9% of the 66 active rentals. This indicates strong guest preference for privacy and space.
- Looking at the property type distribution in Krynica Morska, Apartment/Condo properties are the most common (87.9%), reflecting the local real estate landscape.
- Smaller segments like hotel/boutique, others (combined 6.0%) offer potential for unique stay experiences.
Krynica Morska Airbnb Room Capacity Analysis (2026): Bedroom Distribution
Distribution of Listings by Number of Bedrooms
Room Capacity Insights for Krynica Morska
- The dominant room capacity in Krynica Morska is 1 bedroom listings, making up 69.7% of the market. This suggests a strong demand for properties suitable for couples or solo travelers.
- Together, 1 bedroom and 2 bedrooms properties represent 89.4% of the active Airbnb listings in Krynica Morska, indicating a high concentration in these sizes.
- With over half the market (69.7%) consisting of studios or 1-bedroom units, Krynica Morska is particularly well-suited for individuals or couples.
Krynica Morska Vacation Rental Guest Capacity Trends (2026)
Distribution of Listings by Guest Capacity
Guest Capacity Insights for Krynica Morska
- The most common guest capacity trend in Krynica Morska vacation rentals is listings accommodating 4 guests (53%). This suggests the primary traveler segment is likely small families or groups.
- Properties designed for 4 guests and 6 guests dominate the Krynica Morska STR market, accounting for 78.8% of listings.
- 25.8% of properties accommodate 6+ guests, serving the market segment for larger families or group travel in Krynica Morska.
- On average, properties in Krynica Morska are equipped to host 4.3 guests.
Krynica Morska Airbnb Booking Patterns (2026): Available vs. Booked Days
Available Days Distribution
Booked Days Distribution
Booking Pattern Insights for Krynica Morska
- The most common availability pattern in Krynica Morska falls within the 271-366 days range, representing 95.5% of listings. This suggests many properties have significant open periods on their calendars.
- Approximately 100.0% of listings show high availability (181+ days open annually), indicating potential for increased bookings or specific owner usage patterns.
- For booked days, the 31-90 days range is most frequent in Krynica Morska (53%), reflecting common guest stay durations or potential owner blocking patterns.
Krynica Morska Airbnb Minimum Stay Requirements Analysis
Distribution of Listings by Minimum Night Requirement
1 Night
1 listings
1.5% of total
2 Nights
9 listings
13.6% of total
3 Nights
4 listings
6.1% of total
4-6 Nights
6 listings
9.1% of total
30+ Nights
46 listings
69.7% of total
Key Insights
- The most prevalent minimum stay requirement in Krynica Morska is 30+ Nights, adopted by 69.7% of listings. This highlights the market's preference for longer commitments.
- Very short stays (1-2 nights) are less common (15.1%), suggesting hosts prefer slightly longer bookings to optimize turnover.
- A significant segment (69.7%) caters to monthly stays (30+ nights) in Krynica Morska, pointing to opportunities in the extended-stay market.
Recommendations
- Align with the market by considering a 30+ Nights minimum stay, as 69.7% of Krynica Morska hosts use this setting.
- If feasible, allowing 1-night stays, especially midweek or during low season, could capture last-minute bookings, as only 1.5% currently do.
- Explore offering discounts for stays of 30+ nights to attract the 69.7% of the market seeking extended stays.
- Adjust minimum nights based on seasonality – potentially shorter during low season and longer during peak demand periods in Krynica Morska.
Krynica Morska Airbnb Cancellation Policy Trends Analysis (2026)
Flexible
7 listings
10.8% of total
Moderate
44 listings
67.7% of total
Firm
13 listings
20% of total
Strict
1 listings
1.5% of total
Cancellation Policy Insights for Krynica Morska
- The prevailing Airbnb cancellation policy trend in Krynica Morska is Moderate, used by 67.7% of listings.
- The market strongly favors guest-friendly terms, with 78.5% of listings offering Flexible or Moderate policies. This suggests guests in Krynica Morska may expect booking flexibility.
- Strict cancellation policies are quite rare (1.5%), potentially making listings with this policy less competitive unless justified by high demand or property type.
Recommendations for Hosts
- Consider adopting a Moderate policy to align with the 67.7% market standard in Krynica Morska.
- Using a Strict policy might deter some guests, as only 1.5% of listings use it. Evaluate if potential revenue protection outweighs possible lower booking rates.
- Regularly review your cancellation policy against competitors and market demand shifts in Krynica Morska.
Krynica Morska STR Booking Lead Time Analysis (2026)
Average Booking Lead Time by Month
Booking Lead Time Insights for Krynica Morska
- The overall average booking lead time for vacation rentals in Krynica Morska is 36 days.
- Guests book furthest in advance for stays during August (average 52 days), likely coinciding with peak travel demand or local events.
- The shortest booking windows occur for stays in March (average 9 days), indicating more last-minute travel plans during this time.
- Seasonally, Summer (38 days avg.) sees the longest lead times, while Spring (22 days avg.) has the shortest, reflecting typical travel planning cycles.
Recommendations for Hosts
- Use the overall average lead time (36 days) as a baseline for your pricing and availability strategy in Krynica Morska.
- For August stays, consider implementing length-of-stay discounts or slightly higher rates for bookings made less than 52 days out to capitalize on advance planning.
- During March, focus on last-minute booking availability and promotions, as guests book with very short notice (9 days avg.).
- Target marketing efforts for the Summer season well in advance (at least 38 days) to capture early planners.
- Monitor your own booking lead times against these Krynica Morska averages to identify opportunities for dynamic pricing adjustments.
Popular & Essential Airbnb Amenities in Krynica Morska (2026)
Amenity Prevalence
Amenity Insights for Krynica Morska
- Essential amenities in Krynica Morska that guests expect include: TV. Lacking these (this) could significantly impact bookings.
- Popular amenities like Heating, Iron, Hot water are common but not universal. Offering these can provide a competitive edge.
Recommendations for Hosts
- Ensure your listing includes all essential amenities for Krynica Morska: TV.
- Consider adding popular differentiators like Heating or Iron to increase appeal.
- Highlight unique or less common amenities you offer (e.g., hot tub, dedicated workspace, EV charger) in your listing description and photos.
- Regularly check competitor amenities in Krynica Morska to stay competitive.
Krynica Morska Airbnb Guest Demographics & Profile Analysis (2026)
Guest Profile Summary for Krynica Morska
- The typical guest profile for Airbnb in Krynica Morska consists of primarily domestic travelers (67%), often arriving from nearby Warsaw, typically belonging to the 1970s (Gen X) group (50%), primarily speaking English or Polish.
- Domestic travelers account for 66.7% of guests.
- Key international markets include Poland (66.7%) and Germany (22.2%).
- Top languages spoken are English (38.9%) followed by Polish (22.2%).
- A significant demographic segment is the Post-2000s (Gen Z/Alpha) group, representing 50% of guests.
Recommendations for Hosts
- Target domestic marketing efforts towards travelers from Warsaw and Jabłonna.
- Tailor amenities and listing descriptions to appeal to the dominant 1970s (Gen X) demographic (e.g., emphasize comfort, accessibility, clear instructions).
- Highlight unique local experiences or amenities relevant to the primary guest profile.
- Consider seasonal promotions aligned with peak travel times for key origin markets.
Nearby Short-Term Rental Market Comparison
How does the Krynica Morska Airbnb market stack up against its neighbors? Compare key performance metrics like average monthly revenue, ADR, and occupancy rates in surrounding areas to understand the broader regional STR landscape.
| Market | Active Properties | Monthly Revenue | Daily Rate | Avg. Occupancy |
|---|---|---|---|---|
| Odargowo | 10 | $1,341 | $205.47 | 31% |
| Wiślinka | 18 | $1,274 | $173.33 | 31% |
| Karwieńskie Błoto Drugie | 12 | $1,068 | $159.69 | 41% |
| Gdańsk | 4,759 | $1,004 | $163.31 | 35% |
| Sopot | 1,122 | $966 | $219.90 | 31% |
| Pasym | 11 | $769 | $279.02 | 23% |
| Gdynia | 800 | $756 | $147.97 | 33% |
| Jastarnia | 189 | $743 | $153.77 | 29% |
| Rozewie | 12 | $738 | $185.79 | 25% |
| Dębki | 24 | $694 | $167.48 | 28% |