Opole Airbnb Market Analysis 2026: Short Term Rental Data & Vacation Rental Statistics in Opole Voivodeship, Poland
Is Airbnb profitable in Opole in 2026? Explore comprehensive Airbnb analytics for Opole, Opole Voivodeship, Poland to uncover income potential. This 2026 STR market report for Opole, based on AirROI data from February 2025 to January 2026, reveals key trends in the niche market of 98 active listings.
Whether you're considering an Airbnb investment in Opole, optimizing your existing vacation rental, or exploring rental arbitrage opportunities, understanding the Opole Airbnb data is crucial. Leveraging the low regulation environment is key to maximizing your short term rental income potential. Let's dive into the specifics.
Key Opole Airbnb Performance Metrics Overview
Monthly Airbnb Revenue Variations & Income Potential in Opole (2026)
Understanding the monthly revenue variations for Airbnb listings in Opole is key to maximizing your short term rental income potential. Seasonality significantly impacts earnings. Our analysis, based on data from the past 12 months, shows that the peak revenue month for STRs in Opole is typically June, while November often presents the lowest earnings, highlighting opportunities for strategic pricing adjustments during shoulder and low seasons. Explore the typical Airbnb income in Opole across different performance tiers:
- Best-in-class properties (Top 10%) achieve $1,239+ monthly, often utilizing dynamic pricing and superior guest experiences.
- Strong performing properties (Top 25%) earn $787 or more, indicating effective management and desirable locations/amenities.
- Typical properties (Median) generate around $433 per month, representing the average market performance.
- Entry-level properties (Bottom 25%) see earnings around $221, often with potential for optimization.
Average Monthly Airbnb Earnings Trend in Opole
Opole Airbnb Occupancy Rate Trends (2026)
Maximize your bookings by understanding the Opole STR occupancy trends. Seasonal demand shifts significantly influence how often properties are booked. Typically, Augustsees the highest demand (peak season occupancy), while January experiences the lowest (low season). Effective strategies, like adjusting minimum stays or offering promotions, can boost occupancy during slower periods. Here's how different property tiers perform in Opole:
- Best-in-class properties (Top 10%) achieve 57%+ occupancy, indicating high desirability and potentially optimized availability.
- Strong performing properties (Top 25%) maintain 38% or higher occupancy, suggesting good market fit and guest satisfaction.
- Typical properties (Median) have an occupancy rate around 23%.
- Entry-level properties (Bottom 25%) average 12% occupancy, potentially facing higher vacancy.
Average Monthly Occupancy Rate Trend in Opole
Average Daily Rate (ADR) Airbnb Trends in Opole (2026)
Effective short term rental pricing strategy in Opole involves understanding monthly ADR fluctuations. The Average Daily Rate (ADR) for Airbnb in Opole typically peaks in June and dips lowest during October. Leveraging Airbnb dynamic pricing tools or strategies based on this seasonality can significantly boost revenue. Here's a look at the typical nightly rates achieved:
- Best-in-class properties (Top 10%) command rates of $111+ per night, often due to premium features or locations.
- Strong performing properties (Top 25%) achieve nightly rates of $85 or more.
- Typical properties (Median) charge around $65 per night.
- Entry-level properties (Bottom 25%) earn around $52 per night.
Average Daily Rate (ADR) Trend by Month in Opole
Get Live Opole Market Intelligence 👇

Explore Real-time Analytics
Airbnb Seasonality Analysis & Trends in Opole (2026)
Peak Season (June, August, May)
- Revenue averages $746 per month
- Occupancy rates average 31.2%
- Daily rates average $94
Shoulder Season
- Revenue averages $582 per month
- Occupancy maintains around 29.3%
- Daily rates hold near $85
Low Season (January, October, November)
- Revenue drops to average $416 per month
- Occupancy decreases to average 20.5%
- Daily rates adjust to average $81
Seasonality Insights for Opole
- The Airbnb seasonality in Opole shows moderate seasonality with distinct peak and low periods. While the sections above show seasonal averages, it's also insightful to look at the extremes:
- During the high season, the absolute peak month showcases Opole's highest earning potential, with monthly revenues capable of climbing to $807, occupancy reaching a high of 32.9%, and ADRs peaking at $99.
- Conversely, the slowest single month of the year, typically falling within the low season, marks the market's lowest point. In this month, revenue might dip to $400, occupancy could drop to 19.4%, and ADRs may adjust down to $80.
- Understanding both the seasonal averages and these monthly peaks and troughs in revenue, occupancy, and ADR is crucial for maximizing your Airbnb profit potential in Opole.
Seasonal Strategies for Maximizing Profit
- Peak Season: Maximize revenue through premium pricing and potentially longer minimum stays. Ensure high availability.
- Low Season: Offer competitive pricing, special promotions (e.g., extended stay discounts), and flexible cancellation policies. Target off-season travelers like remote workers or budget-conscious guests.
- Shoulder Seasons: Implement dynamic pricing that balances peak and low rates. Target weekend travelers or specific events. Offer slightly more flexible terms than peak season.
- Regularly analyze your own performance against these Opole seasonality benchmarks and adjust your pricing and availability strategy accordingly.
Best Areas for Airbnb Investment in Opole (2026)
Exploring the top neighborhoods for short-term rentals in Opole? This section highlights key areas, outlining why they are attractive for hosts and guests, along with notable local attractions. Consider these locations based on your target guest profile and investment strategy.
| Neighborhood / Area | Why Host Here? (Target Guests & Appeal) | Key Attractions & Landmarks |
|---|---|---|
| Old Town | Historical center of Opole, known for its charming architecture and vibrant atmosphere. Attracts tourists interested in culture, history, and local cuisine. | Opole Market Square, Cathedral of Opole, Opole Amphitheater, Museum of Opole Village, Piast Tower |
| Ostrówek Island | A picturesque area offering scenic views and a peaceful environment. Ideal for visitors looking for nature and relaxation, with easy access to walking trails and parks. | Ostrówek Lagoon, Nature trails, Water activities, Picnic areas |
| Zarzecze | A residential area popular for its tranquility and proximity to the lake. Appeals to families and those looking for outdoor activities and leisure. | Zarzecze Lake, Park at Zarzecze, Fishing spots, Nature walks |
| Książęca Street | A lively street known for its shops, cafes, and nightlife. A great spot for young travelers and those looking for an urban experience near amenities. | Cafes and restaurants, Local shops, Nightlife venues, Cultural events |
| Politechnika Opolska | The area around the university attracts students and visitors alike, perfect for budget-conscious travelers and those looking for a youthful atmosphere. | Student events, University facilities, Nearby cafes |
| Amfiteatr Opolski | Home to various cultural events and festivals, this area is ideal for tourists interested in music and arts, providing a vibrant cultural experience. | Opole Festival, Outdoor concerts, Art exhibitions |
| Grudzice | A quieter suburban area with access to nature, appealing to those who prefer a peaceful retreat while still being close to the city. | Nature parks, Walking routes, Local orchards |
| Bławatna Valley | A scenic valley known for its beautiful landscapes and outdoor activities. Attracts nature lovers and adventure seekers. | Hiking trails, Scenic views, Bicycle routes, Wildlife watching |
Understanding Airbnb License Requirements & STR Laws in Opole (2026)
While Opole, Opole Voivodeship, Poland currently shows low STR regulations, specific Airbnb license requirements might still exist or change. Always verify the latest short term rental regulations and Airbnb license requirements directly with local government authorities for Opole to ensure full compliance before hosting.
(Source: AirROI data, 2026, finding no licensed listings among those analyzed)
Top Performing Airbnb Properties in Opole (2026)
Benchmark your potential! Explore examples of top-performing Airbnb properties in Opolebased on Trailing Twelve Month (TTM) revenue. Analyze their characteristics, revenue, occupancy rate, and ADR to understand what drives success in this market.

Apartment in the heart of Opole 2
Entire Place • 2 bedrooms
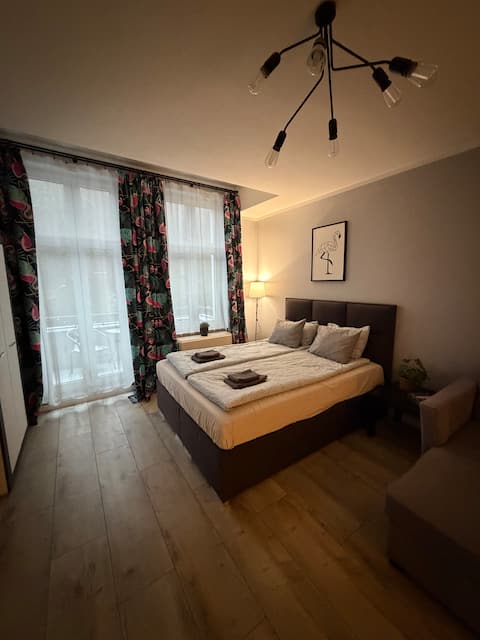
Flaming DeLuxe apartment with a balcony in the center
Entire Place • 1 bedroom
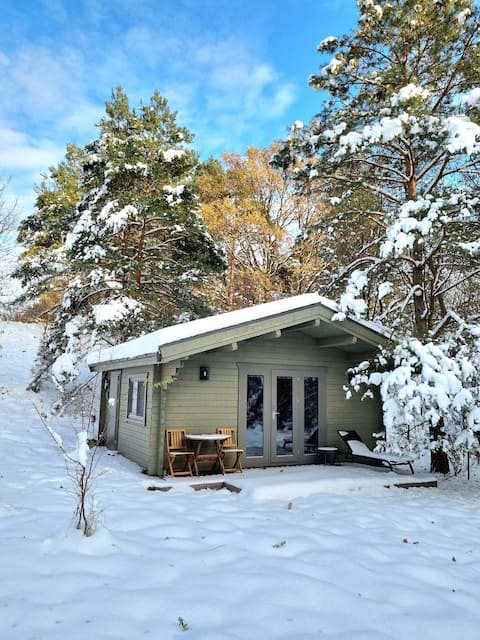
InTheWood Luxurious interiors and nature for exclusive use
Entire Place • N/A

Apartment in the heart of Opole 3
Entire Place • 2 bedrooms
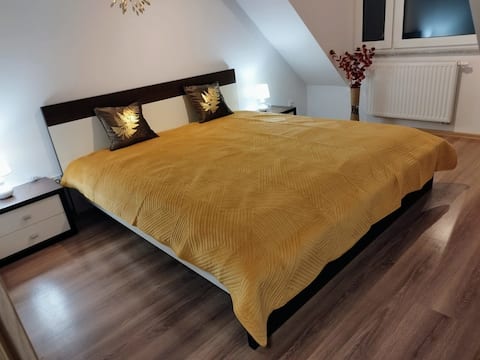
Dream Apartment 4 - Opole
Private Room • 2 bedrooms

Apartment building Opole 2
Entire Place • 1 bedroom
Note: Performance varies based on location, size, amenities, seasonality, and management quality. Data reflects the past 12 months.
Top Performing Airbnb Hosts in Opole (2026)
Learn from the best! This table showcases top-performing Airbnb hosts in Opole based on the number of properties managed and estimated total revenue over the past year. Analyze their scale and performance metrics.
| Host Name | Properties | Grossing Revenue | Stay Reviews | Avg Rating |
|---|---|---|---|---|
| Dorota | 31 | $126,015 | 208 | 4.35/5.0 |
| Wioletta | 4 | $66,312 | 98 | 4.99/5.0 |
| Robert | 8 | $59,533 | 25 | 4.80/5.0 |
| Apartamenty Słoneczne | 12 | $51,970 | 92 | 4.31/5.0 |
| Recepcja | 16 | $42,234 | 112 | 4.71/5.0 |
| Łukasz | 1 | $19,835 | 26 | 4.85/5.0 |
| Alexandra I Marek | 1 | $17,614 | 188 | 4.97/5.0 |
| Inwest | 5 | $14,604 | 33 | 4.37/5.0 |
| Engapol Grupa Energetyczna Sp | 3 | $9,044 | 63 | 4.93/5.0 |
| Siarhei | 1 | $7,047 | 61 | 4.97/5.0 |
Analyzing the strategies of top hosts, such as their property selection, pricing, and guest communication, can offer valuable lessons for optimizing your own Airbnb operations in Opole.
Dive Deeper: Advanced Opole STR Market Data (2026)
Ready to unlock more insights? AirROI provides access to advanced metrics and comprehensive Airbnb data for Opole. Explore detailed analytics beyond this report to refine your investment strategy, optimize pricing, and maximize your vacation rental profits.
Explore Advanced MetricsOpole Short-Term Rental Market Composition (2026): Property & Room Types
Room Type Distribution
Property Type Distribution
Market Composition Insights for Opole
- The Opole Airbnb market composition is heavily skewed towards Entire Home/Apt listings, which make up 71.4% of the 98 active rentals. This indicates strong guest preference for privacy and space.
- Looking at the property type distribution in Opole, Apartment/Condo properties are the most common (85.7%), reflecting the local real estate landscape.
- The presence of 12.2% Hotel/Boutique listings indicates integration with traditional hospitality.
- Smaller segments like house (combined 2.0%) offer potential for unique stay experiences.
Opole Airbnb Room Capacity Analysis (2026): Bedroom Distribution
Distribution of Listings by Number of Bedrooms
Room Capacity Insights for Opole
- The dominant room capacity in Opole is 1 bedroom listings, making up 65.3% of the market. This suggests a strong demand for properties suitable for couples or solo travelers.
- Together, 1 bedroom and 2 bedrooms properties represent 89.8% of the active Airbnb listings in Opole, indicating a high concentration in these sizes.
- With over half the market (65.3%) consisting of studios or 1-bedroom units, Opole is particularly well-suited for individuals or couples.
- Listings with 3+ bedrooms (3.1%) represent a smaller niche, potentially indicating an underserved market for larger group accommodations in Opole.
Opole Vacation Rental Guest Capacity Trends (2026)
Distribution of Listings by Guest Capacity
Guest Capacity Insights for Opole
- The most common guest capacity trend in Opole vacation rentals is listings accommodating 2 guests (38.8%). This suggests the primary traveler segment is likely couples or solo travelers.
- Properties designed for 2 guests and 4 guests dominate the Opole STR market, accounting for 66.4% of listings.
- A significant 42.9% of listings cater specifically to 1-2 guests, highlighting strong demand from couples and solo travelers in Opole.
- 13.3% of properties accommodate 6+ guests, serving the market segment for larger families or group travel in Opole.
- On average, properties in Opole are equipped to host 3.3 guests.
Opole Airbnb Booking Patterns (2026): Available vs. Booked Days
Available Days Distribution
Booked Days Distribution
Booking Pattern Insights for Opole
- The most common availability pattern in Opole falls within the 271-366 days range, representing 78.6% of listings. This suggests many properties have significant open periods on their calendars.
- Approximately 94.9% of listings show high availability (181+ days open annually), indicating potential for increased bookings or specific owner usage patterns.
- For booked days, the 31-90 days range is most frequent in Opole (55.1%), reflecting common guest stay durations or potential owner blocking patterns.
- A notable 5.1% of properties secure long booking periods (181+ days booked per year), highlighting successful long-term rental strategies or significant owner usage.
Opole Airbnb Minimum Stay Requirements Analysis
Distribution of Listings by Minimum Night Requirement
1 Night
75 listings
76.5% of total
2 Nights
6 listings
6.1% of total
4-6 Nights
10 listings
10.2% of total
30+ Nights
7 listings
7.1% of total
Key Insights
- The most prevalent minimum stay requirement in Opole is 1 Night, adopted by 76.5% of listings. This highlights the market's preference for shorter, flexible bookings.
- A strong majority (82.6%) of the Opole Airbnb data shows acceptance of very short stays (1-2 nights), indicating a dynamic, high-turnover market.
Recommendations
- Align with the market by considering a 1 Night minimum stay, as 76.5% of Opole hosts use this setting.
- Explore offering discounts for stays of 30+ nights to attract the 7.1% of the market seeking extended stays.
- Adjust minimum nights based on seasonality – potentially shorter during low season and longer during peak demand periods in Opole.
Opole Airbnb Cancellation Policy Trends Analysis (2026)
Refundable
12 listings
12.4% of total
Limited
1 listings
1% of total
Non-refundable
13 listings
13.4% of total
Flexible
35 listings
36.1% of total
Moderate
22 listings
22.7% of total
Firm
4 listings
4.1% of total
Strict
10 listings
10.3% of total
Cancellation Policy Insights for Opole
- The prevailing Airbnb cancellation policy trend in Opole is Flexible, used by 36.1% of listings.
- There's a relatively balanced mix between guest-friendly (58.8%) and stricter (14.4%) policies, offering choices for different guest needs.
Recommendations for Hosts
- Consider adopting a Flexible policy to align with the 36.1% market standard in Opole.
- Using a Strict policy might deter some guests, as only 10.3% of listings use it. Evaluate if potential revenue protection outweighs possible lower booking rates.
- Regularly review your cancellation policy against competitors and market demand shifts in Opole.
Opole STR Booking Lead Time Analysis (2026)
Average Booking Lead Time by Month
Booking Lead Time Insights for Opole
- The overall average booking lead time for vacation rentals in Opole is 27 days.
- Guests book furthest in advance for stays during June (average 44 days), likely coinciding with peak travel demand or local events.
- The shortest booking windows occur for stays in March (average 12 days), indicating more last-minute travel plans during this time.
- Seasonally, Summer (38 days avg.) sees the longest lead times, while Winter (16 days avg.) has the shortest, reflecting typical travel planning cycles.
Recommendations for Hosts
- Use the overall average lead time (27 days) as a baseline for your pricing and availability strategy in Opole.
- For June stays, consider implementing length-of-stay discounts or slightly higher rates for bookings made less than 44 days out to capitalize on advance planning.
- During March, focus on last-minute booking availability and promotions, as guests book with very short notice (12 days avg.).
- Target marketing efforts for the Summer season well in advance (at least 38 days) to capture early planners.
- Monitor your own booking lead times against these Opole averages to identify opportunities for dynamic pricing adjustments.
Popular & Essential Airbnb Amenities in Opole (2026)
Amenity Prevalence
Amenity Insights for Opole
- Popular amenities like Wifi, Iron, TV are common but not universal. Offering these can provide a competitive edge.
- Warning: Wifi is not universally provided but is considered essential globally. Ensure reliable Wifi is offered.
Recommendations for Hosts
- Consider adding popular differentiators like Wifi or Iron to increase appeal.
- Highlight unique or less common amenities you offer (e.g., hot tub, dedicated workspace, EV charger) in your listing description and photos.
- Regularly check competitor amenities in Opole to stay competitive.
Opole Airbnb Guest Demographics & Profile Analysis (2026)
Guest Profile Summary for Opole
- The typical guest profile for Airbnb in Opole consists of a mix of domestic (40%) and international guests, with top international origins including Germany, typically belonging to the Post-2000s (Gen Z/Alpha) group (50%), primarily speaking English or Polish.
- Domestic travelers account for 39.7% of guests.
- Key international markets include Poland (39.7%) and Germany (24.8%).
- Top languages spoken are English (36.8%) followed by Polish (23.4%).
- A significant demographic segment is the Post-2000s (Gen Z/Alpha) group, representing 50% of guests.
Recommendations for Hosts
- Focus marketing internationally, particularly towards travelers from Germany.
- Tailor amenities and listing descriptions to appeal to the dominant Post-2000s (Gen Z/Alpha) demographic (e.g., highlight fast WiFi, smart home features, local guides).
- Highlight unique local experiences or amenities relevant to the primary guest profile.
- Consider seasonal promotions aligned with peak travel times for key origin markets.
Nearby Short-Term Rental Market Comparison
How does the Opole Airbnb market stack up against its neighbors? Compare key performance metrics like average monthly revenue, ADR, and occupancy rates in surrounding areas to understand the broader regional STR landscape.
| Market | Active Properties | Monthly Revenue | Daily Rate | Avg. Occupancy |
|---|---|---|---|---|
| Brenna | 29 | $2,549 | $334.28 | 28% |
| Istebna | 11 | $1,862 | $225.92 | 34% |
| Kamienica | 11 | $1,538 | $197.92 | 28% |
| Frýdlant nad Ostravicí | 12 | $1,523 | $222.28 | 35% |
| Lísek | 10 | $1,434 | $132.93 | 39% |
| Litomyšl | 20 | $1,351 | $113.96 | 36% |
| Stara Morawa | 10 | $1,260 | $215.61 | 28% |
| Koniaków | 12 | $1,217 | $207.34 | 24% |
| Bělá pod Pradědem | 10 | $1,199 | $146.70 | 31% |
| Brno | 542 | $1,102 | $101.57 | 44% |