Polanica-Zdrój Airbnb Market Analysis 2026: Short Term Rental Data & Vacation Rental Statistics in Lower Silesian Voivodeship, Poland
Is Airbnb profitable in Polanica-Zdrój in 2026? Explore comprehensive Airbnb analytics for Polanica-Zdrój, Lower Silesian Voivodeship, Poland to uncover income potential. This 2026 STR market report for Polanica-Zdrój, based on AirROI data from February 2025 to January 2026, reveals key trends in the niche market of 86 active listings.
Whether you're considering an Airbnb investment in Polanica-Zdrój, optimizing your existing vacation rental, or exploring rental arbitrage opportunities, understanding the Polanica-Zdrój Airbnb data is crucial. Leveraging the low regulation environment is key to maximizing your short term rental income potential. Let's dive into the specifics.
Key Polanica-Zdrój Airbnb Performance Metrics Overview
Monthly Airbnb Revenue Variations & Income Potential in Polanica-Zdrój (2026)
Understanding the monthly revenue variations for Airbnb listings in Polanica-Zdrój is key to maximizing your short term rental income potential. Seasonality significantly impacts earnings. Our analysis, based on data from the past 12 months, shows that the peak revenue month for STRs in Polanica-Zdrój is typically October, while March often presents the lowest earnings, highlighting opportunities for strategic pricing adjustments during shoulder and low seasons. Explore the typical Airbnb income in Polanica-Zdrój across different performance tiers:
- Best-in-class properties (Top 10%) achieve $2,186+ monthly, often utilizing dynamic pricing and superior guest experiences.
- Strong performing properties (Top 25%) earn $1,193 or more, indicating effective management and desirable locations/amenities.
- Typical properties (Median) generate around $670 per month, representing the average market performance.
- Entry-level properties (Bottom 25%) see earnings around $352, often with potential for optimization.
Average Monthly Airbnb Earnings Trend in Polanica-Zdrój
Polanica-Zdrój Airbnb Occupancy Rate Trends (2026)
Maximize your bookings by understanding the Polanica-Zdrój STR occupancy trends. Seasonal demand shifts significantly influence how often properties are booked. Typically, Augustsees the highest demand (peak season occupancy), while November experiences the lowest (low season). Effective strategies, like adjusting minimum stays or offering promotions, can boost occupancy during slower periods. Here's how different property tiers perform in Polanica-Zdrój:
- Best-in-class properties (Top 10%) achieve 46%+ occupancy, indicating high desirability and potentially optimized availability.
- Strong performing properties (Top 25%) maintain 33% or higher occupancy, suggesting good market fit and guest satisfaction.
- Typical properties (Median) have an occupancy rate around 21%.
- Entry-level properties (Bottom 25%) average 12% occupancy, potentially facing higher vacancy.
Average Monthly Occupancy Rate Trend in Polanica-Zdrój
Average Daily Rate (ADR) Airbnb Trends in Polanica-Zdrój (2026)
Effective short term rental pricing strategy in Polanica-Zdrój involves understanding monthly ADR fluctuations. The Average Daily Rate (ADR) for Airbnb in Polanica-Zdrój typically peaks in November and dips lowest during June. Leveraging Airbnb dynamic pricing tools or strategies based on this seasonality can significantly boost revenue. Here's a look at the typical nightly rates achieved:
- Best-in-class properties (Top 10%) command rates of $333+ per night, often due to premium features or locations.
- Strong performing properties (Top 25%) achieve nightly rates of $175 or more.
- Typical properties (Median) charge around $116 per night.
- Entry-level properties (Bottom 25%) earn around $81 per night.
Average Daily Rate (ADR) Trend by Month in Polanica-Zdrój
Get Live Polanica-Zdrój Market Intelligence 👇

Explore Real-time Analytics
Airbnb Seasonality Analysis & Trends in Polanica-Zdrój (2026)
Peak Season (October, August, December)
- Revenue averages $1,195 per month
- Occupancy rates average 23.9%
- Daily rates average $221
Shoulder Season
- Revenue averages $1,006 per month
- Occupancy maintains around 25.0%
- Daily rates hold near $181
Low Season (March, April, June)
- Revenue drops to average $709 per month
- Occupancy decreases to average 21.8%
- Daily rates adjust to average $106
Seasonality Insights for Polanica-Zdrój
- The Airbnb seasonality in Polanica-Zdrój shows moderate seasonality with distinct peak and low periods. While the sections above show seasonal averages, it's also insightful to look at the extremes:
- During the high season, the absolute peak month showcases Polanica-Zdrój's highest earning potential, with monthly revenues capable of climbing to $1,247, occupancy reaching a high of 34.3%, and ADRs peaking at $297.
- Conversely, the slowest single month of the year, typically falling within the low season, marks the market's lowest point. In this month, revenue might dip to $597, occupancy could drop to 17.7%, and ADRs may adjust down to $103.
- Understanding both the seasonal averages and these monthly peaks and troughs in revenue, occupancy, and ADR is crucial for maximizing your Airbnb profit potential in Polanica-Zdrój.
Seasonal Strategies for Maximizing Profit
- Peak Season: Maximize revenue through premium pricing and potentially longer minimum stays. Ensure high availability.
- Low Season: Offer competitive pricing, special promotions (e.g., extended stay discounts), and flexible cancellation policies. Target off-season travelers like remote workers or budget-conscious guests.
- Shoulder Seasons: Implement dynamic pricing that balances peak and low rates. Target weekend travelers or specific events. Offer slightly more flexible terms than peak season.
- Regularly analyze your own performance against these Polanica-Zdrój seasonality benchmarks and adjust your pricing and availability strategy accordingly.
Best Areas for Airbnb Investment in Polanica-Zdrój (2026)
Exploring the top neighborhoods for short-term rentals in Polanica-Zdrój? This section highlights key areas, outlining why they are attractive for hosts and guests, along with notable local attractions. Consider these locations based on your target guest profile and investment strategy.
| Neighborhood / Area | Why Host Here? (Target Guests & Appeal) | Key Attractions & Landmarks |
|---|---|---|
| Park Zdrojowy | Central park area known for its therapeutic mineral waters and beautiful gardens. Popular among health-seeking tourists and those enjoying nature walks. | Spa houses, Mineral water springs, Walking paths, Gardens, Concert pavilion |
| Kłodzka Gate | Historic area with beautiful architecture and views of the surrounding hills. Attracts tourists interested in history and culture. | Kłodzka Gate, Church of St. John, Historic tenement houses, Local shops, Cafes |
| Health Resort District | A hub for various health and wellness facilities, attracting visitors seeking relaxation and treatments. | Thermal baths, Wellness centers, Health resorts, Fitness activities, Natural therapies |
| Local Market Square | Vibrant local market area with shops and eateries, perfect for those wanting to experience local culture and food. | Local markets, Restaurants, Cafes, Cultural events, Artisan shops |
| Nature Trails | Surrounding nature areas with hiking and biking trails, ideal for outdoor enthusiasts and families. | Hiking trails, Biking routes, Natural parks, Scenic views, Wildlife observation |
| Cultural Heritage Sites | Areas rich in history and tradition, attracting those interested in Poland's cultural background. | Historic buildings, Cultural events, Museum exhibits, Local crafts, Guided tours |
| Winter Sports Zones | Nearby ski areas attracting winter sports enthusiasts and tourists seeking snow-related activities. | Ski slopes, Snowboarding, Winter hiking, Ski schools, Equipment rentals |
| Local Events and Festivals | Regularly hosts events and festivals, drawing tourists interested in the local community and celebrations. | Seasonal festivals, Local food fairs, Cultural celebrations, Art events, Musical performances |
Understanding Airbnb License Requirements & STR Laws in Polanica-Zdrój (2026)
While Polanica-Zdrój, Lower Silesian Voivodeship, Poland currently shows low STR regulations, specific Airbnb license requirements might still exist or change. Always verify the latest short term rental regulations and Airbnb license requirements directly with local government authorities for Polanica-Zdrój to ensure full compliance before hosting.
(Source: AirROI data, 2026, finding no licensed listings among those analyzed)
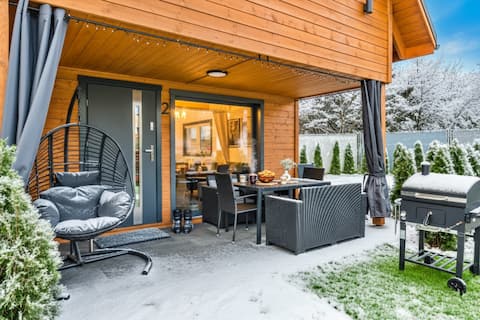
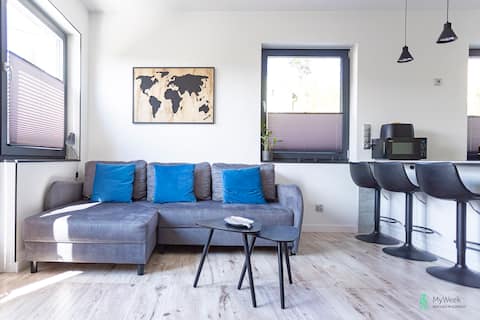
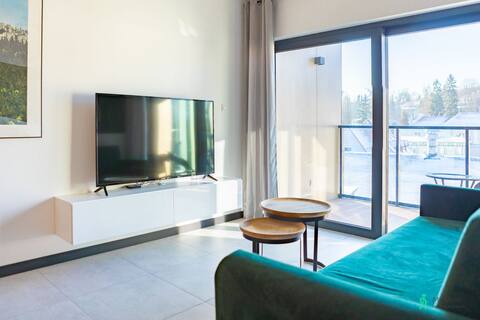
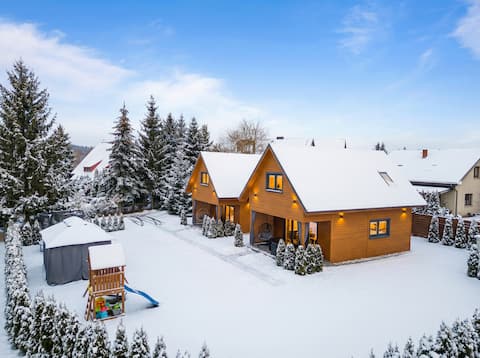
Top Performing Airbnb Properties in Polanica-Zdrój (2026)
Benchmark your potential! Explore examples of top-performing Airbnb properties in Polanica-Zdrójbased on Trailing Twelve Month (TTM) revenue. Analyze their characteristics, revenue, occupancy rate, and ADR to understand what drives success in this market.
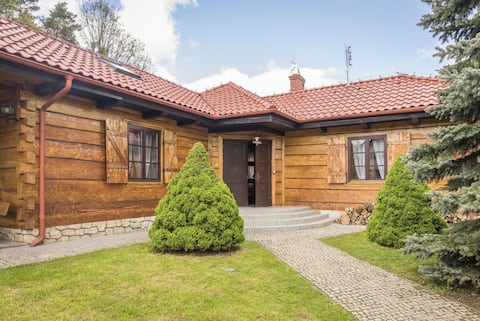
Hillside Home, MyWeek
Entire Place • 3 bedrooms
Pets OK•600m2 Fenced Garden•EV•fireplace•10min Forest
Entire Place • 2 bedrooms
Windy Hills, Polanica-Zdrój
Entire Place • 4 bedrooms
Wood and SPA sauna, Pieniawskie Gardens, MyWeek
Entire Place • 3 bedrooms
600 sqm garden + gate • 15 min to forest • Wi-Fi 600 MBs
Entire Place • 2 bedrooms

Apartment near Piekielna Góra, Polanica, MyWeek
Entire Place • 2 bedrooms
Note: Performance varies based on location, size, amenities, seasonality, and management quality. Data reflects the past 12 months.
Top Performing Airbnb Hosts in Polanica-Zdrój (2026)
Learn from the best! This table showcases top-performing Airbnb hosts in Polanica-Zdrój based on the number of properties managed and estimated total revenue over the past year. Analyze their scale and performance metrics.
| Host Name | Properties | Grossing Revenue | Stay Reviews | Avg Rating |
|---|---|---|---|---|
| Agnieszka | 44 | $281,427 | 198 | 4.69/5.0 |
| Aneta | 2 | $47,659 | 23 | 4.95/5.0 |
| Sun & Snow | 5 | $25,141 | 14 | 4.60/5.0 |
| Oskar | 2 | $20,528 | 8 | 5.00/5.0 |
| Adam | 1 | $18,761 | 24 | 5.00/5.0 |
| Justyna | 2 | $14,416 | 26 | 5.00/5.0 |
| Lukasz | 2 | $12,984 | 3 | Not Rated |
| VacationClub | 3 | $12,481 | 5 | 5.00/5.0 |
| Jacek | 3 | $12,025 | 33 | 4.83/5.0 |
| Aleksandra | 1 | $11,349 | 3 | 5.00/5.0 |
Analyzing the strategies of top hosts, such as their property selection, pricing, and guest communication, can offer valuable lessons for optimizing your own Airbnb operations in Polanica-Zdrój.
Dive Deeper: Advanced Polanica-Zdrój STR Market Data (2026)
Ready to unlock more insights? AirROI provides access to advanced metrics and comprehensive Airbnb data for Polanica-Zdrój. Explore detailed analytics beyond this report to refine your investment strategy, optimize pricing, and maximize your vacation rental profits.
Explore Advanced MetricsPolanica-Zdrój Short-Term Rental Market Composition (2026): Property & Room Types
Room Type Distribution
Property Type Distribution
Market Composition Insights for Polanica-Zdrój
- The Polanica-Zdrój Airbnb market composition is heavily skewed towards Entire Home/Apt listings, which make up 94.2% of the 86 active rentals. This indicates strong guest preference for privacy and space.
- Looking at the property type distribution in Polanica-Zdrój, Apartment/Condo properties are the most common (83.7%), reflecting the local real estate landscape.
- Houses represent a significant 16.3% portion, catering likely to families or larger groups.
Polanica-Zdrój Airbnb Room Capacity Analysis (2026): Bedroom Distribution
Distribution of Listings by Number of Bedrooms
Room Capacity Insights for Polanica-Zdrój
- The dominant room capacity in Polanica-Zdrój is 1 bedroom listings, making up 50% of the market. This suggests a strong demand for properties suitable for couples or solo travelers.
- Together, 1 bedroom and 2 bedrooms properties represent 77.9% of the active Airbnb listings in Polanica-Zdrój, indicating a high concentration in these sizes.
Polanica-Zdrój Vacation Rental Guest Capacity Trends (2026)
Distribution of Listings by Guest Capacity
Guest Capacity Insights for Polanica-Zdrój
- The most common guest capacity trend in Polanica-Zdrój vacation rentals is listings accommodating 4 guests (52.3%). This suggests the primary traveler segment is likely small families or groups.
- Properties designed for 4 guests and 8+ guests dominate the Polanica-Zdrój STR market, accounting for 66.3% of listings.
- 26.8% of properties accommodate 6+ guests, serving the market segment for larger families or group travel in Polanica-Zdrój.
- On average, properties in Polanica-Zdrój are equipped to host 4.5 guests.
Polanica-Zdrój Airbnb Booking Patterns (2026): Available vs. Booked Days
Available Days Distribution
Booked Days Distribution
Booking Pattern Insights for Polanica-Zdrój
- The most common availability pattern in Polanica-Zdrój falls within the 271-366 days range, representing 86% of listings. This suggests many properties have significant open periods on their calendars.
- Approximately 100.0% of listings show high availability (181+ days open annually), indicating potential for increased bookings or specific owner usage patterns.
- For booked days, the 1-30 days range is most frequent in Polanica-Zdrój (43%), reflecting common guest stay durations or potential owner blocking patterns.
Polanica-Zdrój Airbnb Minimum Stay Requirements Analysis
Distribution of Listings by Minimum Night Requirement
2 Nights
17 listings
19.8% of total
3 Nights
9 listings
10.5% of total
30+ Nights
60 listings
69.8% of total
Key Insights
- The most prevalent minimum stay requirement in Polanica-Zdrój is 30+ Nights, adopted by 69.8% of listings. This highlights the market's preference for longer commitments.
- Very short stays (1-2 nights) are less common (19.8%), suggesting hosts prefer slightly longer bookings to optimize turnover.
- A significant segment (69.8%) caters to monthly stays (30+ nights) in Polanica-Zdrój, pointing to opportunities in the extended-stay market.
Recommendations
- Align with the market by considering a 30+ Nights minimum stay, as 69.8% of Polanica-Zdrój hosts use this setting.
- Explore offering discounts for stays of 30+ nights to attract the 69.8% of the market seeking extended stays.
- Adjust minimum nights based on seasonality – potentially shorter during low season and longer during peak demand periods in Polanica-Zdrój.
Polanica-Zdrój Airbnb Cancellation Policy Trends Analysis (2026)
Limited
1 listings
1.2% of total
Super Strict 60 Days
43 listings
50% of total
Refundable
4 listings
4.7% of total
Flexible
11 listings
12.8% of total
Moderate
12 listings
14% of total
Firm
15 listings
17.4% of total
Cancellation Policy Insights for Polanica-Zdrój
- The prevailing Airbnb cancellation policy trend in Polanica-Zdrój is Super Strict 60 Days, used by 50% of listings.
- There's a relatively balanced mix between guest-friendly (26.8%) and stricter (17.4%) policies, offering choices for different guest needs.
Recommendations for Hosts
- Consider adopting a Super Strict 60 Days policy to align with the 50% market standard in Polanica-Zdrój.
- Regularly review your cancellation policy against competitors and market demand shifts in Polanica-Zdrój.
Polanica-Zdrój STR Booking Lead Time Analysis (2026)
Average Booking Lead Time by Month
Booking Lead Time Insights for Polanica-Zdrój
- The overall average booking lead time for vacation rentals in Polanica-Zdrój is 34 days.
- Guests book furthest in advance for stays during August (average 50 days), likely coinciding with peak travel demand or local events.
- The shortest booking windows occur for stays in November (average 18 days), indicating more last-minute travel plans during this time.
- Seasonally, Summer (37 days avg.) sees the longest lead times, while Fall (29 days avg.) has the shortest, reflecting typical travel planning cycles.
Recommendations for Hosts
- Use the overall average lead time (34 days) as a baseline for your pricing and availability strategy in Polanica-Zdrój.
- For August stays, consider implementing length-of-stay discounts or slightly higher rates for bookings made less than 50 days out to capitalize on advance planning.
- Target marketing efforts for the Summer season well in advance (at least 37 days) to capture early planners.
- Monitor your own booking lead times against these Polanica-Zdrój averages to identify opportunities for dynamic pricing adjustments.
Popular & Essential Airbnb Amenities in Polanica-Zdrój (2026)
Amenity Prevalence
Amenity Insights for Polanica-Zdrój
- Essential amenities in Polanica-Zdrój that guests expect include: TV. Lacking these (this) could significantly impact bookings.
- Popular amenities like Wifi, Essentials, Hair dryer are common but not universal. Offering these can provide a competitive edge.
- Warning: Wifi is not universally provided but is considered essential globally. Ensure reliable Wifi is offered.
Recommendations for Hosts
- Ensure your listing includes all essential amenities for Polanica-Zdrój: TV.
- Consider adding popular differentiators like Wifi or Essentials to increase appeal.
- Highlight unique or less common amenities you offer (e.g., hot tub, dedicated workspace, EV charger) in your listing description and photos.
- Regularly check competitor amenities in Polanica-Zdrój to stay competitive.
Polanica-Zdrój Airbnb Guest Demographics & Profile Analysis (2026)
Guest Profile Summary for Polanica-Zdrój
- The typical guest profile for Airbnb in Polanica-Zdrój consists of a mix of domestic (55%) and international guests, often arriving from nearby Poznań, typically belonging to the Post-2000s (Gen Z/Alpha) group (50%), primarily speaking English or Polish.
- Domestic travelers account for 54.7% of guests.
- Key international markets include Poland (54.7%) and Czechia (13.2%).
- Top languages spoken are English (39.7%) followed by Polish (24.4%).
- A significant demographic segment is the Post-2000s (Gen Z/Alpha) group, representing 50% of guests.
Recommendations for Hosts
- Balance marketing efforts between domestic and international channels based on the guest mix.
- Tailor amenities and listing descriptions to appeal to the dominant Post-2000s (Gen Z/Alpha) demographic (e.g., highlight fast WiFi, smart home features, local guides).
- Highlight unique local experiences or amenities relevant to the primary guest profile.
- Consider seasonal promotions aligned with peak travel times for key origin markets.
Nearby Short-Term Rental Market Comparison
How does the Polanica-Zdrój Airbnb market stack up against its neighbors? Compare key performance metrics like average monthly revenue, ADR, and occupancy rates in surrounding areas to understand the broader regional STR landscape.
| Market | Active Properties | Monthly Revenue | Daily Rate | Avg. Occupancy |
|---|---|---|---|---|
| Rudník | 18 | $2,533 | $218.37 | 31% |
| Smržovka | 20 | $2,205 | $181.12 | 43% |
| Josefův Důl | 16 | $2,081 | $297.41 | 32% |
| Vysoké nad Jizerou | 12 | $1,911 | $178.38 | 35% |
| Zachełmie | 14 | $1,805 | $192.32 | 35% |
| Mladé Buky | 18 | $1,756 | $196.95 | 32% |
| Tanvald | 12 | $1,697 | $189.30 | 35% |
| Wolimierz | 10 | $1,605 | $213.99 | 33% |
| Desná | 21 | $1,547 | $169.01 | 36% |
| Kamienica | 11 | $1,538 | $197.92 | 28% |