Karpacz Airbnb Market Analysis 2026: Short Term Rental Data & Vacation Rental Statistics in Lower Silesian Voivodeship, Poland
Is Airbnb profitable in Karpacz in 2026? Explore comprehensive Airbnb analytics for Karpacz, Lower Silesian Voivodeship, Poland to uncover income potential. This 2026 STR market report for Karpacz, based on AirROI data from February 2025 to January 2026, reveals key trends in the market of 519 active listings.
Whether you're considering an Airbnb investment in Karpacz, optimizing your existing vacation rental, or exploring rental arbitrage opportunities, understanding the Karpacz Airbnb data is crucial. Leveraging the low regulation environment is key to maximizing your short term rental income potential. Let's dive into the specifics.
Key Karpacz Airbnb Performance Metrics Overview
Monthly Airbnb Revenue Variations & Income Potential in Karpacz (2026)
Understanding the monthly revenue variations for Airbnb listings in Karpacz is key to maximizing your short term rental income potential. Seasonality significantly impacts earnings. Our analysis, based on data from the past 12 months, shows that the peak revenue month for STRs in Karpacz is typically February, while March often presents the lowest earnings, highlighting opportunities for strategic pricing adjustments during shoulder and low seasons. Explore the typical Airbnb income in Karpacz across different performance tiers:
- Best-in-class properties (Top 10%) achieve $1,773+ monthly, often utilizing dynamic pricing and superior guest experiences.
- Strong performing properties (Top 25%) earn $1,166 or more, indicating effective management and desirable locations/amenities.
- Typical properties (Median) generate around $682 per month, representing the average market performance.
- Entry-level properties (Bottom 25%) see earnings around $386, often with potential for optimization.
Average Monthly Airbnb Earnings Trend in Karpacz
Karpacz Airbnb Occupancy Rate Trends (2026)
Maximize your bookings by understanding the Karpacz STR occupancy trends. Seasonal demand shifts significantly influence how often properties are booked. Typically, Februarysees the highest demand (peak season occupancy), while November experiences the lowest (low season). Effective strategies, like adjusting minimum stays or offering promotions, can boost occupancy during slower periods. Here's how different property tiers perform in Karpacz:
- Best-in-class properties (Top 10%) achieve 48%+ occupancy, indicating high desirability and potentially optimized availability.
- Strong performing properties (Top 25%) maintain 34% or higher occupancy, suggesting good market fit and guest satisfaction.
- Typical properties (Median) have an occupancy rate around 20%.
- Entry-level properties (Bottom 25%) average 11% occupancy, potentially facing higher vacancy.
Average Monthly Occupancy Rate Trend in Karpacz
Average Daily Rate (ADR) Airbnb Trends in Karpacz (2026)
Effective short term rental pricing strategy in Karpacz involves understanding monthly ADR fluctuations. The Average Daily Rate (ADR) for Airbnb in Karpacz typically peaks in January and dips lowest during June. Leveraging Airbnb dynamic pricing tools or strategies based on this seasonality can significantly boost revenue. Here's a look at the typical nightly rates achieved:
- Best-in-class properties (Top 10%) command rates of $214+ per night, often due to premium features or locations.
- Strong performing properties (Top 25%) achieve nightly rates of $160 or more.
- Typical properties (Median) charge around $116 per night.
- Entry-level properties (Bottom 25%) earn around $90 per night.
Average Daily Rate (ADR) Trend by Month in Karpacz
Get Live Karpacz Market Intelligence 👇

Explore Real-time Analytics
Airbnb Seasonality Analysis & Trends in Karpacz (2026)
Peak Season (February, December, July)
- Revenue averages $1,250 per month
- Occupancy rates average 30.7%
- Daily rates average $142
Shoulder Season
- Revenue averages $889 per month
- Occupancy maintains around 23.4%
- Daily rates hold near $146
Low Season (March, June, November)
- Revenue drops to average $601 per month
- Occupancy decreases to average 18.9%
- Daily rates adjust to average $128
Seasonality Insights for Karpacz
- The Airbnb seasonality in Karpacz shows highly seasonal trends requiring careful strategy. While the sections above show seasonal averages, it's also insightful to look at the extremes:
- During the high season, the absolute peak month showcases Karpacz's highest earning potential, with monthly revenues capable of climbing to $1,281, occupancy reaching a high of 36.0%, and ADRs peaking at $227.
- Conversely, the slowest single month of the year, typically falling within the low season, marks the market's lowest point. In this month, revenue might dip to $554, occupancy could drop to 18.4%, and ADRs may adjust down to $122.
- Understanding both the seasonal averages and these monthly peaks and troughs in revenue, occupancy, and ADR is crucial for maximizing your Airbnb profit potential in Karpacz.
Seasonal Strategies for Maximizing Profit
- Peak Season: Maximize revenue through premium pricing and potentially longer minimum stays. Ensure high availability.
- Low Season: Offer competitive pricing, special promotions (e.g., extended stay discounts), and flexible cancellation policies. Target off-season travelers like remote workers or budget-conscious guests.
- Shoulder Seasons: Implement dynamic pricing that balances peak and low rates. Target weekend travelers or specific events. Offer slightly more flexible terms than peak season.
- Regularly analyze your own performance against these Karpacz seasonality benchmarks and adjust your pricing and availability strategy accordingly.
Best Areas for Airbnb Investment in Karpacz (2026)
Exploring the top neighborhoods for short-term rentals in Karpacz? This section highlights key areas, outlining why they are attractive for hosts and guests, along with notable local attractions. Consider these locations based on your target guest profile and investment strategy.
| Neighborhood / Area | Why Host Here? (Target Guests & Appeal) | Key Attractions & Landmarks |
|---|---|---|
| Karpacz Center | The heart of Karpacz, known for its vibrant atmosphere and proximity to local shops, restaurants, and attractions. Ideal for tourists looking to explore the town's charm. | Karkonosze National Park, Wang Church, Karpacz Ski Resort, Alpine Coaster, Tomuszowo Cultural Center |
| Wyższe Łazienki | A peaceful residential area with beautiful views and easy access to hiking trails. Attracts nature lovers and those looking for a serene getaway in the mountains. | Hiking trails, Forest adventures, Skiing facilities, Scenic viewpoints |
| Karpacz Złotnicka | A popular area known for its scenic beauty and outdoor activities. Great for families and adventure seekers looking for a mix of relaxation and excitement. | Kopa Ski Resort, Złotnicka Valley, Hiking routes, Biking trails |
| Biały Jar | Known for its winter sports and ski slopes, this area attracts skiers and snowboarders in winter and hikers in summer. A prime spot for active travelers. | Biały Jar ski area, Winter sports activities, Summer hiking, Dining options nearby |
| Płocka Północ | Located on the outskirts of Karpacz, this area offers a tranquil retreat while still being close to the main attractions. Ideal for those seeking peace and quiet. | Peaceful countryside, Hiking spots, Local farm visits |
| Słoneczna Dolina | A family-friendly area with playgrounds and parks. Great for families traveling with children who need safe spaces to play and explore. | Children's playgrounds, Family parks, Outdoor activities |
| Dolna Karpacz | Close to the main road and easily accessible, this area offers a mix of convenience and scenic surroundings. Attractive to both tourists and local visitors. | Shopping areas, Dining choices, Proximity to major attractions |
| Karpacz Lisi Jar | Offering stunning views of the mountains, this area is perfect for tourists looking for a picturesque stay. Great for photography enthusiasts. | Beautiful mountain views, Photography spots, Hiking trails |
Understanding Airbnb License Requirements & STR Laws in Karpacz (2026)
While Karpacz, Lower Silesian Voivodeship, Poland currently shows low STR regulations, specific Airbnb license requirements might still exist or change. Always verify the latest short term rental regulations and Airbnb license requirements directly with local government authorities for Karpacz to ensure full compliance before hosting.
(Source: AirROI data, 2026, finding no licensed listings among those analyzed)
Top Performing Airbnb Properties in Karpacz (2026)
Benchmark your potential! Explore examples of top-performing Airbnb properties in Karpaczbased on Trailing Twelve Month (TTM) revenue. Analyze their characteristics, revenue, occupancy rate, and ADR to understand what drives success in this market.

Willa Szycha
Entire Place • 5 bedrooms
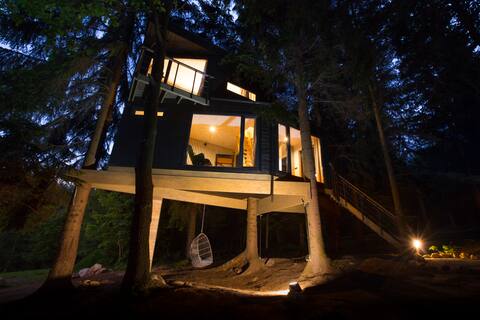
Cozy tree house PICEA surrounded by nature
Entire Place • 1 bedroom
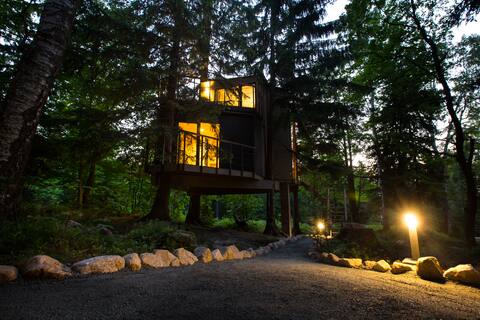
Cozy tree house BETULA surrounded by nature
Entire Place • 1 bedroom

Tumitak Sarnia Family & Friends
Entire Place • 5 bedrooms

White House cottage with sauna, terrace, air conditioning
Entire Place • 3 bedrooms

Karpatia Myśliwska 5C Apartment 6 Sun&Snow
Entire Place • 2 bedrooms
Note: Performance varies based on location, size, amenities, seasonality, and management quality. Data reflects the past 12 months.
Top Performing Airbnb Hosts in Karpacz (2026)
Learn from the best! This table showcases top-performing Airbnb hosts in Karpacz based on the number of properties managed and estimated total revenue over the past year. Analyze their scale and performance metrics.
| Host Name | Properties | Grossing Revenue | Stay Reviews | Avg Rating |
|---|---|---|---|---|
| Sun & Snow | 221 | $1,178,392 | 928 | 4.69/5.0 |
| Apartamenty Wonder Home | 50 | $511,534 | 176 | 4.74/5.0 |
| Sebastian | 89 | $498,118 | 947 | 4.76/5.0 |
| Rent Like Home | 31 | $249,783 | 68 | 4.73/5.0 |
| Helena | 2 | $84,679 | 150 | 4.90/5.0 |
| Robert | 9 | $81,288 | 49 | 4.84/5.0 |
| RentPlanet | 8 | $68,910 | 25 | 4.63/5.0 |
| Dagmara | 1 | $63,917 | 10 | 4.90/5.0 |
| HoteLOVE | 6 | $63,030 | 154 | 4.90/5.0 |
| Jakub | 8 | $60,205 | 12 | 4.67/5.0 |
Analyzing the strategies of top hosts, such as their property selection, pricing, and guest communication, can offer valuable lessons for optimizing your own Airbnb operations in Karpacz.
Dive Deeper: Advanced Karpacz STR Market Data (2026)
Ready to unlock more insights? AirROI provides access to advanced metrics and comprehensive Airbnb data for Karpacz. Explore detailed analytics beyond this report to refine your investment strategy, optimize pricing, and maximize your vacation rental profits.
Explore Advanced MetricsKarpacz Short-Term Rental Market Composition (2026): Property & Room Types
Room Type Distribution
Property Type Distribution
Market Composition Insights for Karpacz
- The Karpacz Airbnb market composition is heavily skewed towards Entire Home/Apt listings, which make up 94.4% of the 519 active rentals. This indicates strong guest preference for privacy and space.
- Looking at the property type distribution in Karpacz, Apartment/Condo properties are the most common (87.1%), reflecting the local real estate landscape.
- Smaller segments like others, hotel/boutique, unique stays (combined 7.5%) offer potential for unique stay experiences.
Karpacz Airbnb Room Capacity Analysis (2026): Bedroom Distribution
Distribution of Listings by Number of Bedrooms
Room Capacity Insights for Karpacz
- The dominant room capacity in Karpacz is 1 bedroom listings, making up 52.2% of the market. This suggests a strong demand for properties suitable for couples or solo travelers.
- Together, 1 bedroom and 2 bedrooms properties represent 74.7% of the active Airbnb listings in Karpacz, indicating a high concentration in these sizes.
- With over half the market (52.2%) consisting of studios or 1-bedroom units, Karpacz is particularly well-suited for individuals or couples.
- Listings with 3+ bedrooms (8.5%) represent a smaller niche, potentially indicating an underserved market for larger group accommodations in Karpacz.
Karpacz Vacation Rental Guest Capacity Trends (2026)
Distribution of Listings by Guest Capacity
Guest Capacity Insights for Karpacz
- The most common guest capacity trend in Karpacz vacation rentals is listings accommodating 4 guests (52.6%). This suggests the primary traveler segment is likely small families or groups.
- Properties designed for 4 guests and 6 guests dominate the Karpacz STR market, accounting for 69.6% of listings.
- 24.4% of properties accommodate 6+ guests, serving the market segment for larger families or group travel in Karpacz.
- On average, properties in Karpacz are equipped to host 4.3 guests.
Karpacz Airbnb Booking Patterns (2026): Available vs. Booked Days
Available Days Distribution
Booked Days Distribution
Booking Pattern Insights for Karpacz
- The most common availability pattern in Karpacz falls within the 271-366 days range, representing 86.7% of listings. This suggests many properties have significant open periods on their calendars.
- Approximately 99.6% of listings show high availability (181+ days open annually), indicating potential for increased bookings or specific owner usage patterns.
- For booked days, the 31-90 days range is most frequent in Karpacz (49.5%), reflecting common guest stay durations or potential owner blocking patterns.
- A notable 0.8% of properties secure long booking periods (181+ days booked per year), highlighting successful long-term rental strategies or significant owner usage.
Karpacz Airbnb Minimum Stay Requirements Analysis
Distribution of Listings by Minimum Night Requirement
1 Night
20 listings
3.9% of total
2 Nights
128 listings
24.7% of total
3 Nights
11 listings
2.1% of total
4-6 Nights
3 listings
0.6% of total
30+ Nights
357 listings
68.8% of total
Key Insights
- The most prevalent minimum stay requirement in Karpacz is 30+ Nights, adopted by 68.8% of listings. This highlights the market's preference for longer commitments.
- A significant segment (68.8%) caters to monthly stays (30+ nights) in Karpacz, pointing to opportunities in the extended-stay market.
Recommendations
- Align with the market by considering a 30+ Nights minimum stay, as 68.8% of Karpacz hosts use this setting.
- If feasible, allowing 1-night stays, especially midweek or during low season, could capture last-minute bookings, as only 3.9% currently do.
- Explore offering discounts for stays of 30+ nights to attract the 68.8% of the market seeking extended stays.
- Adjust minimum nights based on seasonality – potentially shorter during low season and longer during peak demand periods in Karpacz.
Karpacz Airbnb Cancellation Policy Trends Analysis (2026)
Super Strict 30 Days
9 listings
1.7% of total
Limited
63 listings
12.1% of total
Super Strict 60 Days
1 listings
0.2% of total
Refundable
3 listings
0.6% of total
Non-refundable
3 listings
0.6% of total
Flexible
35 listings
6.7% of total
Moderate
335 listings
64.5% of total
Firm
68 listings
13.1% of total
Strict
2 listings
0.4% of total
Cancellation Policy Insights for Karpacz
- The prevailing Airbnb cancellation policy trend in Karpacz is Moderate, used by 64.5% of listings.
- The market strongly favors guest-friendly terms, with 71.2% of listings offering Flexible or Moderate policies. This suggests guests in Karpacz may expect booking flexibility.
- Strict cancellation policies are quite rare (0.4%), potentially making listings with this policy less competitive unless justified by high demand or property type.
Recommendations for Hosts
- Consider adopting a Moderate policy to align with the 64.5% market standard in Karpacz.
- Using a Strict policy might deter some guests, as only 0.4% of listings use it. Evaluate if potential revenue protection outweighs possible lower booking rates.
- Regularly review your cancellation policy against competitors and market demand shifts in Karpacz.
Karpacz STR Booking Lead Time Analysis (2026)
Average Booking Lead Time by Month
Booking Lead Time Insights for Karpacz
- The overall average booking lead time for vacation rentals in Karpacz is 41 days.
- Guests book furthest in advance for stays during September (average 72 days), likely coinciding with peak travel demand or local events.
- The shortest booking windows occur for stays in June (average 23 days), indicating more last-minute travel plans during this time.
- Seasonally, Winter (48 days avg.) sees the longest lead times, while Summer (34 days avg.) has the shortest, reflecting typical travel planning cycles.
Recommendations for Hosts
- Use the overall average lead time (41 days) as a baseline for your pricing and availability strategy in Karpacz.
- For September stays, consider implementing length-of-stay discounts or slightly higher rates for bookings made less than 72 days out to capitalize on advance planning.
- Target marketing efforts for the Winter season well in advance (at least 48 days) to capture early planners.
- Monitor your own booking lead times against these Karpacz averages to identify opportunities for dynamic pricing adjustments.
Popular & Essential Airbnb Amenities in Karpacz (2026)
Amenity Prevalence
Amenity Insights for Karpacz
- Essential amenities in Karpacz that guests expect include: TV, Wifi, Heating. Lacking these (any) could significantly impact bookings.
- Popular amenities like Dishes and silverware, Hot water, Essentials are common but not universal. Offering these can provide a competitive edge.
Recommendations for Hosts
- Ensure your listing includes all essential amenities for Karpacz: TV, Wifi, Heating.
- Prioritize adding missing essentials: TV, Wifi, Heating.
- Consider adding popular differentiators like Dishes and silverware or Hot water to increase appeal.
- Highlight unique or less common amenities you offer (e.g., hot tub, dedicated workspace, EV charger) in your listing description and photos.
- Regularly check competitor amenities in Karpacz to stay competitive.
Karpacz Airbnb Guest Demographics & Profile Analysis (2026)
Guest Profile Summary for Karpacz
- The typical guest profile for Airbnb in Karpacz consists of a mix of domestic (42%) and international guests, with top international origins including Germany, typically belonging to the Post-2000s (Gen Z/Alpha) group (50%), primarily speaking English or Polish.
- Domestic travelers account for 42.0% of guests.
- Key international markets include Poland (42%) and Germany (28.6%).
- Top languages spoken are English (38.8%) followed by Polish (21.5%).
- A significant demographic segment is the Post-2000s (Gen Z/Alpha) group, representing 50% of guests.
Recommendations for Hosts
- Balance marketing efforts between domestic and international channels based on the guest mix.
- Tailor amenities and listing descriptions to appeal to the dominant Post-2000s (Gen Z/Alpha) demographic (e.g., highlight fast WiFi, smart home features, local guides).
- Highlight unique local experiences or amenities relevant to the primary guest profile.
- Consider seasonal promotions aligned with peak travel times for key origin markets.
Nearby Short-Term Rental Market Comparison
How does the Karpacz Airbnb market stack up against its neighbors? Compare key performance metrics like average monthly revenue, ADR, and occupancy rates in surrounding areas to understand the broader regional STR landscape.
| Market | Active Properties | Monthly Revenue | Daily Rate | Avg. Occupancy |
|---|---|---|---|---|
| Rudník | 18 | $2,533 | $218.37 | 31% |
| Capital City of Prague | 7,234 | $2,274 | $154.94 | 54% |
| Tisá | 11 | $2,213 | $183.06 | 39% |
| Smržovka | 20 | $2,205 | $181.12 | 43% |
| Jablonné v Podještědí | 17 | $2,187 | $208.35 | 38% |
| Josefův Důl | 16 | $2,081 | $297.41 | 32% |
| Praha 1 | 166 | $2,057 | $170.19 | 55% |
| Rathmannsdorf | 21 | $2,004 | $137.98 | 50% |
| Prague 2 | 65 | $1,974 | $162.14 | 58% |
| Praha 8 | 26 | $1,958 | $157.05 | 58% |