Zakopane Airbnb Market Analysis 2026: Short Term Rental Data & Vacation Rental Statistics in Lesser Poland Voivodeship, Poland
Is Airbnb profitable in Zakopane in 2026? Explore comprehensive Airbnb analytics for Zakopane, Lesser Poland Voivodeship, Poland to uncover income potential. This 2026 STR market report for Zakopane, based on AirROI data from February 2025 to January 2026, reveals key trends in the bustling market of 1,637 active listings.
Whether you're considering an Airbnb investment in Zakopane, optimizing your existing vacation rental, or exploring rental arbitrage opportunities, understanding the Zakopane Airbnb data is crucial. Leveraging the low regulation environment is key to maximizing your short term rental income potential. Let's dive into the specifics.
Key Zakopane Airbnb Performance Metrics Overview
Monthly Airbnb Revenue Variations & Income Potential in Zakopane (2026)
Understanding the monthly revenue variations for Airbnb listings in Zakopane is key to maximizing your short term rental income potential. Seasonality significantly impacts earnings. Our analysis, based on data from the past 12 months, shows that the peak revenue month for STRs in Zakopane is typically August, while March often presents the lowest earnings, highlighting opportunities for strategic pricing adjustments during shoulder and low seasons. Explore the typical Airbnb income in Zakopane across different performance tiers:
- Best-in-class properties (Top 10%) achieve $3,144+ monthly, often utilizing dynamic pricing and superior guest experiences.
- Strong performing properties (Top 25%) earn $1,830 or more, indicating effective management and desirable locations/amenities.
- Typical properties (Median) generate around $967 per month, representing the average market performance.
- Entry-level properties (Bottom 25%) see earnings around $482, often with potential for optimization.
Average Monthly Airbnb Earnings Trend in Zakopane
Zakopane Airbnb Occupancy Rate Trends (2026)
Maximize your bookings by understanding the Zakopane STR occupancy trends. Seasonal demand shifts significantly influence how often properties are booked. Typically, Februarysees the highest demand (peak season occupancy), while March experiences the lowest (low season). Effective strategies, like adjusting minimum stays or offering promotions, can boost occupancy during slower periods. Here's how different property tiers perform in Zakopane:
- Best-in-class properties (Top 10%) achieve 65%+ occupancy, indicating high desirability and potentially optimized availability.
- Strong performing properties (Top 25%) maintain 44% or higher occupancy, suggesting good market fit and guest satisfaction.
- Typical properties (Median) have an occupancy rate around 25%.
- Entry-level properties (Bottom 25%) average 13% occupancy, potentially facing higher vacancy.
Average Monthly Occupancy Rate Trend in Zakopane
Average Daily Rate (ADR) Airbnb Trends in Zakopane (2026)
Effective short term rental pricing strategy in Zakopane involves understanding monthly ADR fluctuations. The Average Daily Rate (ADR) for Airbnb in Zakopane typically peaks in January and dips lowest during April. Leveraging Airbnb dynamic pricing tools or strategies based on this seasonality can significantly boost revenue. Here's a look at the typical nightly rates achieved:
- Best-in-class properties (Top 10%) command rates of $283+ per night, often due to premium features or locations.
- Strong performing properties (Top 25%) achieve nightly rates of $186 or more.
- Typical properties (Median) charge around $129 per night.
- Entry-level properties (Bottom 25%) earn around $89 per night.
Average Daily Rate (ADR) Trend by Month in Zakopane
Get Live Zakopane Market Intelligence 👇

Explore Real-time Analytics
Airbnb Seasonality Analysis & Trends in Zakopane (2026)
Peak Season (August, February, December)
- Revenue averages $1,994 per month
- Occupancy rates average 37.7%
- Daily rates average $186
Shoulder Season
- Revenue averages $1,453 per month
- Occupancy maintains around 30.3%
- Daily rates hold near $174
Low Season (March, April, May)
- Revenue drops to average $1,029 per month
- Occupancy decreases to average 24.7%
- Daily rates adjust to average $151
Seasonality Insights for Zakopane
- The Airbnb seasonality in Zakopane shows highly seasonal trends requiring careful strategy. While the sections above show seasonal averages, it's also insightful to look at the extremes:
- During the high season, the absolute peak month showcases Zakopane's highest earning potential, with monthly revenues capable of climbing to $2,009, occupancy reaching a high of 42.9%, and ADRs peaking at $230.
- Conversely, the slowest single month of the year, typically falling within the low season, marks the market's lowest point. In this month, revenue might dip to $970, occupancy could drop to 23.3%, and ADRs may adjust down to $151.
- Understanding both the seasonal averages and these monthly peaks and troughs in revenue, occupancy, and ADR is crucial for maximizing your Airbnb profit potential in Zakopane.
Seasonal Strategies for Maximizing Profit
- Peak Season: Maximize revenue through premium pricing and potentially longer minimum stays. Ensure high availability.
- Low Season: Offer competitive pricing, special promotions (e.g., extended stay discounts), and flexible cancellation policies. Target off-season travelers like remote workers or budget-conscious guests.
- Shoulder Seasons: Implement dynamic pricing that balances peak and low rates. Target weekend travelers or specific events. Offer slightly more flexible terms than peak season.
- Regularly analyze your own performance against these Zakopane seasonality benchmarks and adjust your pricing and availability strategy accordingly.
Best Areas for Airbnb Investment in Zakopane (2026)
Exploring the top neighborhoods for short-term rentals in Zakopane? This section highlights key areas, outlining why they are attractive for hosts and guests, along with notable local attractions. Consider these locations based on your target guest profile and investment strategy.
| Neighborhood / Area | Why Host Here? (Target Guests & Appeal) | Key Attractions & Landmarks |
|---|---|---|
| Krupówki Street | The main pedestrian street in Zakopane known for shops, restaurants, and vibrant atmosphere. A must-visit for tourists looking for local crafts and cuisine, making it a prime spot for Airbnb hosting. | Krupówki Street Market, Tatra Museum, Restaurants and Cafés, Zakopane Style Architecture, Shopping Boutiques |
| Gubałówka Hill | A popular hill offering stunning panoramic views of Zakopane and the Tatra Mountains. Attracts both tourists and hikers looking for breathtaking scenery, making it ideal for vacation rentals. | Gubałówka Funicular, Scenic Viewpoints, Hiking Trails, Local Food Stalls, Cultural Experiences |
| Kasprowy Wierch | A mountain in the Tatra range famous for skiing and hiking. Many tourists visit year-round for outdoor sports, making it a key location for adventure seekers and winter sports enthusiasts. | Kasprowy Wierch Ski Resort, Hiking Trails, Mountain Climbing, Scenic Gondola Rides, Tatra National Park |
| Morskie Oko | The most famous lake in the Tatra Mountains known for its picturesque landscape. A popular destination for nature lovers and hikers seeking tranquility and natural beauty. | Morskie Oko Lake, Tatra National Park, Scenic Hiking Trails, Natural Wonders, Photography Spots |
| Villa Atma | A cultural and historical site in Zakopane featuring traditional architecture and local art. Attracts visitors interested in arts and heritage, making it great for cultural tourism. | Villa Atma Museum, Local Art Exhibits, Cultural Events, Traditional Architecture, Artistic Workshops |
| Dolina Kościeliska | A beautiful valley known for its stunning scenery and hiking trails. It's favored by tourists looking for outdoor experiences and immersing in nature. | Hiking Trails, Natural Landscapes, Caves and Formations, Scenic Photography, Flora and Fauna |
| Strążyska Valley | A scenic valley that serves as a gateway to the Tatra Mountains. Popular among hikers and nature lovers, offering a peaceful retreat and close proximity to nature trails. | Scenic Trails, Natural Beauty, Wildlife Watching, Quiet Picnic Areas, Hiking Opportunities |
| Cichosciane | A tranquil neighborhood in Zakopane offering serene views and proximity to nature. Perfect for those looking to escape the hustle and enjoy a peaceful stay in Zakopane. | Serene Nature, Views of the Tatra Mountains, Local Hiking Paths, Relaxation Spots, Small Local Cafés |
Understanding Airbnb License Requirements & STR Laws in Zakopane (2026)
While Zakopane, Lesser Poland Voivodeship, Poland currently shows low STR regulations, specific Airbnb license requirements might still exist or change. Always verify the latest short term rental regulations and Airbnb license requirements directly with local government authorities for Zakopane to ensure full compliance before hosting.
(Source: AirROI data, 2026, finding no licensed listings among those analyzed)
Top Performing Airbnb Properties in Zakopane (2026)
Benchmark your potential! Explore examples of top-performing Airbnb properties in Zakopanebased on Trailing Twelve Month (TTM) revenue. Analyze their characteristics, revenue, occupancy rate, and ADR to understand what drives success in this market.
VILLA9A
Entire Place • 5 bedrooms

Villa Storczyk by WillyWalls - Zakopane Asnyka
Entire Place • 5 bedrooms

3 bedroom apartment in the center of Zakopane
Entire Place • 3 bedrooms
Silence Nad Dolina
Entire Place • 5 bedrooms

VILLA T - Two-level apartment Suite with a view
Entire Place • 3 bedrooms
2 bedroom apartment in the center of Zakopane
Entire Place • 2 bedrooms
Note: Performance varies based on location, size, amenities, seasonality, and management quality. Data reflects the past 12 months.
Top Performing Airbnb Hosts in Zakopane (2026)
Learn from the best! This table showcases top-performing Airbnb hosts in Zakopane based on the number of properties managed and estimated total revenue over the past year. Analyze their scale and performance metrics.
| Host Name | Properties | Grossing Revenue | Stay Reviews | Avg Rating |
|---|---|---|---|---|
| VisitZakopane | 90 | $1,449,883 | 1071 | 4.76/5.0 |
| RentPlanet | 100 | $803,198 | 367 | 4.51/5.0 |
| Grzechowiak Górskie Apartament | 61 | $733,835 | 414 | 4.81/5.0 |
| Rent Like Home | 35 | $552,185 | 678 | 4.48/5.0 |
| Grzegorz | 20 | $425,447 | 213 | 4.91/5.0 |
| Apres Ski - LoftAffair Collect | 16 | $414,649 | 185 | 4.88/5.0 |
| Tomasz | 23 | $391,318 | 90 | 4.65/5.0 |
| Agnieszka | 19 | $351,393 | 214 | 4.73/5.0 |
| Bartłomiej | 15 | $340,975 | 31 | 5.00/5.0 |
| Agnieszka | 35 | $315,876 | 190 | 4.54/5.0 |
Analyzing the strategies of top hosts, such as their property selection, pricing, and guest communication, can offer valuable lessons for optimizing your own Airbnb operations in Zakopane.
Dive Deeper: Advanced Zakopane STR Market Data (2026)
Ready to unlock more insights? AirROI provides access to advanced metrics and comprehensive Airbnb data for Zakopane. Explore detailed analytics beyond this report to refine your investment strategy, optimize pricing, and maximize your vacation rental profits.
Explore Advanced MetricsZakopane Short-Term Rental Market Composition (2026): Property & Room Types
Room Type Distribution
Property Type Distribution
Market Composition Insights for Zakopane
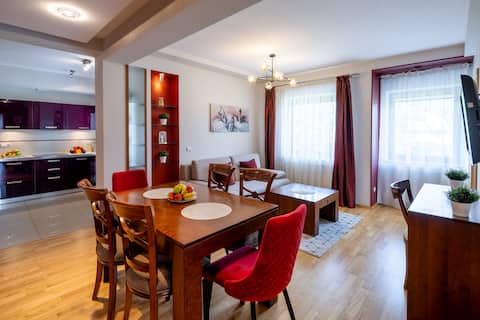
- The Zakopane Airbnb market composition is heavily skewed towards Entire Home/Apt listings, which make up 83% of the 1,637 active rentals. This indicates strong guest preference for privacy and space.
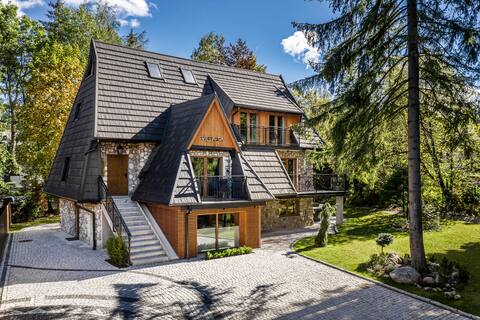
- Looking at the property type distribution in Zakopane, Apartment/Condo properties are the most common (75.4%), reflecting the local real estate landscape.
- Houses represent a significant 17.7% portion, catering likely to families or larger groups.
- Smaller segments like others, hotel/boutique, outdoor/unique, unique stays (combined 6.9%) offer potential for unique stay experiences.
Zakopane Airbnb Room Capacity Analysis (2026): Bedroom Distribution
Distribution of Listings by Number of Bedrooms
Room Capacity Insights for Zakopane
- The dominant room capacity in Zakopane is 1 bedroom listings, making up 44.8% of the market. This suggests a strong demand for properties suitable for couples or solo travelers.
- Together, 1 bedroom and 2 bedrooms properties represent 72.8% of the active Airbnb listings in Zakopane, indicating a high concentration in these sizes.
- Listings with 3+ bedrooms (8.8%) represent a smaller niche, potentially indicating an underserved market for larger group accommodations in Zakopane.
Zakopane Vacation Rental Guest Capacity Trends (2026)
Distribution of Listings by Guest Capacity
Guest Capacity Insights for Zakopane
- The most common guest capacity trend in Zakopane vacation rentals is listings accommodating 4 guests (35.5%). This suggests the primary traveler segment is likely small families or groups.
- Properties designed for 4 guests and 6 guests dominate the Zakopane STR market, accounting for 54.6% of listings.
- 29.5% of properties accommodate 6+ guests, serving the market segment for larger families or group travel in Zakopane.
- On average, properties in Zakopane are equipped to host 4.1 guests.
Zakopane Airbnb Booking Patterns (2026): Available vs. Booked Days
Available Days Distribution
Booked Days Distribution
Booking Pattern Insights for Zakopane
- The most common availability pattern in Zakopane falls within the 271-366 days range, representing 71.3% of listings. This suggests many properties have significant open periods on their calendars.
- Approximately 93.3% of listings show high availability (181+ days open annually), indicating potential for increased bookings or specific owner usage patterns.
- For booked days, the 31-90 days range is most frequent in Zakopane (44.5%), reflecting common guest stay durations or potential owner blocking patterns.
- A notable 7.3% of properties secure long booking periods (181+ days booked per year), highlighting successful long-term rental strategies or significant owner usage.
Zakopane Airbnb Minimum Stay Requirements Analysis
Distribution of Listings by Minimum Night Requirement
1 Night
90 listings
5.5% of total
2 Nights
177 listings
10.8% of total
3 Nights
125 listings
7.6% of total
4-6 Nights
68 listings
4.2% of total
7-29 Nights
2 listings
0.1% of total
30+ Nights
1174 listings
71.8% of total
Key Insights
- The most prevalent minimum stay requirement in Zakopane is 30+ Nights, adopted by 71.8% of listings. This highlights the market's preference for longer commitments.
- Very short stays (1-2 nights) are less common (16.3%), suggesting hosts prefer slightly longer bookings to optimize turnover.
- A significant segment (71.8%) caters to monthly stays (30+ nights) in Zakopane, pointing to opportunities in the extended-stay market.
Recommendations
- Align with the market by considering a 30+ Nights minimum stay, as 71.8% of Zakopane hosts use this setting.
- If feasible, allowing 1-night stays, especially midweek or during low season, could capture last-minute bookings, as only 5.5% currently do.
- Explore offering discounts for stays of 30+ nights to attract the 71.8% of the market seeking extended stays.
- Adjust minimum nights based on seasonality – potentially shorter during low season and longer during peak demand periods in Zakopane.
Zakopane Airbnb Cancellation Policy Trends Analysis (2026)
Super Strict 30 Days
54 listings
3.3% of total
Refundable
14 listings
0.9% of total
Non-refundable
20 listings
1.2% of total
Super Strict 60 Days
16 listings
1% of total
Limited
158 listings
9.7% of total
Flexible
149 listings
9.1% of total
Moderate
388 listings
23.8% of total
Firm
675 listings
41.4% of total
Strict
158 listings
9.7% of total
Cancellation Policy Insights for Zakopane
- The prevailing Airbnb cancellation policy trend in Zakopane is Firm, used by 41.4% of listings.
- A majority (51.1%) of hosts in Zakopane utilize Firm or Strict policies, indicating a market where hosts prioritize booking security.
- Strict cancellation policies are quite rare (9.7%), potentially making listings with this policy less competitive unless justified by high demand or property type.
Recommendations for Hosts
- Consider adopting a Firm policy to align with the 41.4% market standard in Zakopane.
- Using a Strict policy might deter some guests, as only 9.7% of listings use it. Evaluate if potential revenue protection outweighs possible lower booking rates.
- Regularly review your cancellation policy against competitors and market demand shifts in Zakopane.
Zakopane STR Booking Lead Time Analysis (2026)
Average Booking Lead Time by Month
Booking Lead Time Insights for Zakopane
- The overall average booking lead time for vacation rentals in Zakopane is 47 days.
- Guests book furthest in advance for stays during December (average 71 days), likely coinciding with peak travel demand or local events.
- The shortest booking windows occur for stays in March (average 25 days), indicating more last-minute travel plans during this time.
- Seasonally, Winter (54 days avg.) sees the longest lead times, while Spring (36 days avg.) has the shortest, reflecting typical travel planning cycles.
Recommendations for Hosts
- Use the overall average lead time (47 days) as a baseline for your pricing and availability strategy in Zakopane.
- For December stays, consider implementing length-of-stay discounts or slightly higher rates for bookings made less than 71 days out to capitalize on advance planning.
- Target marketing efforts for the Winter season well in advance (at least 54 days) to capture early planners.
- Monitor your own booking lead times against these Zakopane averages to identify opportunities for dynamic pricing adjustments.
Popular & Essential Airbnb Amenities in Zakopane (2026)
Amenity Prevalence
Amenity Insights for Zakopane
- Essential amenities in Zakopane that guests expect include: Wifi, TV, Heating. Lacking these (any) could significantly impact bookings.
- Popular amenities like Hair dryer, Free parking on premises, Dishes and silverware are common but not universal. Offering these can provide a competitive edge.
Recommendations for Hosts
- Ensure your listing includes all essential amenities for Zakopane: Wifi, TV, Heating.
- Prioritize adding missing essentials: Wifi, TV, Heating.
- Consider adding popular differentiators like Hair dryer or Free parking on premises to increase appeal.
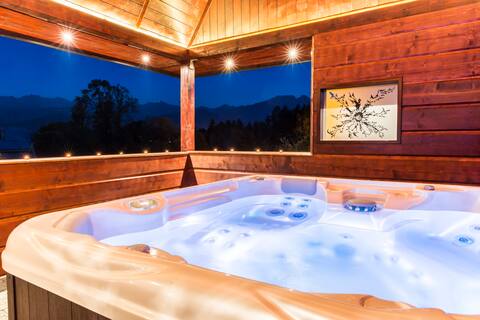
- Highlight unique or less common amenities you offer (e.g., hot tub, dedicated workspace, EV charger) in your listing description and photos.
- Regularly check competitor amenities in Zakopane to stay competitive.
Zakopane Airbnb Guest Demographics & Profile Analysis (2026)
Guest Profile Summary for Zakopane
- The typical guest profile for Airbnb in Zakopane consists of predominantly international visitors (78%), with top international origins including United Kingdom, typically belonging to the Post-2000s (Gen Z/Alpha) group (50%), primarily speaking English or Polish.
- Domestic travelers account for 21.7% of guests.
- Key international markets include Poland (21.7%) and United Kingdom (15.4%).
- Top languages spoken are English (41.2%) followed by Polish (13.4%).
- A significant demographic segment is the Post-2000s (Gen Z/Alpha) group, representing 50% of guests.
Recommendations for Hosts
- Focus marketing internationally, particularly towards travelers from United Kingdom.
- Tailor amenities and listing descriptions to appeal to the dominant Post-2000s (Gen Z/Alpha) demographic (e.g., highlight fast WiFi, smart home features, local guides).
- Highlight unique local experiences or amenities relevant to the primary guest profile.
- Consider seasonal promotions aligned with peak travel times for key origin markets.
Nearby Short-Term Rental Market Comparison
How does the Zakopane Airbnb market stack up against its neighbors? Compare key performance metrics like average monthly revenue, ADR, and occupancy rates in surrounding areas to understand the broader regional STR landscape.
| Market | Active Properties | Monthly Revenue | Daily Rate | Avg. Occupancy |
|---|---|---|---|---|
| Brenna | 29 | $2,549 | $334.28 | 28% |
| Pribylina | 12 | $2,041 | $233.47 | 37% |
| Skawica | 10 | $1,960 | $196.94 | 34% |
| Istebna | 11 | $1,862 | $225.92 | 34% |
| Zawoja | 40 | $1,857 | $215.79 | 31% |
| Dzianisz | 14 | $1,810 | $259.90 | 32% |
| Czarna Góra | 18 | $1,644 | $423.32 | 22% |
| Kluszkowce | 26 | $1,594 | $200.63 | 31% |
| Tylmanowa | 11 | $1,568 | $183.05 | 42% |
| Sidzina | 15 | $1,531 | $182.66 | 37% |