Calidonia Airbnb Market Analysis 2026: Short Term Rental Data & Vacation Rental Statistics in Panamá Province, Panama
Is Airbnb profitable in Calidonia in 2026? Explore comprehensive Airbnb analytics for Calidonia, Panamá Province, Panama to uncover income potential. This 2026 STR market report for Calidonia, based on AirROI data from February 2025 to January 2026, reveals key trends in the market of 224 active listings.
Whether you're considering an Airbnb investment in Calidonia, optimizing your existing vacation rental, or exploring rental arbitrage opportunities, understanding the Calidonia Airbnb data is crucial. Leveraging the low regulation environment is key to maximizing your short term rental income potential. Let's dive into the specifics.
Key Calidonia Airbnb Performance Metrics Overview
Monthly Airbnb Revenue Variations & Income Potential in Calidonia (2026)
Understanding the monthly revenue variations for Airbnb listings in Calidonia is key to maximizing your short term rental income potential. Seasonality significantly impacts earnings. Our analysis, based on data from the past 12 months, shows that the peak revenue month for STRs in Calidonia is typically February, while September often presents the lowest earnings, highlighting opportunities for strategic pricing adjustments during shoulder and low seasons. Explore the typical Airbnb income in Calidonia across different performance tiers:
- Best-in-class properties (Top 10%) achieve $2,314+ monthly, often utilizing dynamic pricing and superior guest experiences.
- Strong performing properties (Top 25%) earn $1,681 or more, indicating effective management and desirable locations/amenities.
- Typical properties (Median) generate around $964 per month, representing the average market performance.
- Entry-level properties (Bottom 25%) see earnings around $398, often with potential for optimization.
Average Monthly Airbnb Earnings Trend in Calidonia
Calidonia Airbnb Occupancy Rate Trends (2026)
Maximize your bookings by understanding the Calidonia STR occupancy trends. Seasonal demand shifts significantly influence how often properties are booked. Typically, Februarysees the highest demand (peak season occupancy), while June experiences the lowest (low season). Effective strategies, like adjusting minimum stays or offering promotions, can boost occupancy during slower periods. Here's how different property tiers perform in Calidonia:
- Best-in-class properties (Top 10%) achieve 89%+ occupancy, indicating high desirability and potentially optimized availability.
- Strong performing properties (Top 25%) maintain 75% or higher occupancy, suggesting good market fit and guest satisfaction.
- Typical properties (Median) have an occupancy rate around 47%.
- Entry-level properties (Bottom 25%) average 22% occupancy, potentially facing higher vacancy.
Average Monthly Occupancy Rate Trend in Calidonia
Average Daily Rate (ADR) Airbnb Trends in Calidonia (2026)
Effective short term rental pricing strategy in Calidonia involves understanding monthly ADR fluctuations. The Average Daily Rate (ADR) for Airbnb in Calidonia typically peaks in June and dips lowest during November. Leveraging Airbnb dynamic pricing tools or strategies based on this seasonality can significantly boost revenue. Here's a look at the typical nightly rates achieved:
- Best-in-class properties (Top 10%) command rates of $131+ per night, often due to premium features or locations.
- Strong performing properties (Top 25%) achieve nightly rates of $90 or more.
- Typical properties (Median) charge around $69 per night.
- Entry-level properties (Bottom 25%) earn around $47 per night.
Average Daily Rate (ADR) Trend by Month in Calidonia
Get Live Calidonia Market Intelligence 👇

Explore Real-time Analytics
Airbnb Seasonality Analysis & Trends in Calidonia (2026)
Peak Season (February, March, April)
- Revenue averages $1,372 per month
- Occupancy rates average 57.7%
- Daily rates average $76
Shoulder Season
- Revenue averages $1,085 per month
- Occupancy maintains around 44.7%
- Daily rates hold near $77
Low Season (September, October, November)
- Revenue drops to average $1,018 per month
- Occupancy decreases to average 44.9%
- Daily rates adjust to average $75
Seasonality Insights for Calidonia
- The Airbnb seasonality in Calidonia shows moderate seasonality with distinct peak and low periods. While the sections above show seasonal averages, it's also insightful to look at the extremes:
- During the high season, the absolute peak month showcases Calidonia's highest earning potential, with monthly revenues capable of climbing to $1,446, occupancy reaching a high of 62.4%, and ADRs peaking at $79.
- Conversely, the slowest single month of the year, typically falling within the low season, marks the market's lowest point. In this month, revenue might dip to $994, occupancy could drop to 42.3%, and ADRs may adjust down to $75.
- Understanding both the seasonal averages and these monthly peaks and troughs in revenue, occupancy, and ADR is crucial for maximizing your Airbnb profit potential in Calidonia.
Seasonal Strategies for Maximizing Profit
- Peak Season: Maximize revenue through premium pricing and potentially longer minimum stays. Ensure high availability.
- Low Season: Offer competitive pricing, special promotions (e.g., extended stay discounts), and flexible cancellation policies. Target off-season travelers like remote workers or budget-conscious guests.
- Shoulder Seasons: Implement dynamic pricing that balances peak and low rates. Target weekend travelers or specific events. Offer slightly more flexible terms than peak season.
- Regularly analyze your own performance against these Calidonia seasonality benchmarks and adjust your pricing and availability strategy accordingly.
Best Areas for Airbnb Investment in Calidonia (2026)
Exploring the top neighborhoods for short-term rentals in Calidonia? This section highlights key areas, outlining why they are attractive for hosts and guests, along with notable local attractions. Consider these locations based on your target guest profile and investment strategy.
| Neighborhood / Area | Why Host Here? (Target Guests & Appeal) | Key Attractions & Landmarks |
|---|---|---|
| Calle 50 | A bustling commercial area known for its skyscrapers and busy streets. It attracts business travelers and offers easy access to restaurants, shops, and entertainment. | Multiplaza Pacific Mall, Cinta Costera, Panama Canal Museum, Amador Causeway, Los Pueblos |
| Casco Viejo | A historic district recognized as a UNESCO World Heritage site. It's a popular area for tourists interested in history, culture, and vibrant nightlife. | Plaza Vieja, Cathedral Basilica Santa Maria la Antigua, Museum of Contemporary Art, La Casa del Vintage, Thermopolis |
| El Cangrejo | A friendly residential district filled with cafes, bars, and cultural activities. It attracts both tourists and locals looking for a lively atmosphere. | Parque Andres Bello, Café Unido, Artisan Workshops, Local Markets, Nightlife Venues |
| Obarrio | A modern area ideal for business and commerce, known for upscale apartments and condominiums. Attracts business travelers seeking convenience and luxury. | Westland Mall, Business district, Restaurants, Corporate Offices |
| San Francisco | A family-friendly neighborhood known for its parks and residential areas. It’s quiet yet close to major commercial areas, making it suitable for family stays. | Parque Omar, Calle 50, Restaurants, Local Shops |
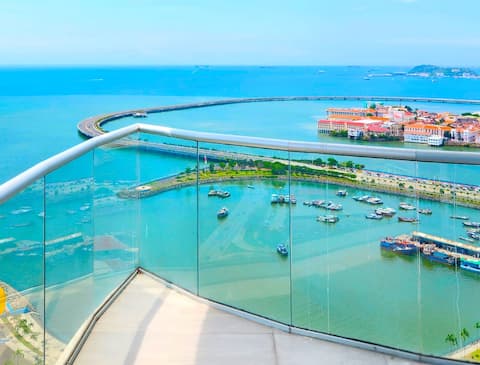
| Amador | A picturesque area with beautiful views and recreational activities. Popular with tourists looking for leisurely strolls and outdoor dining by the water. | Amador Causeway, BioMuseo, Restaurants with view, Marina, Biking paths |
| La Chorrera | Fast-growing suburban area that attracts visitors interested in exploring beyond the city. Offers a variety of local experiences and attractions. | Plaza Chorrera, Local Markets, Parks, Cultural Festivals |
| David | A major city in Chiriquí province known for its agricultural richness. Attracts those looking for a quieter, plant-laden getaway. | Parque de las Madres, Local Markets, Coffee Farms, Shopping Centers |
Understanding Airbnb License Requirements & STR Laws in Calidonia (2026)
While Calidonia, Panamá Province, Panama currently shows low STR regulations, specific Airbnb license requirements might still exist or change. Always verify the latest short term rental regulations and Airbnb license requirements directly with local government authorities for Calidonia to ensure full compliance before hosting.
(Source: AirROI data, 2026, based on 1% licensed listings)
Top Performing Airbnb Properties in Calidonia (2026)
Benchmark your potential! Explore examples of top-performing Airbnb properties in Calidoniabased on Trailing Twelve Month (TTM) revenue. Analyze their characteristics, revenue, occupancy rate, and ADR to understand what drives success in this market.

New Flat with Ocean + City Views
Entire Place • 2 bedrooms
Dream Balcony facing the Pacific
Entire Place • 2 bedrooms

Apartment with the warmth of home coastal strip
Entire Place • 1 bedroom

Elegant Waterfront Stay in Downtown Panama City
Entire Place • 1 bedroom

Apartment with the warmth of home and ocean view
Entire Place • 1 bedroom

k*| Breathtaking Oceanview 1BR in Ave Balboa
Entire Place • 1 bedroom
Note: Performance varies based on location, size, amenities, seasonality, and management quality. Data reflects the past 12 months.
Top Performing Airbnb Hosts in Calidonia (2026)
Learn from the best! This table showcases top-performing Airbnb hosts in Calidonia based on the number of properties managed and estimated total revenue over the past year. Analyze their scale and performance metrics.
| Host Name | Properties | Grossing Revenue | Stay Reviews | Avg Rating |
|---|---|---|---|---|
| Diego | 12 | $255,426 | 788 | 4.68/5.0 |
| A Plus | 18 | $153,492 | 215 | 4.77/5.0 |
| Eynar | 10 | $143,619 | 968 | 4.81/5.0 |
| Smart Living | 21 | $91,441 | 1396 | 4.64/5.0 |
| Cami | 9 | $85,403 | 900 | 4.73/5.0 |
| Dinora | 9 | $60,785 | 72 | 4.88/5.0 |
| Juan David | 2 | $60,675 | 101 | 4.86/5.0 |
| Sandra Marina | 6 | $58,565 | 203 | 4.61/5.0 |
| Ecuarent | 7 | $54,763 | 35 | 4.58/5.0 |
| Willy | 2 | $54,699 | 120 | 4.89/5.0 |
Analyzing the strategies of top hosts, such as their property selection, pricing, and guest communication, can offer valuable lessons for optimizing your own Airbnb operations in Calidonia.
Dive Deeper: Advanced Calidonia STR Market Data (2026)
Ready to unlock more insights? AirROI provides access to advanced metrics and comprehensive Airbnb data for Calidonia. Explore detailed analytics beyond this report to refine your investment strategy, optimize pricing, and maximize your vacation rental profits.
Explore Advanced MetricsCalidonia Short-Term Rental Market Composition (2026): Property & Room Types
Room Type Distribution
Property Type Distribution
Market Composition Insights for Calidonia
- The Calidonia Airbnb market composition is heavily skewed towards Entire Home/Apt listings, which make up 81.7% of the 224 active rentals. This indicates strong guest preference for privacy and space.
- Looking at the property type distribution in Calidonia, Apartment/Condo properties are the most common (85.3%), reflecting the local real estate landscape.
- The presence of 14.7% Hotel/Boutique listings indicates integration with traditional hospitality.
Calidonia Airbnb Room Capacity Analysis (2026): Bedroom Distribution
Distribution of Listings by Number of Bedrooms
Room Capacity Insights for Calidonia
- The dominant room capacity in Calidonia is 1 bedroom listings, making up 69.6% of the market. This suggests a strong demand for properties suitable for couples or solo travelers.
- Together, 1 bedroom and 2 bedrooms properties represent 92.4% of the active Airbnb listings in Calidonia, indicating a high concentration in these sizes.
- With over half the market (69.6%) consisting of studios or 1-bedroom units, Calidonia is particularly well-suited for individuals or couples.
- Listings with 3+ bedrooms (2.1%) represent a smaller niche, potentially indicating an underserved market for larger group accommodations in Calidonia.
Calidonia Vacation Rental Guest Capacity Trends (2026)
Distribution of Listings by Guest Capacity
Guest Capacity Insights for Calidonia
- The most common guest capacity trend in Calidonia vacation rentals is listings accommodating 2 guests (43.3%). This suggests the primary traveler segment is likely couples or solo travelers.
- Properties designed for 2 guests and 4 guests dominate the Calidonia STR market, accounting for 68.7% of listings.
- A significant 44.2% of listings cater specifically to 1-2 guests, highlighting strong demand from couples and solo travelers in Calidonia.
- On average, properties in Calidonia are equipped to host 3.0 guests.
Calidonia Airbnb Booking Patterns (2026): Available vs. Booked Days
Available Days Distribution
Booked Days Distribution
Booking Pattern Insights for Calidonia
- The most common availability pattern in Calidonia falls within the 271-366 days range, representing 45.5% of listings. This suggests many properties have significant open periods on their calendars.
- Approximately 75.4% of listings show high availability (181+ days open annually), indicating potential for increased bookings or specific owner usage patterns.
- For booked days, the 91-180 days range is most frequent in Calidonia (29.9%), reflecting common guest stay durations or potential owner blocking patterns.
- A notable 25.0% of properties secure long booking periods (181+ days booked per year), highlighting successful long-term rental strategies or significant owner usage.
Calidonia Airbnb Minimum Stay Requirements Analysis
Distribution of Listings by Minimum Night Requirement
1 Night
92 listings
41.1% of total
2 Nights
21 listings
9.4% of total
3 Nights
27 listings
12.1% of total
4-6 Nights
9 listings
4% of total
7-29 Nights
25 listings
11.2% of total
30+ Nights
50 listings
22.3% of total
Key Insights
- The most prevalent minimum stay requirement in Calidonia is 1 Night, adopted by 41.1% of listings. This highlights the market's preference for shorter, flexible bookings.
- A significant segment (22.3%) caters to monthly stays (30+ nights) in Calidonia, pointing to opportunities in the extended-stay market.
Recommendations
- Align with the market by considering a 1 Night minimum stay, as 41.1% of Calidonia hosts use this setting.
- Explore offering discounts for stays of 30+ nights to attract the 22.3% of the market seeking extended stays.
- Adjust minimum nights based on seasonality – potentially shorter during low season and longer during peak demand periods in Calidonia.
Calidonia Airbnb Cancellation Policy Trends Analysis (2026)
Limited
1 listings
0.4% of total
Flexible
86 listings
38.4% of total
Moderate
62 listings
27.7% of total
Firm
39 listings
17.4% of total
Strict
36 listings
16.1% of total
Cancellation Policy Insights for Calidonia
- The prevailing Airbnb cancellation policy trend in Calidonia is Flexible, used by 38.4% of listings.
- There's a relatively balanced mix between guest-friendly (66.1%) and stricter (33.5%) policies, offering choices for different guest needs.
Recommendations for Hosts
- Consider adopting a Flexible policy to align with the 38.4% market standard in Calidonia.
- Regularly review your cancellation policy against competitors and market demand shifts in Calidonia.
Calidonia STR Booking Lead Time Analysis (2026)
Average Booking Lead Time by Month
Booking Lead Time Insights for Calidonia
- The overall average booking lead time for vacation rentals in Calidonia is 26 days.
- Guests book furthest in advance for stays during January (average 41 days), likely coinciding with peak travel demand or local events.
- The shortest booking windows occur for stays in June (average 19 days), indicating more last-minute travel plans during this time.
- Seasonally, Winter (34 days avg.) sees the longest lead times, while Spring (22 days avg.) has the shortest, reflecting typical travel planning cycles.
Recommendations for Hosts
- Use the overall average lead time (26 days) as a baseline for your pricing and availability strategy in Calidonia.
- For January stays, consider implementing length-of-stay discounts or slightly higher rates for bookings made less than 41 days out to capitalize on advance planning.
- Target marketing efforts for the Winter season well in advance (at least 34 days) to capture early planners.
- Monitor your own booking lead times against these Calidonia averages to identify opportunities for dynamic pricing adjustments.
Popular & Essential Airbnb Amenities in Calidonia (2026)
Amenity Prevalence
Amenity Insights for Calidonia
- Essential amenities in Calidonia that guests expect include: Wifi, Air conditioning, TV. Lacking these (any) could significantly impact bookings.
- Popular amenities like Kitchen, Washer, Dedicated workspace are common but not universal. Offering these can provide a competitive edge.
Recommendations for Hosts
- Ensure your listing includes all essential amenities for Calidonia: Wifi, Air conditioning, TV.
- Prioritize adding missing essentials: Wifi, Air conditioning, TV.
- Consider adding popular differentiators like Kitchen or Washer to increase appeal.
- Highlight unique or less common amenities you offer (e.g., hot tub, dedicated workspace, EV charger) in your listing description and photos.
- Regularly check competitor amenities in Calidonia to stay competitive.
Calidonia Airbnb Guest Demographics & Profile Analysis (2026)
Guest Profile Summary for Calidonia
- The typical guest profile for Airbnb in Calidonia consists of predominantly international visitors (92%), with top international origins including Colombia, typically belonging to the Post-2000s (Gen Z/Alpha) group (50%), primarily speaking English or Spanish.
- Domestic travelers account for 8.4% of guests.
- Key international markets include United States (29.4%) and Colombia (10%).
- Top languages spoken are English (40.7%) followed by Spanish (37.4%).
- A significant demographic segment is the Post-2000s (Gen Z/Alpha) group, representing 50% of guests.
Recommendations for Hosts
- Focus marketing internationally, particularly towards travelers from Colombia.
- Tailor amenities and listing descriptions to appeal to the dominant Post-2000s (Gen Z/Alpha) demographic (e.g., highlight fast WiFi, smart home features, local guides).
- Highlight unique local experiences or amenities relevant to the primary guest profile.
- Consider seasonal promotions aligned with peak travel times for key origin markets.
Nearby Short-Term Rental Market Comparison
How does the Calidonia Airbnb market stack up against its neighbors? Compare key performance metrics like average monthly revenue, ADR, and occupancy rates in surrounding areas to understand the broader regional STR landscape.
| Market | Active Properties | Monthly Revenue | Daily Rate | Avg. Occupancy |
|---|---|---|---|---|
| Buenaventura | 20 | $4,890 | $468.15 | 34% |
| Maria Chiquita | 67 | $4,328 | $406.29 | 37% |
| Las Escobas del Venado | 70 | $2,317 | $276.78 | 38% |
| Palenque | 10 | $2,139 | $507.89 | 20% |
| El Chirú | 65 | $2,076 | $348.55 | 28% |
| Playa Venao | 70 | $2,019 | $272.09 | 33% |
| San Blas Islands | 33 | $1,776 | $400.01 | 25% |
| Altos del Maria | 19 | $1,727 | $167.91 | 38% |
| Saboga | 62 | $1,721 | $341.99 | 27% |
| María Chiquita | 56 | $1,645 | $242.36 | 25% |