Whangapoua Airbnb Market Analysis 2026: Short Term Rental Data & Vacation Rental Statistics in Waikato, New Zealand
Is Airbnb profitable in Whangapoua in 2026? Explore comprehensive Airbnb analytics for Whangapoua, Waikato, New Zealand to uncover income potential. This 2026 STR market report for Whangapoua, based on AirROI data from February 2025 to January 2026, reveals key trends in the niche market of 32 active listings.
Whether you're considering an Airbnb investment in Whangapoua, optimizing your existing vacation rental, or exploring rental arbitrage opportunities, understanding the Whangapoua Airbnb data is crucial. Leveraging the low regulation environment is key to maximizing your short term rental income potential. Let's dive into the specifics.
Key Whangapoua Airbnb Performance Metrics Overview
Monthly Airbnb Revenue Variations & Income Potential in Whangapoua (2026)
Understanding the monthly revenue variations for Airbnb listings in Whangapoua is key to maximizing your short term rental income potential. Seasonality significantly impacts earnings. Our analysis, based on data from the past 12 months, shows that the peak revenue month for STRs in Whangapoua is typically March, while July often presents the lowest earnings, highlighting opportunities for strategic pricing adjustments during shoulder and low seasons. Explore the typical Airbnb income in Whangapoua across different performance tiers:
- Best-in-class properties (Top 10%) achieve $3,315+ monthly, often utilizing dynamic pricing and superior guest experiences.
- Strong performing properties (Top 25%) earn $2,166 or more, indicating effective management and desirable locations/amenities.
- Typical properties (Median) generate around $1,137 per month, representing the average market performance.
- Entry-level properties (Bottom 25%) see earnings around $574, often with potential for optimization.
Average Monthly Airbnb Earnings Trend in Whangapoua
Whangapoua Airbnb Occupancy Rate Trends (2026)
Maximize your bookings by understanding the Whangapoua STR occupancy trends. Seasonal demand shifts significantly influence how often properties are booked. Typically, Decembersees the highest demand (peak season occupancy), while July experiences the lowest (low season). Effective strategies, like adjusting minimum stays or offering promotions, can boost occupancy during slower periods. Here's how different property tiers perform in Whangapoua:
- Best-in-class properties (Top 10%) achieve 68%+ occupancy, indicating high desirability and potentially optimized availability.
- Strong performing properties (Top 25%) maintain 48% or higher occupancy, suggesting good market fit and guest satisfaction.
- Typical properties (Median) have an occupancy rate around 21%.
- Entry-level properties (Bottom 25%) average 8% occupancy, potentially facing higher vacancy.
Average Monthly Occupancy Rate Trend in Whangapoua
Average Daily Rate (ADR) Airbnb Trends in Whangapoua (2026)
Effective short term rental pricing strategy in Whangapoua involves understanding monthly ADR fluctuations. The Average Daily Rate (ADR) for Airbnb in Whangapoua typically peaks in February and dips lowest during September. Leveraging Airbnb dynamic pricing tools or strategies based on this seasonality can significantly boost revenue. Here's a look at the typical nightly rates achieved:
- Best-in-class properties (Top 10%) command rates of $577+ per night, often due to premium features or locations.
- Strong performing properties (Top 25%) achieve nightly rates of $298 or more.
- Typical properties (Median) charge around $187 per night.
- Entry-level properties (Bottom 25%) earn around $116 per night.
Average Daily Rate (ADR) Trend by Month in Whangapoua
Get Live Whangapoua Market Intelligence 👇

Explore Real-time Analytics
Airbnb Seasonality Analysis & Trends in Whangapoua (2026)
Peak Season (March, April, December)
- Revenue averages $2,080 per month
- Occupancy rates average 37.1%
- Daily rates average $300
Shoulder Season
- Revenue averages $1,530 per month
- Occupancy maintains around 29.4%
- Daily rates hold near $290
Low Season (June, July, September)
- Revenue drops to average $1,098 per month
- Occupancy decreases to average 23.9%
- Daily rates adjust to average $283
Seasonality Insights for Whangapoua
- The Airbnb seasonality in Whangapoua shows highly seasonal trends requiring careful strategy. While the sections above show seasonal averages, it's also insightful to look at the extremes:
- During the high season, the absolute peak month showcases Whangapoua's highest earning potential, with monthly revenues capable of climbing to $2,130, occupancy reaching a high of 42.8%, and ADRs peaking at $324.
- Conversely, the slowest single month of the year, typically falling within the low season, marks the market's lowest point. In this month, revenue might dip to $1,007, occupancy could drop to 17.2%, and ADRs may adjust down to $250.
- Understanding both the seasonal averages and these monthly peaks and troughs in revenue, occupancy, and ADR is crucial for maximizing your Airbnb profit potential in Whangapoua.
Seasonal Strategies for Maximizing Profit
- Peak Season: Maximize revenue through premium pricing and potentially longer minimum stays. Ensure high availability.
- Low Season: Offer competitive pricing, special promotions (e.g., extended stay discounts), and flexible cancellation policies. Target off-season travelers like remote workers or budget-conscious guests.
- Shoulder Seasons: Implement dynamic pricing that balances peak and low rates. Target weekend travelers or specific events. Offer slightly more flexible terms than peak season.
- Regularly analyze your own performance against these Whangapoua seasonality benchmarks and adjust your pricing and availability strategy accordingly.
Best Areas for Airbnb Investment in Whangapoua (2026)
Exploring the top neighborhoods for short-term rentals in Whangapoua? This section highlights key areas, outlining why they are attractive for hosts and guests, along with notable local attractions. Consider these locations based on your target guest profile and investment strategy.
| Neighborhood / Area | Why Host Here? (Target Guests & Appeal) | Key Attractions & Landmarks |
|---|---|---|
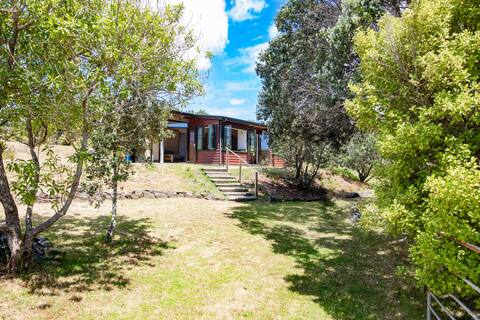
| Whangapoua Beach | A stunning beach location ideal for summer getaways, known for its golden sands and crystal clear waters. Attractive for families and tourists seeking a beach holiday experience. | Whangapoua Beach, Coromandel Forest Park, Otama Beach, Pauanui Beach, Fishing and boating activities |
| The 309 Road | A scenic drive through lush rainforest, providing access to the popular Waterworks and various walking tracks. It appeals to nature lovers and adventurers. | The Waterworks, Walking tracks, Scenic viewpoints, Cycle trails, Coromandel township |
| Colville Bay | A remote and tranquil area offering beautiful coastal scenery, popular for its peaceful vacation rentals, ideal for those seeking solitude and nature. | Colville Bay beach, Local art galleries, Fishing spots, Bush walks, Wildlife observation |
| Coromandel Town | Known for its charming heritage and gold mining history, Coromandel Town attracts visitors for its unique shops and local cuisine. | Gold Mine Experiences, Coromandel's Hot Water Beach, Local restaurants, Rugged coastline, Pingao Glow Worm Cave |
| Pauanui | A family-friendly resort town with great amenities and access to beautiful beaches, it's popular among families and groups. | Pauanui Beach, Golf course, Surfing, Tairua River activities, Walking tracks |
| Tairua | A picturesque coastal town known for its surfing and laid-back vibe, drawing both adventure seekers and families. | Tairua Beach, Paku Hill walking track, Tairua River, Local cafes, Surf spots |
| Matarangi | A tranquil beach community that offers a range of outdoor activities like fishing and golf, appealing to retirees and vacationers. | Matarangi Beach, Golf course, Sea kayaking, Water sports, Fishing spots |
| Orokawa Bay | A secluded bay known for its natural beauty and hiking trail access, perfect for those looking for stunning views and nature experiences. | Orokawa Bay beach, Hiking trails, Nature walks, Wildlife observation, Swimming areas |
Understanding Airbnb License Requirements & STR Laws in Whangapoua (2026)
While Whangapoua, Waikato, New Zealand currently shows low STR regulations, specific Airbnb license requirements might still exist or change. Always verify the latest short term rental regulations and Airbnb license requirements directly with local government authorities for Whangapoua to ensure full compliance before hosting.
(Source: AirROI data, 2026, finding no licensed listings among those analyzed)
Top Performing Airbnb Properties in Whangapoua (2026)
Benchmark your potential! Explore examples of top-performing Airbnb properties in Whangapouabased on Trailing Twelve Month (TTM) revenue. Analyze their characteristics, revenue, occupancy rate, and ADR to understand what drives success in this market.

Coromandel Bliss in Whangapoua
Entire Place • 5 bedrooms
Whangapoua Family Bach - 100m from the beach!
Entire Place • 1 bedroom
NewChums Linen provided Kathrynmacphail1@g
Entire Place • 3 bedrooms
Secluded hideaway with a view
Entire Place • 1 bedroom

Awa Coastal Home Whangapoua I New Chums Beach
Entire Place • 3 bedrooms
Bright & Breezy Whangapoua Haven
Entire Place • 4 bedrooms
Note: Performance varies based on location, size, amenities, seasonality, and management quality. Data reflects the past 12 months.
Top Performing Airbnb Hosts in Whangapoua (2026)
Learn from the best! This table showcases top-performing Airbnb hosts in Whangapoua based on the number of properties managed and estimated total revenue over the past year. Analyze their scale and performance metrics.
| Host Name | Properties | Grossing Revenue | Stay Reviews | Avg Rating |
|---|---|---|---|---|
| Roberta | 1 | $44,385 | 6 | 5.00/5.0 |
| Bachcare | 6 | $40,348 | 27 | 4.72/5.0 |
| Tim | 1 | $34,418 | 38 | 4.92/5.0 |
| Kathryn And David | 1 | $29,826 | 31 | 4.84/5.0 |
| Michelle And Lance | 6 | $27,977 | 237 | 4.93/5.0 |
| Lauryn | 1 | $27,218 | 72 | 4.90/5.0 |
| Sue | 1 | $26,030 | 24 | 5.00/5.0 |
| Jennie | 1 | $23,627 | 6 | 4.67/5.0 |
| Louise | 1 | $19,852 | 63 | 4.62/5.0 |
| Matt | 1 | $16,013 | 19 | 4.89/5.0 |
Analyzing the strategies of top hosts, such as their property selection, pricing, and guest communication, can offer valuable lessons for optimizing your own Airbnb operations in Whangapoua.
Dive Deeper: Advanced Whangapoua STR Market Data (2026)
Ready to unlock more insights? AirROI provides access to advanced metrics and comprehensive Airbnb data for Whangapoua. Explore detailed analytics beyond this report to refine your investment strategy, optimize pricing, and maximize your vacation rental profits.
Explore Advanced MetricsWhangapoua Short-Term Rental Market Composition (2026): Property & Room Types
Room Type Distribution
Property Type Distribution
Market Composition Insights for Whangapoua
- The Whangapoua Airbnb market composition is heavily skewed towards Entire Home/Apt listings, which make up 90.6% of the 32 active rentals. This indicates strong guest preference for privacy and space.
- Looking at the property type distribution in Whangapoua, House properties are the most common (75%), reflecting the local real estate landscape.
- Houses represent a significant 75% portion, catering likely to families or larger groups.
- Smaller segments like hotel/boutique, others (combined 6.2%) offer potential for unique stay experiences.
Whangapoua Airbnb Room Capacity Analysis (2026): Bedroom Distribution
Distribution of Listings by Number of Bedrooms
Room Capacity Insights for Whangapoua
- The dominant room capacity in Whangapoua is 3 bedrooms listings, making up 31.3% of the market. This suggests a strong demand for properties suitable for families or small groups.
- Together, 3 bedrooms and 4 bedrooms properties represent 53.2% of the active Airbnb listings in Whangapoua, indicating a high concentration in these sizes.
- A significant 59.5% of listings offer 3+ bedrooms, catering to larger groups and families seeking more space in Whangapoua.
Whangapoua Vacation Rental Guest Capacity Trends (2026)
Distribution of Listings by Guest Capacity
Guest Capacity Insights for Whangapoua
- The most common guest capacity trend in Whangapoua vacation rentals is listings accommodating 6 guests (34.4%). This suggests the primary traveler segment is likely larger groups.
- Properties designed for 6 guests and 8+ guests dominate the Whangapoua STR market, accounting for 68.8% of listings.
- 75.1% of properties accommodate 6+ guests, serving the market segment for larger families or group travel in Whangapoua.
- On average, properties in Whangapoua are equipped to host 6.2 guests.
Whangapoua Airbnb Booking Patterns (2026): Available vs. Booked Days
Available Days Distribution
Booked Days Distribution
Booking Pattern Insights for Whangapoua
- The most common availability pattern in Whangapoua falls within the 271-366 days range, representing 59.4% of listings. This suggests many properties have significant open periods on their calendars.
- Approximately 93.8% of listings show high availability (181+ days open annually), indicating potential for increased bookings or specific owner usage patterns.
- For booked days, the 1-30 days range is most frequent in Whangapoua (40.6%), reflecting common guest stay durations or potential owner blocking patterns.
- A notable 6.3% of properties secure long booking periods (181+ days booked per year), highlighting successful long-term rental strategies or significant owner usage.
Whangapoua Airbnb Minimum Stay Requirements Analysis
Distribution of Listings by Minimum Night Requirement
1 Night
6 listings
18.8% of total
2 Nights
12 listings
37.5% of total
30+ Nights
14 listings
43.8% of total
Key Insights
- The most prevalent minimum stay requirement in Whangapoua is 30+ Nights, adopted by 43.8% of listings. This highlights the market's preference for longer commitments.
- A significant segment (43.8%) caters to monthly stays (30+ nights) in Whangapoua, pointing to opportunities in the extended-stay market.
Recommendations
- Align with the market by considering a 30+ Nights minimum stay, as 43.8% of Whangapoua hosts use this setting.
- If feasible, allowing 1-night stays, especially midweek or during low season, could capture last-minute bookings, as only 18.8% currently do.
- A 2-night minimum appears standard (37.5%). Consider this for weekends or peak periods.
- Explore offering discounts for stays of 30+ nights to attract the 43.8% of the market seeking extended stays.
- Adjust minimum nights based on seasonality – potentially shorter during low season and longer during peak demand periods in Whangapoua.
Whangapoua Airbnb Cancellation Policy Trends Analysis (2026)
Limited
1 listings
3.1% of total
Flexible
7 listings
21.9% of total
Moderate
1 listings
3.1% of total
Firm
16 listings
50% of total
Strict
7 listings
21.9% of total
Cancellation Policy Insights for Whangapoua
- The prevailing Airbnb cancellation policy trend in Whangapoua is Firm, used by 50% of listings.
- A majority (71.9%) of hosts in Whangapoua utilize Firm or Strict policies, indicating a market where hosts prioritize booking security.
Recommendations for Hosts
- Consider adopting a Firm policy to align with the 50% market standard in Whangapoua.
- Regularly review your cancellation policy against competitors and market demand shifts in Whangapoua.
Whangapoua STR Booking Lead Time Analysis (2026)
Average Booking Lead Time by Month
Booking Lead Time Insights for Whangapoua
- The overall average booking lead time for vacation rentals in Whangapoua is 49 days.
- Guests book furthest in advance for stays during December (average 92 days), likely coinciding with peak travel demand or local events.
- The shortest booking windows occur for stays in June (average 7 days), indicating more last-minute travel plans during this time.
- Seasonally, Winter (73 days avg.) sees the longest lead times, while Summer (9 days avg.) has the shortest, reflecting typical travel planning cycles.
Recommendations for Hosts
- Use the overall average lead time (49 days) as a baseline for your pricing and availability strategy in Whangapoua.
- For December stays, consider implementing length-of-stay discounts or slightly higher rates for bookings made less than 92 days out to capitalize on advance planning.
- During June, focus on last-minute booking availability and promotions, as guests book with very short notice (7 days avg.).
- Target marketing efforts for the Winter season well in advance (at least 73 days) to capture early planners.
- Monitor your own booking lead times against these Whangapoua averages to identify opportunities for dynamic pricing adjustments.
Popular & Essential Airbnb Amenities in Whangapoua (2026)
Amenity Prevalence
Amenity Insights for Whangapoua
- Popular amenities like Free parking on premises, Kitchen, Refrigerator are common but not universal. Offering these can provide a competitive edge.
- Warning: Wifi is not universally provided but is considered essential globally. Ensure reliable Wifi is offered.
Recommendations for Hosts
- Consider adding popular differentiators like Free parking on premises or Kitchen to increase appeal.
- Highlight unique or less common amenities you offer (e.g., hot tub, dedicated workspace, EV charger) in your listing description and photos.
- Regularly check competitor amenities in Whangapoua to stay competitive.
Whangapoua Airbnb Guest Demographics & Profile Analysis (2026)
Guest Profile Summary for Whangapoua
- The typical guest profile for Airbnb in Whangapoua consists of primarily domestic travelers (67%), often arriving from nearby Auckland, typically belonging to the Post-2000s (Gen Z/Alpha) group (50%), primarily speaking English or French.
- Domestic travelers account for 66.9% of guests.
- Key international markets include New Zealand (66.9%) and United Kingdom (10.2%).
- Top languages spoken are English (69.8%) followed by French (11.3%).
- A significant demographic segment is the Post-2000s (Gen Z/Alpha) group, representing 50% of guests.
Recommendations for Hosts
- Target domestic marketing efforts towards travelers from Auckland and Wellington.
- Tailor amenities and listing descriptions to appeal to the dominant Post-2000s (Gen Z/Alpha) demographic (e.g., highlight fast WiFi, smart home features, local guides).
- Highlight unique local experiences or amenities relevant to the primary guest profile.
- Consider seasonal promotions aligned with peak travel times for key origin markets.
Nearby Short-Term Rental Market Comparison
How does the Whangapoua Airbnb market stack up against its neighbors? Compare key performance metrics like average monthly revenue, ADR, and occupancy rates in surrounding areas to understand the broader regional STR landscape.
| Market | Active Properties | Monthly Revenue | Daily Rate | Avg. Occupancy |
|---|---|---|---|---|
| Hot Water Beach | 27 | $2,949 | $257.55 | 50% |
| Whananaki | 14 | $2,368 | $364.38 | 36% |
| Waiheke | 580 | $2,274 | $338.47 | 32% |
| Hahei | 104 | $2,241 | $260.25 | 39% |
| Opito Bay | 16 | $1,911 | $294.47 | 29% |
| Karapiro | 40 | $1,865 | $206.22 | 37% |
| Waitematā | 1,525 | $1,702 | $146.61 | 50% |
| Rukuhia | 10 | $1,675 | $216.31 | 33% |
| Mount Maunganui | 41 | $1,669 | $194.05 | 40% |
| Tamahere | 76 | $1,665 | $198.77 | 39% |