Waitomo Airbnb Market Analysis 2026: Short Term Rental Data & Vacation Rental Statistics in Waikato, New Zealand
Is Airbnb profitable in Waitomo in 2026? Explore comprehensive Airbnb analytics for Waitomo, Waikato, New Zealand to uncover income potential. This 2026 STR market report for Waitomo, based on AirROI data from February 2025 to January 2026, reveals key trends in the niche market of 24 active listings.
Whether you're considering an Airbnb investment in Waitomo, optimizing your existing vacation rental, or exploring rental arbitrage opportunities, understanding the Waitomo Airbnb data is crucial. Leveraging the low regulation environment is key to maximizing your short term rental income potential. Let's dive into the specifics.
Key Waitomo Airbnb Performance Metrics Overview
Monthly Airbnb Revenue Variations & Income Potential in Waitomo (2026)
Understanding the monthly revenue variations for Airbnb listings in Waitomo is key to maximizing your short term rental income potential. Seasonality significantly impacts earnings. Our analysis, based on data from the past 12 months, shows that the peak revenue month for STRs in Waitomo is typically December, while June often presents the lowest earnings, highlighting opportunities for strategic pricing adjustments during shoulder and low seasons. Explore the typical Airbnb income in Waitomo across different performance tiers:
- Best-in-class properties (Top 10%) achieve $3,457+ monthly, often utilizing dynamic pricing and superior guest experiences.
- Strong performing properties (Top 25%) earn $2,348 or more, indicating effective management and desirable locations/amenities.
- Typical properties (Median) generate around $1,286 per month, representing the average market performance.
- Entry-level properties (Bottom 25%) see earnings around $630, often with potential for optimization.
Average Monthly Airbnb Earnings Trend in Waitomo
Waitomo Airbnb Occupancy Rate Trends (2026)
Maximize your bookings by understanding the Waitomo STR occupancy trends. Seasonal demand shifts significantly influence how often properties are booked. Typically, Decembersees the highest demand (peak season occupancy), while June experiences the lowest (low season). Effective strategies, like adjusting minimum stays or offering promotions, can boost occupancy during slower periods. Here's how different property tiers perform in Waitomo:
- Best-in-class properties (Top 10%) achieve 74%+ occupancy, indicating high desirability and potentially optimized availability.
- Strong performing properties (Top 25%) maintain 54% or higher occupancy, suggesting good market fit and guest satisfaction.
- Typical properties (Median) have an occupancy rate around 35%.
- Entry-level properties (Bottom 25%) average 21% occupancy, potentially facing higher vacancy.
Average Monthly Occupancy Rate Trend in Waitomo
Average Daily Rate (ADR) Airbnb Trends in Waitomo (2026)
Effective short term rental pricing strategy in Waitomo involves understanding monthly ADR fluctuations. The Average Daily Rate (ADR) for Airbnb in Waitomo typically peaks in April and dips lowest during November. Leveraging Airbnb dynamic pricing tools or strategies based on this seasonality can significantly boost revenue. Here's a look at the typical nightly rates achieved:
- Best-in-class properties (Top 10%) command rates of $180+ per night, often due to premium features or locations.
- Strong performing properties (Top 25%) achieve nightly rates of $140 or more.
- Typical properties (Median) charge around $118 per night.
- Entry-level properties (Bottom 25%) earn around $75 per night.
Average Daily Rate (ADR) Trend by Month in Waitomo
Get Live Waitomo Market Intelligence 👇

Explore Real-time Analytics
Airbnb Seasonality Analysis & Trends in Waitomo (2026)
Peak Season (December, April, January)
- Revenue averages $2,153 per month
- Occupancy rates average 49.7%
- Daily rates average $121
Shoulder Season
- Revenue averages $1,647 per month
- Occupancy maintains around 40.8%
- Daily rates hold near $122
Low Season (June, August, September)
- Revenue drops to average $1,035 per month
- Occupancy decreases to average 25.3%
- Daily rates adjust to average $121
Seasonality Insights for Waitomo
- The Airbnb seasonality in Waitomo shows highly seasonal trends requiring careful strategy. While the sections above show seasonal averages, it's also insightful to look at the extremes:
- During the high season, the absolute peak month showcases Waitomo's highest earning potential, with monthly revenues capable of climbing to $2,219, occupancy reaching a high of 52.5%, and ADRs peaking at $124.
- Conversely, the slowest single month of the year, typically falling within the low season, marks the market's lowest point. In this month, revenue might dip to $992, occupancy could drop to 23.9%, and ADRs may adjust down to $118.
- Understanding both the seasonal averages and these monthly peaks and troughs in revenue, occupancy, and ADR is crucial for maximizing your Airbnb profit potential in Waitomo.
Seasonal Strategies for Maximizing Profit
- Peak Season: Maximize revenue through premium pricing and potentially longer minimum stays. Ensure high availability.
- Low Season: Offer competitive pricing, special promotions (e.g., extended stay discounts), and flexible cancellation policies. Target off-season travelers like remote workers or budget-conscious guests.
- Shoulder Seasons: Implement dynamic pricing that balances peak and low rates. Target weekend travelers or specific events. Offer slightly more flexible terms than peak season.
- Regularly analyze your own performance against these Waitomo seasonality benchmarks and adjust your pricing and availability strategy accordingly.
Best Areas for Airbnb Investment in Waitomo (2026)
Exploring the top neighborhoods for short-term rentals in Waitomo? This section highlights key areas, outlining why they are attractive for hosts and guests, along with notable local attractions. Consider these locations based on your target guest profile and investment strategy.
| Neighborhood / Area | Why Host Here? (Target Guests & Appeal) | Key Attractions & Landmarks |
|---|---|---|
| Waitomo Caves | Famous for its stunning limestone formations and glowworm caves, a must-visit for tourists looking for unique underground experiences. | Waitomo Glowworm Caves, Ruakuri Cave, Waitomo Caves Museum, Black Water Rafting, Te Ana-au Glowworm Cave, Mangapu River |
| Otorohanga | Known as the Kiwiana capital, Otorohanga provides visitors with a taste of New Zealand culture and is close to key attractions. | Otorohanga Kiwi House, Otorohanga Museum, Kiwiana Park, Otorohanga i-SITE Visitor Centre, Woodlyn Park, Mangapohue Natural Bridge |
| Te Kuiti | The sheep shearing capital of the world, offering a unique rural experience with easy access to adventure activities in the surrounding areas. | Te Kuiti's Shears, The Waitomo District, Huntly's Hill, Te Kuiti Railway Station, Mangarapoo Beach, Te Kuiti Museum |
| King Country | Rich in Maori history and natural beauty, perfect for those looking for adventure and cultural encounters. | Waitomo Village, Marokopa Falls, Ngutunguru Valley, Otorohanga Bird Foreshore, Te Kuiti Caves, Te Awamutu Museum |
| Piopio | A quaint village with a relaxed atmosphere, close to stunning rural landscapes and local wildlife attractions. | Piopio Heritage Centre, Mokau River, Pirongia Forest Park, Te Kuiti Golf Club, Wharepuhunga Walkway, Piopio's Famous Pies |
| Mokau | A coastal village known for beautiful beaches, fishing opportunities, and stunning sunsets, a perfect getaway for nature lovers. | Mokau River, Mokau Beach, Beachfront Cafe, Mokau Lookout, Fishing Charters, The Cliffs |
| Raglan | A surf town famous for its beaches and relaxed vibe, attracting surfers and beachgoers looking for a laid-back lifestyle. | Raglan Beach, Ngarunui Beach, Raglan Wharf, Kayaking tours, Surfing lessons, Raglan's Art Scene |
| Te Awamutu | A friendly rural community with access to beautiful gardens, parks, and local markets, ideal for families and relaxed vacations. | Te Awamutu Rose Gardens, Te Awamutu Museum, Arapuni Hydro Dam, Te Ata Road Park, Local Farmers Market, Mokau Walks |
Understanding Airbnb License Requirements & STR Laws in Waitomo (2026)
While Waitomo, Waikato, New Zealand currently shows low STR regulations, specific Airbnb license requirements might still exist or change. Always verify the latest short term rental regulations and Airbnb license requirements directly with local government authorities for Waitomo to ensure full compliance before hosting.
(Source: AirROI data, 2026, finding no licensed listings among those analyzed)
Top Performing Airbnb Properties in Waitomo (2026)
Benchmark your potential! Explore examples of top-performing Airbnb properties in Waitomobased on Trailing Twelve Month (TTM) revenue. Analyze their characteristics, revenue, occupancy rate, and ADR to understand what drives success in this market.

Te Tiro Glamping Tent & Glowworms
Entire Place • 1 bedroom

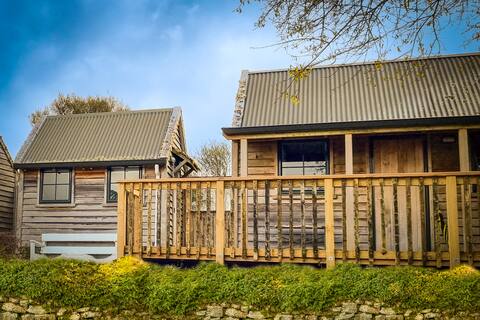
Waitomo Golf Ridge
Entire Place • 5 bedrooms

Te Tiro Cottage Two & Glowworms
Entire Place • 1 bedroom
Te Tiro Cottage One & Glowworms
Entire Place • 1 bedroom

Rock Retreat B&B,stunning views.
Entire Place • 1 bedroom
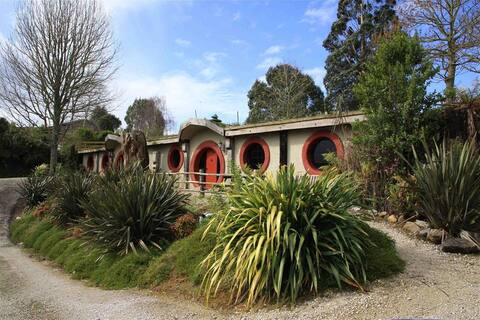
Waitomo Woodlyn Park Hobbit Motel
Entire Place • 2 bedrooms
Note: Performance varies based on location, size, amenities, seasonality, and management quality. Data reflects the past 12 months.
Top Performing Airbnb Hosts in Waitomo (2026)
Learn from the best! This table showcases top-performing Airbnb hosts in Waitomo based on the number of properties managed and estimated total revenue over the past year. Analyze their scale and performance metrics.
| Host Name | Properties | Grossing Revenue | Stay Reviews | Avg Rating |
|---|---|---|---|---|
| Rachel And Angus | 3 | $122,700 | 727 | 4.97/5.0 |
| Woodlyn | 6 | $99,904 | 715 | 4.50/5.0 |
| Keri | 1 | $44,499 | 78 | 4.95/5.0 |
| Waitomo Big Bird B&B / Petting | 3 | $36,530 | 1102 | 4.65/5.0 |
| Biddy | 1 | $29,153 | 711 | 4.95/5.0 |
| Peter | 2 | $21,675 | 99 | 4.71/5.0 |
| Anne | 3 | $17,639 | 378 | 4.77/5.0 |
| Pam | 2 | $15,412 | 26 | 4.92/5.0 |
| Louise | 2 | $10,075 | 1146 | 4.79/5.0 |
| Trevor | 1 | $7,976 | 57 | 4.88/5.0 |
Analyzing the strategies of top hosts, such as their property selection, pricing, and guest communication, can offer valuable lessons for optimizing your own Airbnb operations in Waitomo.
Dive Deeper: Advanced Waitomo STR Market Data (2026)
Ready to unlock more insights? AirROI provides access to advanced metrics and comprehensive Airbnb data for Waitomo. Explore detailed analytics beyond this report to refine your investment strategy, optimize pricing, and maximize your vacation rental profits.
Explore Advanced MetricsWaitomo Short-Term Rental Market Composition (2026): Property & Room Types
Room Type Distribution
Property Type Distribution
Market Composition Insights for Waitomo
- The Waitomo Airbnb market composition is heavily skewed towards Entire Home/Apt listings, which make up 62.5% of the 24 active rentals. This indicates strong guest preference for privacy and space.
- However, a notable 33.3% share for Private Rooms suggests opportunities for budget-conscious travelers or hosts renting out spare rooms.
- Looking at the property type distribution in Waitomo, Outdoor/Unique properties are the most common (33.3%), reflecting the local real estate landscape.
- Houses represent a significant 33.3% portion, catering likely to families or larger groups.
- The presence of 25% Hotel/Boutique listings indicates integration with traditional hospitality.
Waitomo Airbnb Room Capacity Analysis (2026): Bedroom Distribution
Distribution of Listings by Number of Bedrooms
Room Capacity Insights for Waitomo
- The dominant room capacity in Waitomo is 1 bedroom listings, making up 41.7% of the market. This suggests a strong demand for properties suitable for couples or solo travelers.
- Together, 1 bedroom and 2 bedrooms properties represent 75.0% of the active Airbnb listings in Waitomo, indicating a high concentration in these sizes.
- A significant 20.9% of listings offer 3+ bedrooms, catering to larger groups and families seeking more space in Waitomo.
Waitomo Vacation Rental Guest Capacity Trends (2026)
Distribution of Listings by Guest Capacity
Guest Capacity Insights for Waitomo
- The most common guest capacity trend in Waitomo vacation rentals is listings accommodating 4 guests (33.3%). This suggests the primary traveler segment is likely small families or groups.
- Properties designed for 4 guests and 2 guests dominate the Waitomo STR market, accounting for 50.0% of listings.
- 25.0% of properties accommodate 6+ guests, serving the market segment for larger families or group travel in Waitomo.
- On average, properties in Waitomo are equipped to host 4.1 guests.
Waitomo Airbnb Booking Patterns (2026): Available vs. Booked Days
Available Days Distribution
Booked Days Distribution
Booking Pattern Insights for Waitomo
- The most common availability pattern in Waitomo falls within the 271-366 days range, representing 41.7% of listings. This suggests many properties have significant open periods on their calendars.
- Approximately 79.2% of listings show high availability (181+ days open annually), indicating potential for increased bookings or specific owner usage patterns.
- For booked days, the 91-180 days range is most frequent in Waitomo (45.8%), reflecting common guest stay durations or potential owner blocking patterns.
- A notable 20.9% of properties secure long booking periods (181+ days booked per year), highlighting successful long-term rental strategies or significant owner usage.
Waitomo Airbnb Minimum Stay Requirements Analysis
Distribution of Listings by Minimum Night Requirement
1 Night
22 listings
91.7% of total
30+ Nights
2 listings
8.3% of total
Key Insights
- The most prevalent minimum stay requirement in Waitomo is 1 Night, adopted by 91.7% of listings. This highlights the market's preference for shorter, flexible bookings.
- A strong majority (91.7%) of the Waitomo Airbnb data shows acceptance of very short stays (1-2 nights), indicating a dynamic, high-turnover market.
Recommendations
- Align with the market by considering a 1 Night minimum stay, as 91.7% of Waitomo hosts use this setting.
- Explore offering discounts for stays of 30+ nights to attract the 8.3% of the market seeking extended stays.
- Adjust minimum nights based on seasonality – potentially shorter during low season and longer during peak demand periods in Waitomo.
Waitomo Airbnb Cancellation Policy Trends Analysis (2026)
Flexible
8 listings
33.3% of total
Moderate
11 listings
45.8% of total
Firm
5 listings
20.8% of total
Cancellation Policy Insights for Waitomo
- The prevailing Airbnb cancellation policy trend in Waitomo is Moderate, used by 45.8% of listings.
- The market strongly favors guest-friendly terms, with 79.1% of listings offering Flexible or Moderate policies. This suggests guests in Waitomo may expect booking flexibility.
Recommendations for Hosts
- Consider adopting a Moderate policy to align with the 45.8% market standard in Waitomo.
- Regularly review your cancellation policy against competitors and market demand shifts in Waitomo.
Waitomo STR Booking Lead Time Analysis (2026)
Average Booking Lead Time by Month
Booking Lead Time Insights for Waitomo
- The overall average booking lead time for vacation rentals in Waitomo is 74 days.
- Guests book furthest in advance for stays during May (average 98 days), likely coinciding with peak travel demand or local events.
- The shortest booking windows occur for stays in June (average 39 days), indicating more last-minute travel plans during this time.
- Seasonally, Winter (82 days avg.) sees the longest lead times, while Summer (59 days avg.) has the shortest, reflecting typical travel planning cycles.
Recommendations for Hosts
- Use the overall average lead time (74 days) as a baseline for your pricing and availability strategy in Waitomo.
- For May stays, consider implementing length-of-stay discounts or slightly higher rates for bookings made less than 98 days out to capitalize on advance planning.
- Target marketing efforts for the Winter season well in advance (at least 82 days) to capture early planners.
- Monitor your own booking lead times against these Waitomo averages to identify opportunities for dynamic pricing adjustments.
Popular & Essential Airbnb Amenities in Waitomo (2026)
Amenity Prevalence
Amenity Insights for Waitomo
- Essential amenities in Waitomo that guests expect include: Heating, Free parking on premises, Essentials, Smoke alarm, Hot water. Lacking these (any) could significantly impact bookings.
- Popular amenities like TV, Hair dryer, Cooking basics are common but not universal. Offering these can provide a competitive edge.
- Warning: Wifi is not universally provided but is considered essential globally. Ensure reliable Wifi is offered.
Recommendations for Hosts
- Ensure your listing includes all essential amenities for Waitomo: Heating, Free parking on premises, Essentials, Smoke alarm, Hot water.
- Prioritize adding missing essentials: Hot water.
- Consider adding popular differentiators like TV or Hair dryer to increase appeal.
- Highlight unique or less common amenities you offer (e.g., hot tub, dedicated workspace, EV charger) in your listing description and photos.
- Regularly check competitor amenities in Waitomo to stay competitive.
Waitomo Airbnb Guest Demographics & Profile Analysis (2026)
Guest Profile Summary for Waitomo
- The typical guest profile for Airbnb in Waitomo consists of predominantly international visitors (77%), with top international origins including New Zealand, typically belonging to the Post-2000s (Gen Z/Alpha) group (50%), primarily speaking English or Spanish.
- Domestic travelers account for 23.5% of guests.
- Key international markets include United States (28.4%) and New Zealand (23.5%).
- Top languages spoken are English (61.3%) followed by Spanish (7.3%).
- A significant demographic segment is the Post-2000s (Gen Z/Alpha) group, representing 50% of guests.
Recommendations for Hosts
- Focus marketing internationally, particularly towards travelers from New Zealand.
- Tailor amenities and listing descriptions to appeal to the dominant Post-2000s (Gen Z/Alpha) demographic (e.g., highlight fast WiFi, smart home features, local guides).
- Highlight unique local experiences or amenities relevant to the primary guest profile.
- Consider seasonal promotions aligned with peak travel times for key origin markets.
Nearby Short-Term Rental Market Comparison
How does the Waitomo Airbnb market stack up against its neighbors? Compare key performance metrics like average monthly revenue, ADR, and occupancy rates in surrounding areas to understand the broader regional STR landscape.
| Market | Active Properties | Monthly Revenue | Daily Rate | Avg. Occupancy |
|---|---|---|---|---|
| Tikitere | 15 | $2,599 | $238.84 | 48% |
| Hamurana | 28 | $2,555 | $170.74 | 50% |
| Lake Tarawera | 35 | $2,411 | $302.59 | 38% |
| Te Kūiti | 17 | $2,391 | $126.21 | 59% |
| Ngongotahā | 79 | $2,152 | $194.15 | 44% |
| Okere Falls | 32 | $2,118 | $246.61 | 37% |
| Rotorua | 689 | $2,021 | $160.41 | 47% |
| Mourea | 14 | $1,943 | $212.24 | 40% |
| Taupō | 1,004 | $1,942 | $212.13 | 40% |
| Karapiro | 40 | $1,865 | $206.22 | 37% |