Onemana Airbnb Market Analysis 2026: Short Term Rental Data & Vacation Rental Statistics in Waikato, New Zealand
Is Airbnb profitable in Onemana in 2026? Explore comprehensive Airbnb analytics for Onemana, Waikato, New Zealand to uncover income potential. This 2026 STR market report for Onemana, based on AirROI data from February 2025 to January 2026, reveals key trends in the niche market of 26 active listings.
Whether you're considering an Airbnb investment in Onemana, optimizing your existing vacation rental, or exploring rental arbitrage opportunities, understanding the Onemana Airbnb data is crucial. Leveraging the low regulation environment is key to maximizing your short term rental income potential. Let's dive into the specifics.
Key Onemana Airbnb Performance Metrics Overview
Monthly Airbnb Revenue Variations & Income Potential in Onemana (2026)
Understanding the monthly revenue variations for Airbnb listings in Onemana is key to maximizing your short term rental income potential. Seasonality significantly impacts earnings. Our analysis, based on data from the past 12 months, shows that the peak revenue month for STRs in Onemana is typically November, while August often presents the lowest earnings, highlighting opportunities for strategic pricing adjustments during shoulder and low seasons. Explore the typical Airbnb income in Onemana across different performance tiers:
- Best-in-class properties (Top 10%) achieve $8,788+ monthly, often utilizing dynamic pricing and superior guest experiences.
- Strong performing properties (Top 25%) earn $2,292 or more, indicating effective management and desirable locations/amenities.
- Typical properties (Median) generate around $1,141 per month, representing the average market performance.
- Entry-level properties (Bottom 25%) see earnings around $654, often with potential for optimization.
Average Monthly Airbnb Earnings Trend in Onemana
Onemana Airbnb Occupancy Rate Trends (2026)
Maximize your bookings by understanding the Onemana STR occupancy trends. Seasonal demand shifts significantly influence how often properties are booked. Typically, Aprilsees the highest demand (peak season occupancy), while June experiences the lowest (low season). Effective strategies, like adjusting minimum stays or offering promotions, can boost occupancy during slower periods. Here's how different property tiers perform in Onemana:
- Best-in-class properties (Top 10%) achieve 63%+ occupancy, indicating high desirability and potentially optimized availability.
- Strong performing properties (Top 25%) maintain 44% or higher occupancy, suggesting good market fit and guest satisfaction.
- Typical properties (Median) have an occupancy rate around 26%.
- Entry-level properties (Bottom 25%) average 16% occupancy, potentially facing higher vacancy.
Average Monthly Occupancy Rate Trend in Onemana
Average Daily Rate (ADR) Airbnb Trends in Onemana (2026)
Effective short term rental pricing strategy in Onemana involves understanding monthly ADR fluctuations. The Average Daily Rate (ADR) for Airbnb in Onemana typically peaks in January and dips lowest during May. Leveraging Airbnb dynamic pricing tools or strategies based on this seasonality can significantly boost revenue. Here's a look at the typical nightly rates achieved:
- Best-in-class properties (Top 10%) command rates of $382+ per night, often due to premium features or locations.
- Strong performing properties (Top 25%) achieve nightly rates of $250 or more.
- Typical properties (Median) charge around $186 per night.
- Entry-level properties (Bottom 25%) earn around $134 per night.
Average Daily Rate (ADR) Trend by Month in Onemana
Get Live Onemana Market Intelligence 👇

Explore Real-time Analytics
Airbnb Seasonality Analysis & Trends in Onemana (2026)
Peak Season (November, January, February)
- Revenue averages $3,952 per month
- Occupancy rates average 39.0%
- Daily rates average $330
Shoulder Season
- Revenue averages $2,614 per month
- Occupancy maintains around 32.6%
- Daily rates hold near $305
Low Season (May, June, August)
- Revenue drops to average $1,152 per month
- Occupancy decreases to average 23.9%
- Daily rates adjust to average $282
Seasonality Insights for Onemana
- The Airbnb seasonality in Onemana shows highly seasonal trends requiring careful strategy. While the sections above show seasonal averages, it's also insightful to look at the extremes:
- During the high season, the absolute peak month showcases Onemana's highest earning potential, with monthly revenues capable of climbing to $4,590, occupancy reaching a high of 53.3%, and ADRs peaking at $369.
- Conversely, the slowest single month of the year, typically falling within the low season, marks the market's lowest point. In this month, revenue might dip to $995, occupancy could drop to 14.0%, and ADRs may adjust down to $274.
- Understanding both the seasonal averages and these monthly peaks and troughs in revenue, occupancy, and ADR is crucial for maximizing your Airbnb profit potential in Onemana.
Seasonal Strategies for Maximizing Profit
- Peak Season: Maximize revenue through premium pricing and potentially longer minimum stays. Ensure high availability.
- Low Season: Offer competitive pricing, special promotions (e.g., extended stay discounts), and flexible cancellation policies. Target off-season travelers like remote workers or budget-conscious guests.
- Shoulder Seasons: Implement dynamic pricing that balances peak and low rates. Target weekend travelers or specific events. Offer slightly more flexible terms than peak season.
- Regularly analyze your own performance against these Onemana seasonality benchmarks and adjust your pricing and availability strategy accordingly.
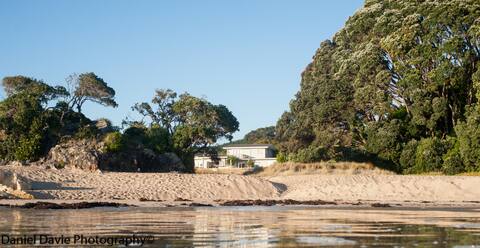
Best Areas for Airbnb Investment in Onemana (2026)
Exploring the top neighborhoods for short-term rentals in Onemana? This section highlights key areas, outlining why they are attractive for hosts and guests, along with notable local attractions. Consider these locations based on your target guest profile and investment strategy.
| Neighborhood / Area | Why Host Here? (Target Guests & Appeal) | Key Attractions & Landmarks |
|---|---|---|
| Onemana Beach | Stunning beach destination known for its relaxed atmosphere and beautiful scenery. A favorite among families and holidaymakers looking for a tranquil seaside retreat. | Onemana Beach, Onemana Scenic Lookout, Hot Water Beach, Whangamata Beach, Cathedral Cove |
| Whangamata | Popular coastal town known for its surf culture and vibrant community. A hotspot for both tourists and locals, offering a range of recreational activities. | Whangamata Beach, Estuary and Wetlands, Surf Club, Whangamata Harbour, Bush Walks |
| Mount Maunganui | Renowned for its scenic beach and mountain views. A favorite holiday destination that draws both international and domestic tourists year-round. | Mount Maunganui Beach, The Mount, Moturiki Island, Hot Pools, Tauranga Harbour |
| Coromandel Town | Charming small town known for its forestry and stunning coastal views. Attracts those interested in nature and outdoor adventures. | Coromandel Gold Rush Historic Centre, Driving Creek Railway, Kauri Block Trail, Wharf Beach |
| Pauanui | Trendy seaside resort popular for its beautiful beaches and golf. Ideal for families and golf enthusiasts looking for leisure getaways. | Pauanui Beach, Pauanui Pines Golf Club, Tairua River, Tairua Mountain |
| Tairua | Picturesque coastal town offering a laid-back vibe and stunning views. Popular among surfers and families seeking outdoor fun. | Tairua Beach, Paku Hill, Tairua Estuary, Mount Paku |
| Kaimai Mamaku Forest Park | Natural parkland offering an abundance of hiking trails and natural beauty. Appeals to nature lovers and adventure seekers. | Kaimai Range, Hiking Trails, Waterfalls, Native Forests |
| Thames | Historic town with a rich gold-mining history, known for its charming streets and local markets. Attracts visitors interested in cultural experiences. | Thames School of Mines, Goldmine Experience, Thames Coastal Walkway, Local Markets |
Understanding Airbnb License Requirements & STR Laws in Onemana (2026)
While Onemana, Waikato, New Zealand currently shows low STR regulations, specific Airbnb license requirements might still exist or change. Always verify the latest short term rental regulations and Airbnb license requirements directly with local government authorities for Onemana to ensure full compliance before hosting.
(Source: AirROI data, 2026, finding no licensed listings among those analyzed)
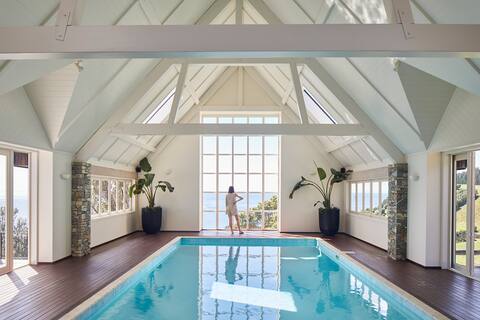
Top Performing Airbnb Properties in Onemana (2026)
Benchmark your potential! Explore examples of top-performing Airbnb properties in Onemanabased on Trailing Twelve Month (TTM) revenue. Analyze their characteristics, revenue, occupancy rate, and ADR to understand what drives success in this market.
Hillbrook Estate, Whangamata, New Zealand
Entire Place • 7 bedrooms
Absolute Ocean beachfront! Onemana Pararaiha...
Entire Place • 7 bedrooms

The Clever Little Bach.
Entire Place • 2 bedrooms

Bambury Bach, Onemana
Entire Place • 3 bedrooms
Long Lunch Chalet in Onemana
Entire Place • 3 bedrooms

Onemana Staycation!
Entire Place • 1 bedroom
Note: Performance varies based on location, size, amenities, seasonality, and management quality. Data reflects the past 12 months.
Top Performing Airbnb Hosts in Onemana (2026)
Learn from the best! This table showcases top-performing Airbnb hosts in Onemana based on the number of properties managed and estimated total revenue over the past year. Analyze their scale and performance metrics.
| Host Name | Properties | Grossing Revenue | Stay Reviews | Avg Rating |
|---|---|---|---|---|
| Bersantai | 1 | $118,773 | 9 | 5.00/5.0 |
| Renee | 1 | $97,819 | 88 | 4.98/5.0 |
| Julia | 1 | $27,466 | 26 | 4.96/5.0 |
| Anna | 1 | $26,851 | 38 | 4.95/5.0 |
| Bachcare | 7 | $19,731 | 21 | 4.40/5.0 |
| Christine | 2 | $17,933 | 130 | 4.85/5.0 |
| Angela | 1 | $16,933 | 9 | 4.67/5.0 |
| MyStays | 2 | $14,433 | 17 | 4.56/5.0 |
| Sarah | 1 | $13,321 | 47 | 4.87/5.0 |
| Felicity | 1 | $12,289 | 15 | 4.93/5.0 |
Analyzing the strategies of top hosts, such as their property selection, pricing, and guest communication, can offer valuable lessons for optimizing your own Airbnb operations in Onemana.
Dive Deeper: Advanced Onemana STR Market Data (2026)
Ready to unlock more insights? AirROI provides access to advanced metrics and comprehensive Airbnb data for Onemana. Explore detailed analytics beyond this report to refine your investment strategy, optimize pricing, and maximize your vacation rental profits.
Explore Advanced MetricsOnemana Short-Term Rental Market Composition (2026): Property & Room Types
Room Type Distribution
Property Type Distribution
Market Composition Insights for Onemana
- The Onemana Airbnb market composition is heavily skewed towards Entire Home/Apt listings, which make up 100% of the 26 active rentals. This indicates strong guest preference for privacy and space.
- Looking at the property type distribution in Onemana, House properties are the most common (69.2%), reflecting the local real estate landscape.
- Houses represent a significant 69.2% portion, catering likely to families or larger groups.
- The presence of 7.7% Hotel/Boutique listings indicates integration with traditional hospitality.
- Smaller segments like unique stays, apartment/condo (combined 7.6%) offer potential for unique stay experiences.
Onemana Airbnb Room Capacity Analysis (2026): Bedroom Distribution
Distribution of Listings by Number of Bedrooms
Room Capacity Insights for Onemana
- The dominant room capacity in Onemana is 2 bedrooms listings, making up 30.8% of the market. This suggests a strong demand for properties suitable for couples or solo travelers.
- Together, 2 bedrooms and 3 bedrooms properties represent 57.7% of the active Airbnb listings in Onemana, indicating a high concentration in these sizes.
- A significant 42.2% of listings offer 3+ bedrooms, catering to larger groups and families seeking more space in Onemana.
Onemana Vacation Rental Guest Capacity Trends (2026)
Distribution of Listings by Guest Capacity
Guest Capacity Insights for Onemana
- The most common guest capacity trend in Onemana vacation rentals is listings accommodating 6 guests (26.9%). This suggests the primary traveler segment is likely larger groups.
- Properties designed for 6 guests and 8+ guests dominate the Onemana STR market, accounting for 50.0% of listings.
- 50.0% of properties accommodate 6+ guests, serving the market segment for larger families or group travel in Onemana.
- On average, properties in Onemana are equipped to host 5.2 guests.
Onemana Airbnb Booking Patterns (2026): Available vs. Booked Days
Available Days Distribution
Booked Days Distribution
Booking Pattern Insights for Onemana
- The most common availability pattern in Onemana falls within the 271-366 days range, representing 73.1% of listings. This suggests many properties have significant open periods on their calendars.
- Approximately 96.2% of listings show high availability (181+ days open annually), indicating potential for increased bookings or specific owner usage patterns.
- For booked days, the 1-30 days range is most frequent in Onemana (38.5%), reflecting common guest stay durations or potential owner blocking patterns.
- A notable 3.8% of properties secure long booking periods (181+ days booked per year), highlighting successful long-term rental strategies or significant owner usage.
Onemana Airbnb Minimum Stay Requirements Analysis
Distribution of Listings by Minimum Night Requirement
1 Night
2 listings
7.7% of total
2 Nights
6 listings
23.1% of total
30+ Nights
18 listings
69.2% of total
Key Insights
- The most prevalent minimum stay requirement in Onemana is 30+ Nights, adopted by 69.2% of listings. This highlights the market's preference for longer commitments.
- A significant segment (69.2%) caters to monthly stays (30+ nights) in Onemana, pointing to opportunities in the extended-stay market.
Recommendations
- Align with the market by considering a 30+ Nights minimum stay, as 69.2% of Onemana hosts use this setting.
- If feasible, allowing 1-night stays, especially midweek or during low season, could capture last-minute bookings, as only 7.7% currently do.
- Explore offering discounts for stays of 30+ nights to attract the 69.2% of the market seeking extended stays.
- Adjust minimum nights based on seasonality – potentially shorter during low season and longer during peak demand periods in Onemana.
Onemana Airbnb Cancellation Policy Trends Analysis (2026)
Flexible
6 listings
24% of total
Moderate
5 listings
20% of total
Firm
14 listings
56% of total
Cancellation Policy Insights for Onemana
- The prevailing Airbnb cancellation policy trend in Onemana is Firm, used by 56% of listings.
- A majority (56.0%) of hosts in Onemana utilize Firm or Strict policies, indicating a market where hosts prioritize booking security.
Recommendations for Hosts
- Consider adopting a Firm policy to align with the 56% market standard in Onemana.
- Regularly review your cancellation policy against competitors and market demand shifts in Onemana.
Onemana STR Booking Lead Time Analysis (2026)
Average Booking Lead Time by Month
Booking Lead Time Insights for Onemana
- The overall average booking lead time for vacation rentals in Onemana is 61 days.
- Guests book furthest in advance for stays during January (average 108 days), likely coinciding with peak travel demand or local events.
- The shortest booking windows occur for stays in June (average 24 days), indicating more last-minute travel plans during this time.
- Seasonally, Winter (87 days avg.) sees the longest lead times, while Summer (31 days avg.) has the shortest, reflecting typical travel planning cycles.
Recommendations for Hosts
- Use the overall average lead time (61 days) as a baseline for your pricing and availability strategy in Onemana.
- For January stays, consider implementing length-of-stay discounts or slightly higher rates for bookings made less than 108 days out to capitalize on advance planning.
- Target marketing efforts for the Winter season well in advance (at least 87 days) to capture early planners.
- Monitor your own booking lead times against these Onemana averages to identify opportunities for dynamic pricing adjustments.
Popular & Essential Airbnb Amenities in Onemana (2026)
Amenity Prevalence
Amenity Insights for Onemana
- Popular amenities like Free parking on premises, TV, Microwave are common but not universal. Offering these can provide a competitive edge.
- Warning: Wifi is not universally provided but is considered essential globally. Ensure reliable Wifi is offered.
Recommendations for Hosts
- Consider adding popular differentiators like Free parking on premises or TV to increase appeal.
- Highlight unique or less common amenities you offer (e.g., hot tub, dedicated workspace, EV charger) in your listing description and photos.
- Regularly check competitor amenities in Onemana to stay competitive.
Onemana Airbnb Guest Demographics & Profile Analysis (2026)
Guest Profile Summary for Onemana
- The typical guest profile for Airbnb in Onemana consists of primarily domestic travelers (66%), often arriving from nearby Auckland, typically belonging to the Post-2000s (Gen Z/Alpha) group (50%), primarily speaking English or German.
- Domestic travelers account for 66.0% of guests.
- Key international markets include New Zealand (66%) and Australia (12.4%).
- Top languages spoken are English (70%) followed by German (10%).
- A significant demographic segment is the Post-2000s (Gen Z/Alpha) group, representing 50% of guests.
Recommendations for Hosts
- Target domestic marketing efforts towards travelers from Auckland and Wellington.
- Tailor amenities and listing descriptions to appeal to the dominant Post-2000s (Gen Z/Alpha) demographic (e.g., highlight fast WiFi, smart home features, local guides).
- Highlight unique local experiences or amenities relevant to the primary guest profile.
- Consider seasonal promotions aligned with peak travel times for key origin markets.
Nearby Short-Term Rental Market Comparison
How does the Onemana Airbnb market stack up against its neighbors? Compare key performance metrics like average monthly revenue, ADR, and occupancy rates in surrounding areas to understand the broader regional STR landscape.
| Market | Active Properties | Monthly Revenue | Daily Rate | Avg. Occupancy |
|---|---|---|---|---|
| Hot Water Beach | 27 | $2,949 | $257.55 | 50% |
| Tikitere | 15 | $2,599 | $238.84 | 48% |
| Hamurana | 28 | $2,555 | $170.74 | 50% |
| Lake Tarawera | 35 | $2,411 | $302.59 | 38% |
| Te Kūiti | 17 | $2,391 | $126.21 | 59% |
| Waiheke | 580 | $2,274 | $338.47 | 32% |
| Hahei | 104 | $2,241 | $260.25 | 39% |
| Ngongotahā | 79 | $2,152 | $194.15 | 44% |
| Okere Falls | 32 | $2,118 | $246.61 | 37% |
| Rotorua | 689 | $2,021 | $160.41 | 47% |