Hamilton Airbnb Market Analysis 2026: Short Term Rental Data & Vacation Rental Statistics in Waikato, New Zealand
Is Airbnb profitable in Hamilton in 2026? Explore comprehensive Airbnb analytics for Hamilton, Waikato, New Zealand to uncover income potential. This 2026 STR market report for Hamilton, based on AirROI data from February 2025 to January 2026, reveals key trends in the market of 539 active listings.
Whether you're considering an Airbnb investment in Hamilton, optimizing your existing vacation rental, or exploring rental arbitrage opportunities, understanding the Hamilton Airbnb data is crucial. Leveraging the low regulation environment is key to maximizing your short term rental income potential. Let's dive into the specifics.
Key Hamilton Airbnb Performance Metrics Overview
Monthly Airbnb Revenue Variations & Income Potential in Hamilton (2026)
Understanding the monthly revenue variations for Airbnb listings in Hamilton is key to maximizing your short term rental income potential. Seasonality significantly impacts earnings. Our analysis, based on data from the past 12 months, shows that the peak revenue month for STRs in Hamilton is typically December, while May often presents the lowest earnings, highlighting opportunities for strategic pricing adjustments during shoulder and low seasons. Explore the typical Airbnb income in Hamilton across different performance tiers:
- Best-in-class properties (Top 10%) achieve $3,655+ monthly, often utilizing dynamic pricing and superior guest experiences.
- Strong performing properties (Top 25%) earn $2,519 or more, indicating effective management and desirable locations/amenities.
- Typical properties (Median) generate around $1,378 per month, representing the average market performance.
- Entry-level properties (Bottom 25%) see earnings around $625, often with potential for optimization.
Average Monthly Airbnb Earnings Trend in Hamilton
Hamilton Airbnb Occupancy Rate Trends (2026)
Maximize your bookings by understanding the Hamilton STR occupancy trends. Seasonal demand shifts significantly influence how often properties are booked. Typically, Februarysees the highest demand (peak season occupancy), while May experiences the lowest (low season). Effective strategies, like adjusting minimum stays or offering promotions, can boost occupancy during slower periods. Here's how different property tiers perform in Hamilton:
- Best-in-class properties (Top 10%) achieve 81%+ occupancy, indicating high desirability and potentially optimized availability.
- Strong performing properties (Top 25%) maintain 68% or higher occupancy, suggesting good market fit and guest satisfaction.
- Typical properties (Median) have an occupancy rate around 46%.
- Entry-level properties (Bottom 25%) average 25% occupancy, potentially facing higher vacancy.
Average Monthly Occupancy Rate Trend in Hamilton
Average Daily Rate (ADR) Airbnb Trends in Hamilton (2026)
Effective short term rental pricing strategy in Hamilton involves understanding monthly ADR fluctuations. The Average Daily Rate (ADR) for Airbnb in Hamilton typically peaks in June and dips lowest during April. Leveraging Airbnb dynamic pricing tools or strategies based on this seasonality can significantly boost revenue. Here's a look at the typical nightly rates achieved:
- Best-in-class properties (Top 10%) command rates of $202+ per night, often due to premium features or locations.
- Strong performing properties (Top 25%) achieve nightly rates of $150 or more.
- Typical properties (Median) charge around $104 per night.
- Entry-level properties (Bottom 25%) earn around $60 per night.
Average Daily Rate (ADR) Trend by Month in Hamilton
Get Live Hamilton Market Intelligence 👇

Explore Real-time Analytics
Airbnb Seasonality Analysis & Trends in Hamilton (2026)
Peak Season (December, October, January)
- Revenue averages $1,897 per month
- Occupancy rates average 46.4%
- Daily rates average $120
Shoulder Season
- Revenue averages $1,767 per month
- Occupancy maintains around 46.3%
- Daily rates hold near $118
Low Season (February, April, May)
- Revenue drops to average $1,534 per month
- Occupancy decreases to average 46.1%
- Daily rates adjust to average $113
Seasonality Insights for Hamilton
- The Airbnb seasonality in Hamilton shows moderate seasonality with distinct peak and low periods. While the sections above show seasonal averages, it's also insightful to look at the extremes:
- During the high season, the absolute peak month showcases Hamilton's highest earning potential, with monthly revenues capable of climbing to $1,950, occupancy reaching a high of 52.6%, and ADRs peaking at $124.
- Conversely, the slowest single month of the year, typically falling within the low season, marks the market's lowest point. In this month, revenue might dip to $1,365, occupancy could drop to 37.3%, and ADRs may adjust down to $111.
- Understanding both the seasonal averages and these monthly peaks and troughs in revenue, occupancy, and ADR is crucial for maximizing your Airbnb profit potential in Hamilton.
Seasonal Strategies for Maximizing Profit
- Peak Season: Maximize revenue through premium pricing and potentially longer minimum stays. Ensure high availability.
- Low Season: Offer competitive pricing, special promotions (e.g., extended stay discounts), and flexible cancellation policies. Target off-season travelers like remote workers or budget-conscious guests.
- Shoulder Seasons: Implement dynamic pricing that balances peak and low rates. Target weekend travelers or specific events. Offer slightly more flexible terms than peak season.
- Regularly analyze your own performance against these Hamilton seasonality benchmarks and adjust your pricing and availability strategy accordingly.
Best Areas for Airbnb Investment in Hamilton (2026)
Exploring the top neighborhoods for short-term rentals in Hamilton? This section highlights key areas, outlining why they are attractive for hosts and guests, along with notable local attractions. Consider these locations based on your target guest profile and investment strategy.
| Neighborhood / Area | Why Host Here? (Target Guests & Appeal) | Key Attractions & Landmarks |
|---|---|---|
| Hamilton City Centre | The bustling heart of Hamilton, offering shopping, dining, and cultural experiences. Ideal for travelers seeking convenience and access to local attractions. | Hamilton Gardens, SkyCity Hamilton, Waikato Museum, Te Awa River Ride, Hamilton Zoo |
| Claudelands | A vibrant suburb known for its parks and proximity to entertainment venues. Great for families and tourists enjoying local events and outdoor activities. | Claudelands Park, Claudelands Arena, Hamilton Farmers' Market, Victoria on the River, Hamilton Gardens |
| Rototuna | A growing suburb with family-friendly amenities and parks, making it attractive to visitors who prefer a quiet living environment close to the city. | Rototuna Shopping Centre, Dinsdale Park, Cotswold Park, Te Awa River, McDonald’s Playland |
| Hillcrest | Home to the University of Waikato, attracting students and academics. Offers a mix of residences and a youthful atmosphere. | University of Waikato, Hillcrest Shopping Centre, Balmoral Drive Park, Ross McEwan Park, Hukanui Park |
| Frankton | An up-and-coming area with a mix of commercial and residential development. Close to the airport and major transport routes. | Frankton Railway Station, Frankton Village, Lake Rotoroa, Waikato River Trail, Tamahere Domain |
| Kawhia | A coastal town on the outskirts of Hamilton, known for its hot springs and beautiful beaches. Offers a unique getaway for relaxation and outdoor activities. | Kawhia Hot Springs, Kawhia Beach, Aotea Harbour, Te Maika Beach, Oparau River |
| Te Rapa | An industrial area with access to major highways. Attractive for business travelers and those visiting local industry. | Te Rapa Racecourse, The Base Shopping Centre, Waikato Innovations Park, Te Rapa Gateway, Hamilton Greyhounds |
| Whatawhata | A peaceful rural area just outside Hamilton, perfect for those seeking a country escape. Popular for its natural beauty and local markets. | Whatawhata Village, Raglan Road, Gully Farm, Mount Pirongia, Whatawhata Farmers' Market |
Understanding Airbnb License Requirements & STR Laws in Hamilton (2026)
While Hamilton, Waikato, New Zealand currently shows low STR regulations, specific Airbnb license requirements might still exist or change. Always verify the latest short term rental regulations and Airbnb license requirements directly with local government authorities for Hamilton to ensure full compliance before hosting.
(Source: AirROI data, 2026, finding no licensed listings among those analyzed)
Top Performing Airbnb Properties in Hamilton (2026)
Benchmark your potential! Explore examples of top-performing Airbnb properties in Hamiltonbased on Trailing Twelve Month (TTM) revenue. Analyze their characteristics, revenue, occupancy rate, and ADR to understand what drives success in this market.

Large Home great for Families, Work, Groups, Teams
Entire Place • 5 bedrooms

5 Bedroom House , Sleeps 13+ close to Uni/Sports
Entire Place • 5 bedrooms

Smart Duplex
Entire Place • 6 bedrooms
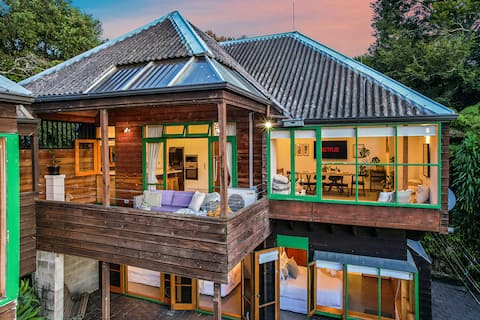
TreeTop Retreat, Central City & Views! -By KOSH
Entire Place • 3 bedrooms
Luxury Home, Central, Golf & Cafés -By KOSH
Entire Place • 3 bedrooms

Character! Central with Air-conditioning -By KOSH
Entire Place • 3 bedrooms
Note: Performance varies based on location, size, amenities, seasonality, and management quality. Data reflects the past 12 months.
Top Performing Airbnb Hosts in Hamilton (2026)
Learn from the best! This table showcases top-performing Airbnb hosts in Hamilton based on the number of properties managed and estimated total revenue over the past year. Analyze their scale and performance metrics.
| Host Name | Properties | Grossing Revenue | Stay Reviews | Avg Rating |
|---|---|---|---|---|
| Levi | 32 | $1,257,439 | 3393 | 4.92/5.0 |
| Shelley | 14 | $331,747 | 1737 | 4.70/5.0 |
| Henry | 8 | $291,308 | 325 | 4.80/5.0 |
| Binyan | 6 | $210,057 | 506 | 4.81/5.0 |
| Danelle | 6 | $194,642 | 489 | 4.89/5.0 |
| Anita | 7 | $162,479 | 150 | 4.90/5.0 |
| Paul | 6 | $128,949 | 330 | 4.79/5.0 |
| Sam | 1 | $115,249 | 40 | 4.98/5.0 |
| Vindya | 7 | $107,335 | 1708 | 4.70/5.0 |
| Nina | 4 | $102,848 | 67 | 4.93/5.0 |
Analyzing the strategies of top hosts, such as their property selection, pricing, and guest communication, can offer valuable lessons for optimizing your own Airbnb operations in Hamilton.
Dive Deeper: Advanced Hamilton STR Market Data (2026)
Ready to unlock more insights? AirROI provides access to advanced metrics and comprehensive Airbnb data for Hamilton. Explore detailed analytics beyond this report to refine your investment strategy, optimize pricing, and maximize your vacation rental profits.
Explore Advanced MetricsHamilton Short-Term Rental Market Composition (2026): Property & Room Types
Room Type Distribution
Property Type Distribution
Market Composition Insights for Hamilton
- The Hamilton Airbnb market composition is heavily skewed towards Entire Home/Apt listings, which make up 76.4% of the 539 active rentals. This indicates strong guest preference for privacy and space.
- Looking at the property type distribution in Hamilton, House properties are the most common (63.5%), reflecting the local real estate landscape.
- Houses represent a significant 63.5% portion, catering likely to families or larger groups.
- The presence of 9.6% Hotel/Boutique listings indicates integration with traditional hospitality.
- Smaller segments like outdoor/unique (combined 0.7%) offer potential for unique stay experiences.
Hamilton Airbnb Room Capacity Analysis (2026): Bedroom Distribution
Distribution of Listings by Number of Bedrooms
Room Capacity Insights for Hamilton
- The dominant room capacity in Hamilton is 2 bedrooms listings, making up 23.2% of the market. This suggests a strong demand for properties suitable for couples or solo travelers.
- Together, 2 bedrooms and 3 bedrooms properties represent 45.1% of the active Airbnb listings in Hamilton, indicating a high concentration in these sizes.
- A significant 37.5% of listings offer 3+ bedrooms, catering to larger groups and families seeking more space in Hamilton.
Hamilton Vacation Rental Guest Capacity Trends (2026)
Distribution of Listings by Guest Capacity
Guest Capacity Insights for Hamilton
- The most common guest capacity trend in Hamilton vacation rentals is listings accommodating 4 guests (20.2%). This suggests the primary traveler segment is likely small families or groups.
- Properties designed for 4 guests and 6 guests dominate the Hamilton STR market, accounting for 38.4% of listings.
- 35.6% of properties accommodate 6+ guests, serving the market segment for larger families or group travel in Hamilton.
- On average, properties in Hamilton are equipped to host 3.9 guests.
Hamilton Airbnb Booking Patterns (2026): Available vs. Booked Days
Available Days Distribution
Booked Days Distribution
Booking Pattern Insights for Hamilton
- The most common availability pattern in Hamilton falls within the 271-366 days range, representing 37.5% of listings. This suggests many properties have significant open periods on their calendars.
- Approximately 70.0% of listings show high availability (181+ days open annually), indicating potential for increased bookings or specific owner usage patterns.
- For booked days, the 91-180 days range is most frequent in Hamilton (32.3%), reflecting common guest stay durations or potential owner blocking patterns.
- A notable 30.8% of properties secure long booking periods (181+ days booked per year), highlighting successful long-term rental strategies or significant owner usage.
Hamilton Airbnb Minimum Stay Requirements Analysis
Distribution of Listings by Minimum Night Requirement
1 Night
323 listings
59.9% of total
2 Nights
84 listings
15.6% of total
3 Nights
11 listings
2% of total
4-6 Nights
9 listings
1.7% of total
7-29 Nights
5 listings
0.9% of total
30+ Nights
107 listings
19.9% of total
Key Insights
- The most prevalent minimum stay requirement in Hamilton is 1 Night, adopted by 59.9% of listings. This highlights the market's preference for shorter, flexible bookings.
- A strong majority (75.5%) of the Hamilton Airbnb data shows acceptance of very short stays (1-2 nights), indicating a dynamic, high-turnover market.
- A significant segment (19.9%) caters to monthly stays (30+ nights) in Hamilton, pointing to opportunities in the extended-stay market.
Recommendations
- Align with the market by considering a 1 Night minimum stay, as 59.9% of Hamilton hosts use this setting.
- Explore offering discounts for stays of 30+ nights to attract the 19.9% of the market seeking extended stays.
- Adjust minimum nights based on seasonality – potentially shorter during low season and longer during peak demand periods in Hamilton.
Hamilton Airbnb Cancellation Policy Trends Analysis (2026)
Limited
3 listings
0.6% of total
Flexible
199 listings
37% of total
Moderate
248 listings
46.1% of total
Firm
66 listings
12.3% of total
Strict
22 listings
4.1% of total
Cancellation Policy Insights for Hamilton
- The prevailing Airbnb cancellation policy trend in Hamilton is Moderate, used by 46.1% of listings.
- The market strongly favors guest-friendly terms, with 83.1% of listings offering Flexible or Moderate policies. This suggests guests in Hamilton may expect booking flexibility.
- Strict cancellation policies are quite rare (4.1%), potentially making listings with this policy less competitive unless justified by high demand or property type.
Recommendations for Hosts
- Consider adopting a Moderate policy to align with the 46.1% market standard in Hamilton.
- Using a Strict policy might deter some guests, as only 4.1% of listings use it. Evaluate if potential revenue protection outweighs possible lower booking rates.
- Regularly review your cancellation policy against competitors and market demand shifts in Hamilton.
Hamilton STR Booking Lead Time Analysis (2026)
Average Booking Lead Time by Month
Booking Lead Time Insights for Hamilton
- The overall average booking lead time for vacation rentals in Hamilton is 38 days.
- Guests book furthest in advance for stays during October (average 48 days), likely coinciding with peak travel demand or local events.
- The shortest booking windows occur for stays in May (average 27 days), indicating more last-minute travel plans during this time.
- Seasonally, Fall (43 days avg.) sees the longest lead times, while Spring (34 days avg.) has the shortest, reflecting typical travel planning cycles.
Recommendations for Hosts
- Use the overall average lead time (38 days) as a baseline for your pricing and availability strategy in Hamilton.
- Target marketing efforts for the Fall season well in advance (at least 43 days) to capture early planners.
- Monitor your own booking lead times against these Hamilton averages to identify opportunities for dynamic pricing adjustments.
Popular & Essential Airbnb Amenities in Hamilton (2026)
Amenity Prevalence
Amenity Insights for Hamilton
- Essential amenities in Hamilton that guests expect include: Wifi, Smoke alarm. Lacking these (any) could significantly impact bookings.
- Popular amenities like Free parking on premises, TV, Hot water are common but not universal. Offering these can provide a competitive edge.
Recommendations for Hosts
- Ensure your listing includes all essential amenities for Hamilton: Wifi, Smoke alarm.
- Prioritize adding missing essentials: Wifi, Smoke alarm.
- Consider adding popular differentiators like Free parking on premises or TV to increase appeal.
- Highlight unique or less common amenities you offer (e.g., hot tub, dedicated workspace, EV charger) in your listing description and photos.
- Regularly check competitor amenities in Hamilton to stay competitive.
Hamilton Airbnb Guest Demographics & Profile Analysis (2026)
Guest Profile Summary for Hamilton
- The typical guest profile for Airbnb in Hamilton consists of primarily domestic travelers (67%), often arriving from nearby Auckland, typically belonging to the Post-2000s (Gen Z/Alpha) group (50%), primarily speaking English or Chinese.
- Domestic travelers account for 66.5% of guests.
- Key international markets include New Zealand (66.5%) and Australia (12.1%).
- Top languages spoken are English (70.8%) followed by Chinese (6%).
- A significant demographic segment is the Post-2000s (Gen Z/Alpha) group, representing 50% of guests.
Recommendations for Hosts
- Target domestic marketing efforts towards travelers from Auckland and Wellington.
- Tailor amenities and listing descriptions to appeal to the dominant Post-2000s (Gen Z/Alpha) demographic (e.g., highlight fast WiFi, smart home features, local guides).
- Highlight unique local experiences or amenities relevant to the primary guest profile.
- Consider seasonal promotions aligned with peak travel times for key origin markets.
Nearby Short-Term Rental Market Comparison
How does the Hamilton Airbnb market stack up against its neighbors? Compare key performance metrics like average monthly revenue, ADR, and occupancy rates in surrounding areas to understand the broader regional STR landscape.
| Market | Active Properties | Monthly Revenue | Daily Rate | Avg. Occupancy |
|---|---|---|---|---|
| Hot Water Beach | 27 | $2,949 | $257.55 | 50% |
| Tikitere | 15 | $2,599 | $238.84 | 48% |
| Hamurana | 28 | $2,555 | $170.74 | 50% |
| Lake Tarawera | 35 | $2,411 | $302.59 | 38% |
| Te Kūiti | 17 | $2,391 | $126.21 | 59% |
| Waiheke | 580 | $2,274 | $338.47 | 32% |
| Hahei | 104 | $2,241 | $260.25 | 39% |
| Ngongotahā | 79 | $2,152 | $194.15 | 44% |
| Okere Falls | 32 | $2,118 | $246.61 | 37% |
| Rotorua | 689 | $2,021 | $160.41 | 47% |