Fiordland Community Airbnb Market Analysis 2026: Short Term Rental Data & Vacation Rental Statistics in Southland, New Zealand
Is Airbnb profitable in Fiordland Community in 2026? Explore comprehensive Airbnb analytics for Fiordland Community, Southland, New Zealand to uncover income potential. This 2026 STR market report for Fiordland Community, based on AirROI data from February 2025 to January 2026, reveals key trends in the market of 379 active listings.
Whether you're considering an Airbnb investment in Fiordland Community, optimizing your existing vacation rental, or exploring rental arbitrage opportunities, understanding the Fiordland Community Airbnb data is crucial. Leveraging the low regulation environment is key to maximizing your short term rental income potential. Let's dive into the specifics.
Key Fiordland Community Airbnb Performance Metrics Overview
Monthly Airbnb Revenue Variations & Income Potential in Fiordland Community (2026)
Understanding the monthly revenue variations for Airbnb listings in Fiordland Community is key to maximizing your short term rental income potential. Seasonality significantly impacts earnings. Our analysis, based on data from the past 12 months, shows that the peak revenue month for STRs in Fiordland Community is typically December, while June often presents the lowest earnings, highlighting opportunities for strategic pricing adjustments during shoulder and low seasons. Explore the typical Airbnb income in Fiordland Community across different performance tiers:
- Best-in-class properties (Top 10%) achieve $4,985+ monthly, often utilizing dynamic pricing and superior guest experiences.
- Strong performing properties (Top 25%) earn $3,646 or more, indicating effective management and desirable locations/amenities.
- Typical properties (Median) generate around $2,448 per month, representing the average market performance.
- Entry-level properties (Bottom 25%) see earnings around $1,446, often with potential for optimization.
Average Monthly Airbnb Earnings Trend in Fiordland Community
Fiordland Community Airbnb Occupancy Rate Trends (2026)
Maximize your bookings by understanding the Fiordland Community STR occupancy trends. Seasonal demand shifts significantly influence how often properties are booked. Typically, Februarysees the highest demand (peak season occupancy), while June experiences the lowest (low season). Effective strategies, like adjusting minimum stays or offering promotions, can boost occupancy during slower periods. Here's how different property tiers perform in Fiordland Community:
- Best-in-class properties (Top 10%) achieve 87%+ occupancy, indicating high desirability and potentially optimized availability.
- Strong performing properties (Top 25%) maintain 75% or higher occupancy, suggesting good market fit and guest satisfaction.
- Typical properties (Median) have an occupancy rate around 58%.
- Entry-level properties (Bottom 25%) average 34% occupancy, potentially facing higher vacancy.
Average Monthly Occupancy Rate Trend in Fiordland Community
Average Daily Rate (ADR) Airbnb Trends in Fiordland Community (2026)
Effective short term rental pricing strategy in Fiordland Community involves understanding monthly ADR fluctuations. The Average Daily Rate (ADR) for Airbnb in Fiordland Community typically peaks in January and dips lowest during May. Leveraging Airbnb dynamic pricing tools or strategies based on this seasonality can significantly boost revenue. Here's a look at the typical nightly rates achieved:
- Best-in-class properties (Top 10%) command rates of $288+ per night, often due to premium features or locations.
- Strong performing properties (Top 25%) achieve nightly rates of $203 or more.
- Typical properties (Median) charge around $147 per night.
- Entry-level properties (Bottom 25%) earn around $110 per night.
Average Daily Rate (ADR) Trend by Month in Fiordland Community
Get Live Fiordland Community Market Intelligence 👇

Explore Real-time Analytics
Airbnb Seasonality Analysis & Trends in Fiordland Community (2026)
Peak Season (December, February, March)
- Revenue averages $3,922 per month
- Occupancy rates average 74.7%
- Daily rates average $177
Shoulder Season
- Revenue averages $2,697 per month
- Occupancy maintains around 52.7%
- Daily rates hold near $171
Low Season (June, August, September)
- Revenue drops to average $1,880 per month
- Occupancy decreases to average 37.2%
- Daily rates adjust to average $163
Seasonality Insights for Fiordland Community
- The Airbnb seasonality in Fiordland Community shows highly seasonal trends requiring careful strategy. While the sections above show seasonal averages, it's also insightful to look at the extremes:
- During the high season, the absolute peak month showcases Fiordland Community's highest earning potential, with monthly revenues capable of climbing to $4,167, occupancy reaching a high of 78.8%, and ADRs peaking at $191.
- Conversely, the slowest single month of the year, typically falling within the low season, marks the market's lowest point. In this month, revenue might dip to $1,788, occupancy could drop to 35.0%, and ADRs may adjust down to $158.
- Understanding both the seasonal averages and these monthly peaks and troughs in revenue, occupancy, and ADR is crucial for maximizing your Airbnb profit potential in Fiordland Community.
Seasonal Strategies for Maximizing Profit
- Peak Season: Maximize revenue through premium pricing and potentially longer minimum stays. Ensure high availability.
- Low Season: Offer competitive pricing, special promotions (e.g., extended stay discounts), and flexible cancellation policies. Target off-season travelers like remote workers or budget-conscious guests.
- Shoulder Seasons: Implement dynamic pricing that balances peak and low rates. Target weekend travelers or specific events. Offer slightly more flexible terms than peak season.
- Regularly analyze your own performance against these Fiordland Community seasonality benchmarks and adjust your pricing and availability strategy accordingly.
Best Areas for Airbnb Investment in Fiordland Community (2026)
Exploring the top neighborhoods for short-term rentals in Fiordland Community? This section highlights key areas, outlining why they are attractive for hosts and guests, along with notable local attractions. Consider these locations based on your target guest profile and investment strategy.
| Neighborhood / Area | Why Host Here? (Target Guests & Appeal) | Key Attractions & Landmarks |
|---|---|---|
| Te Anau | As the largest town in Fiordland, Te Anau is the gateway to Fiordland National Park and hosts many tourists looking to explore Milford Sound and the surrounding wilderness. | Milford Sound, Te Anau Glowworm Caves, Fiordland National Park, Lake Te Anau, Kepler Track, Te Anau Bird Sanctuary |
| Milford Sound | One of New Zealand's most famous destinations, known for its stunning scenery and natural beauty. Ideal for tourism-related stays and experiences. | Milford Sound Cruises, Stirling Falls, Mitre Peak, Milford Track, Kayaking in the sound, Scenic flights |
| Manapouri | A picturesque village located near Lake Manapouri, offering access to Doubtful Sound and beautiful outdoor activities, perfect for nature lovers and adventure seekers. | Doubtful Sound, Lake Manapouri, Kepler Mountains, Walking trails, Fishing spots, Water sports |
| Te Anau Downs | A quieter area with stunning views and close proximity to Fiordland National Park. Attractive for visitors seeking a peaceful stay while being near major attractions. | Routeburn Track, Scenic views of the Fiordland, Access to hiking trails, Horse riding, Fishing in local rivers |
| Lake Monowai | A tranquil area favored by those looking for peace and outdoor activities such as hiking, fishing, and kayaking, appealing to visitors wanting to escape the hustle and bustle. | Lake Monowai, Monowai Conservation Area, Hiking trails, Fishing spots, Kayaking opportunities |
| Hollyford | Known for the Hollyford Track and its breathtaking landscapes. Attracts adventurers and nature enthusiasts eager to explore the rugged beauty of Fiordland. | Hollyford Track, Hollyford River, Beautiful landscapes, Tramping trails, Wildlife spotting |
| Makarora | A small community that acts as a gateway to the Mount Aspiring National Park, popular among hikers and outdoor enthusiasts looking for an adventurous stay. | Mount Aspiring National Park, Blue Pools Track, Hiking trails, Scenic drives, Trout fishing |
| Lumsden | A charming small town providing access to Fiordland while offering a more rural experience. Ideal for visitors looking for a local feel and community atmosphere. | Local parks, Historic railway workshops, Nearby fishing spots, Outdoor activities, Cultural events |
Understanding Airbnb License Requirements & STR Laws in Fiordland Community (2026)
While Fiordland Community, Southland, New Zealand currently shows low STR regulations, specific Airbnb license requirements might still exist or change. Always verify the latest short term rental regulations and Airbnb license requirements directly with local government authorities for Fiordland Community to ensure full compliance before hosting.
(Source: AirROI data, 2026, finding no licensed listings among those analyzed)
Top Performing Airbnb Properties in Fiordland Community (2026)
Benchmark your potential! Explore examples of top-performing Airbnb properties in Fiordland Communitybased on Trailing Twelve Month (TTM) revenue. Analyze their characteristics, revenue, occupancy rate, and ADR to understand what drives success in this market.
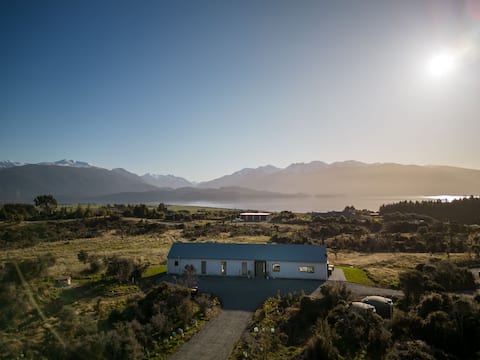
New Te Anau Holiday Home- Views, Spa & Space
Entire Place • 3 bedrooms

Rangapu Fiordland Lodge
Entire Place • 3 bedrooms
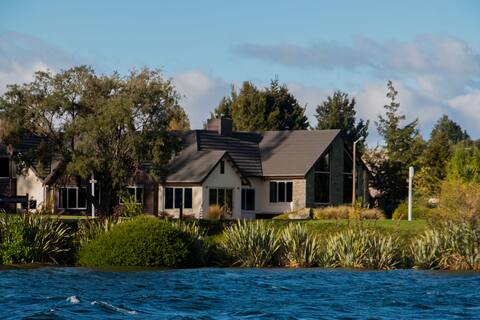
A Lake Front Retreat
Entire Place • 4 bedrooms
Lake House - Te Anau Holiday Home
Entire Place • 5 bedrooms

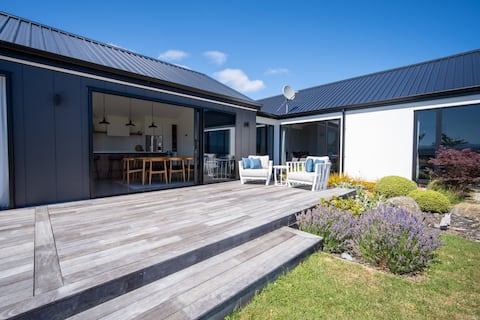
Kahikatea House
Entire Place • 2 bedrooms
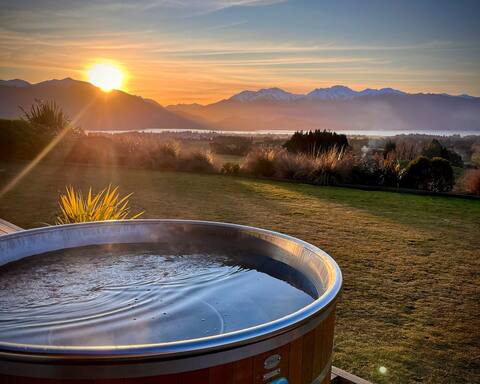
Fiordland Eco-Retreat ☆ Panoramic Views ☆ Hot Tub
Entire Place • 3 bedrooms
Note: Performance varies based on location, size, amenities, seasonality, and management quality. Data reflects the past 12 months.
Top Performing Airbnb Hosts in Fiordland Community (2026)
Learn from the best! This table showcases top-performing Airbnb hosts in Fiordland Community based on the number of properties managed and estimated total revenue over the past year. Analyze their scale and performance metrics.
| Host Name | Properties | Grossing Revenue | Stay Reviews | Avg Rating |
|---|---|---|---|---|
| Brendan | 8 | $412,021 | 2254 | 4.77/5.0 |
| Bachcare | 18 | $273,425 | 433 | 4.66/5.0 |
| Bamboo | 7 | $177,301 | 954 | 4.69/5.0 |
| Hanping | 23 | $173,893 | 517 | 4.46/5.0 |
| Tracey | 2 | $169,043 | 168 | 5.00/5.0 |
| Kerri | 5 | $151,475 | 24 | 4.96/5.0 |
| Lake | 5 | $141,085 | 2281 | 4.77/5.0 |
| Jodie | 1 | $119,625 | 296 | 4.98/5.0 |
| Jaclyn | 8 | $116,831 | 967 | 4.69/5.0 |
| Doug And Sharyn | 1 | $113,724 | 155 | 4.99/5.0 |
Analyzing the strategies of top hosts, such as their property selection, pricing, and guest communication, can offer valuable lessons for optimizing your own Airbnb operations in Fiordland Community.
Dive Deeper: Advanced Fiordland Community STR Market Data (2026)
Ready to unlock more insights? AirROI provides access to advanced metrics and comprehensive Airbnb data for Fiordland Community. Explore detailed analytics beyond this report to refine your investment strategy, optimize pricing, and maximize your vacation rental profits.
Explore Advanced MetricsFiordland Community Short-Term Rental Market Composition (2026): Property & Room Types
Room Type Distribution
Property Type Distribution
Market Composition Insights for Fiordland Community
- The Fiordland Community Airbnb market composition is heavily skewed towards Entire Home/Apt listings, which make up 79.2% of the 379 active rentals. This indicates strong guest preference for privacy and space.
- Looking at the property type distribution in Fiordland Community, House properties are the most common (60.4%), reflecting the local real estate landscape.
- Houses represent a significant 60.4% portion, catering likely to families or larger groups.
- The presence of 15.8% Hotel/Boutique listings indicates integration with traditional hospitality.
Fiordland Community Airbnb Room Capacity Analysis (2026): Bedroom Distribution
Distribution of Listings by Number of Bedrooms
Room Capacity Insights for Fiordland Community
- The dominant room capacity in Fiordland Community is 1 bedroom listings, making up 30.6% of the market. This suggests a strong demand for properties suitable for couples or solo travelers.
- Together, 1 bedroom and 3 bedrooms properties represent 59.9% of the active Airbnb listings in Fiordland Community, indicating a high concentration in these sizes.
- A significant 39.6% of listings offer 3+ bedrooms, catering to larger groups and families seeking more space in Fiordland Community.
Fiordland Community Vacation Rental Guest Capacity Trends (2026)
Distribution of Listings by Guest Capacity
Guest Capacity Insights for Fiordland Community
- The most common guest capacity trend in Fiordland Community vacation rentals is listings accommodating 2 guests (23%). This suggests the primary traveler segment is likely couples or solo travelers.
- Properties designed for 2 guests and 6 guests dominate the Fiordland Community STR market, accounting for 42.3% of listings.
- 32.5% of properties accommodate 6+ guests, serving the market segment for larger families or group travel in Fiordland Community.
- On average, properties in Fiordland Community are equipped to host 4.1 guests.
Fiordland Community Airbnb Booking Patterns (2026): Available vs. Booked Days
Available Days Distribution
Booked Days Distribution
Booking Pattern Insights for Fiordland Community
- The most common availability pattern in Fiordland Community falls within the 91-180 days range, representing 37.5% of listings. This suggests many properties have significant open periods on their calendars.
- Approximately 52.0% of listings show high availability (181+ days open annually), indicating potential for increased bookings or specific owner usage patterns.
- For booked days, the 181-270 days range is most frequent in Fiordland Community (36.1%), reflecting common guest stay durations or potential owner blocking patterns.
- A notable 49.0% of properties secure long booking periods (181+ days booked per year), highlighting successful long-term rental strategies or significant owner usage.
Fiordland Community Airbnb Minimum Stay Requirements Analysis
Distribution of Listings by Minimum Night Requirement
1 Night
116 listings
30.6% of total
2 Nights
80 listings
21.1% of total
3 Nights
2 listings
0.5% of total
4-6 Nights
4 listings
1.1% of total
30+ Nights
177 listings
46.7% of total
Key Insights
- The most prevalent minimum stay requirement in Fiordland Community is 30+ Nights, adopted by 46.7% of listings. This highlights the market's preference for longer commitments.
- A significant segment (46.7%) caters to monthly stays (30+ nights) in Fiordland Community, pointing to opportunities in the extended-stay market.
Recommendations
- Align with the market by considering a 30+ Nights minimum stay, as 46.7% of Fiordland Community hosts use this setting.
- Explore offering discounts for stays of 30+ nights to attract the 46.7% of the market seeking extended stays.
- Adjust minimum nights based on seasonality – potentially shorter during low season and longer during peak demand periods in Fiordland Community.
Fiordland Community Airbnb Cancellation Policy Trends Analysis (2026)
Limited
9 listings
2.4% of total
Super Strict 30 Days
5 listings
1.3% of total
Flexible
91 listings
24% of total
Moderate
165 listings
43.5% of total
Firm
94 listings
24.8% of total
Strict
15 listings
4% of total
Cancellation Policy Insights for Fiordland Community
- The prevailing Airbnb cancellation policy trend in Fiordland Community is Moderate, used by 43.5% of listings.
- There's a relatively balanced mix between guest-friendly (67.5%) and stricter (28.8%) policies, offering choices for different guest needs.
- Strict cancellation policies are quite rare (4%), potentially making listings with this policy less competitive unless justified by high demand or property type.
Recommendations for Hosts
- Consider adopting a Moderate policy to align with the 43.5% market standard in Fiordland Community.
- Using a Strict policy might deter some guests, as only 4% of listings use it. Evaluate if potential revenue protection outweighs possible lower booking rates.
- Regularly review your cancellation policy against competitors and market demand shifts in Fiordland Community.
Fiordland Community STR Booking Lead Time Analysis (2026)
Average Booking Lead Time by Month
Booking Lead Time Insights for Fiordland Community
- The overall average booking lead time for vacation rentals in Fiordland Community is 80 days.
- Guests book furthest in advance for stays during December (average 114 days), likely coinciding with peak travel demand or local events.
- The shortest booking windows occur for stays in June (average 49 days), indicating more last-minute travel plans during this time.
- Seasonally, Winter (102 days avg.) sees the longest lead times, while Summer (57 days avg.) has the shortest, reflecting typical travel planning cycles.
Recommendations for Hosts
- Use the overall average lead time (80 days) as a baseline for your pricing and availability strategy in Fiordland Community.
- For December stays, consider implementing length-of-stay discounts or slightly higher rates for bookings made less than 114 days out to capitalize on advance planning.
- Target marketing efforts for the Winter season well in advance (at least 102 days) to capture early planners.
- Monitor your own booking lead times against these Fiordland Community averages to identify opportunities for dynamic pricing adjustments.
Popular & Essential Airbnb Amenities in Fiordland Community (2026)
Amenity Prevalence
Amenity Insights for Fiordland Community
- Essential amenities in Fiordland Community that guests expect include: Smoke alarm, Free parking on premises. Lacking these (any) could significantly impact bookings.
- Popular amenities like Heating, Wifi, Hot water are common but not universal. Offering these can provide a competitive edge.
- Warning: Wifi is not universally provided but is considered essential globally. Ensure reliable Wifi is offered.
Recommendations for Hosts
- Ensure your listing includes all essential amenities for Fiordland Community: Smoke alarm, Free parking on premises.
- Prioritize adding missing essentials: Smoke alarm, Free parking on premises.
- Consider adding popular differentiators like Heating or Wifi to increase appeal.
- Highlight unique or less common amenities you offer (e.g., hot tub, dedicated workspace, EV charger) in your listing description and photos.
- Regularly check competitor amenities in Fiordland Community to stay competitive.
Fiordland Community Airbnb Guest Demographics & Profile Analysis (2026)
Guest Profile Summary for Fiordland Community
- The typical guest profile for Airbnb in Fiordland Community consists of predominantly international visitors (85%), with top international origins including Australia, typically belonging to the Post-2000s (Gen Z/Alpha) group (50%), primarily speaking English or Chinese.
- Domestic travelers account for 14.7% of guests.
- Key international markets include United States (27.6%) and Australia (25.1%).
- Top languages spoken are English (61.4%) followed by Chinese (8.8%).
- A significant demographic segment is the Post-2000s (Gen Z/Alpha) group, representing 50% of guests.
Recommendations for Hosts
- Focus marketing internationally, particularly towards travelers from Australia.
- Tailor amenities and listing descriptions to appeal to the dominant Post-2000s (Gen Z/Alpha) demographic (e.g., highlight fast WiFi, smart home features, local guides).
- Highlight unique local experiences or amenities relevant to the primary guest profile.
- Consider seasonal promotions aligned with peak travel times for key origin markets.
Nearby Short-Term Rental Market Comparison
How does the Fiordland Community Airbnb market stack up against its neighbors? Compare key performance metrics like average monthly revenue, ADR, and occupancy rates in surrounding areas to understand the broader regional STR landscape.
| Market | Active Properties | Monthly Revenue | Daily Rate | Avg. Occupancy |
|---|---|---|---|---|
| Queenstown | 2,391 | $4,767 | $355.38 | 55% |
| Kawarau Falls | 23 | $4,070 | $508.60 | 49% |
| Speargrass Flat | 15 | $3,817 | $522.43 | 50% |
| Closeburn | 10 | $3,606 | $291.60 | 54% |
| Arrow Junction | 19 | $3,571 | $314.34 | 54% |
| Arrowtown | 186 | $2,813 | $325.59 | 46% |
| Millbrook | 23 | $2,808 | $366.17 | 38% |
| Arthurs Point | 43 | $2,658 | $268.64 | 47% |
| Jacks Point | 217 | $2,567 | $289.57 | 50% |
| Mount Creighton | 21 | $2,490 | $223.39 | 48% |