Wānaka Airbnb Market Analysis 2026: Short Term Rental Data & Vacation Rental Statistics in Otago, New Zealand
Is Airbnb profitable in Wānaka in 2026? Explore comprehensive Airbnb analytics for Wānaka, Otago, New Zealand to uncover income potential. This 2026 STR market report for Wānaka, based on AirROI data from February 2025 to January 2026, reveals key trends in the bustling market of 1,143 active listings.
Whether you're considering an Airbnb investment in Wānaka, optimizing your existing vacation rental, or exploring rental arbitrage opportunities, understanding the Wānaka Airbnb data is crucial. Leveraging the low regulation environment is key to maximizing your short term rental income potential. Let's dive into the specifics.
Key Wānaka Airbnb Performance Metrics Overview
Monthly Airbnb Revenue Variations & Income Potential in Wānaka (2026)
Understanding the monthly revenue variations for Airbnb listings in Wānaka is key to maximizing your short term rental income potential. Seasonality significantly impacts earnings. Our analysis, based on data from the past 12 months, shows that the peak revenue month for STRs in Wānaka is typically August, while May often presents the lowest earnings, highlighting opportunities for strategic pricing adjustments during shoulder and low seasons. Explore the typical Airbnb income in Wānaka across different performance tiers:
- Best-in-class properties (Top 10%) achieve $7,032+ monthly, often utilizing dynamic pricing and superior guest experiences.
- Strong performing properties (Top 25%) earn $4,664 or more, indicating effective management and desirable locations/amenities.
- Typical properties (Median) generate around $2,852 per month, representing the average market performance.
- Entry-level properties (Bottom 25%) see earnings around $1,569, often with potential for optimization.
Average Monthly Airbnb Earnings Trend in Wānaka
Wānaka Airbnb Occupancy Rate Trends (2026)
Maximize your bookings by understanding the Wānaka STR occupancy trends. Seasonal demand shifts significantly influence how often properties are booked. Typically, Augustsees the highest demand (peak season occupancy), while June experiences the lowest (low season). Effective strategies, like adjusting minimum stays or offering promotions, can boost occupancy during slower periods. Here's how different property tiers perform in Wānaka:
- Best-in-class properties (Top 10%) achieve 84%+ occupancy, indicating high desirability and potentially optimized availability.
- Strong performing properties (Top 25%) maintain 70% or higher occupancy, suggesting good market fit and guest satisfaction.
- Typical properties (Median) have an occupancy rate around 47%.
- Entry-level properties (Bottom 25%) average 23% occupancy, potentially facing higher vacancy.
Average Monthly Occupancy Rate Trend in Wānaka
Average Daily Rate (ADR) Airbnb Trends in Wānaka (2026)
Effective short term rental pricing strategy in Wānaka involves understanding monthly ADR fluctuations. The Average Daily Rate (ADR) for Airbnb in Wānaka typically peaks in January and dips lowest during May. Leveraging Airbnb dynamic pricing tools or strategies based on this seasonality can significantly boost revenue. Here's a look at the typical nightly rates achieved:
- Best-in-class properties (Top 10%) command rates of $497+ per night, often due to premium features or locations.
- Strong performing properties (Top 25%) achieve nightly rates of $345 or more.
- Typical properties (Median) charge around $240 per night.
- Entry-level properties (Bottom 25%) earn around $159 per night.
Average Daily Rate (ADR) Trend by Month in Wānaka
Get Live Wānaka Market Intelligence 👇

Explore Real-time Analytics
Airbnb Seasonality Analysis & Trends in Wānaka (2026)
Peak Season (August, December, March)
- Revenue averages $4,564 per month
- Occupancy rates average 56.4%
- Daily rates average $289
Shoulder Season
- Revenue averages $3,732 per month
- Occupancy maintains around 49.9%
- Daily rates hold near $286
Low Season (May, June, October)
- Revenue drops to average $2,399 per month
- Occupancy decreases to average 32.5%
- Daily rates adjust to average $276
Seasonality Insights for Wānaka
- The Airbnb seasonality in Wānaka shows highly seasonal trends requiring careful strategy. While the sections above show seasonal averages, it's also insightful to look at the extremes:
- During the high season, the absolute peak month showcases Wānaka's highest earning potential, with monthly revenues capable of climbing to $5,041, occupancy reaching a high of 59.2%, and ADRs peaking at $300.
- Conversely, the slowest single month of the year, typically falling within the low season, marks the market's lowest point. In this month, revenue might dip to $2,210, occupancy could drop to 27.4%, and ADRs may adjust down to $268.
- Understanding both the seasonal averages and these monthly peaks and troughs in revenue, occupancy, and ADR is crucial for maximizing your Airbnb profit potential in Wānaka.
Seasonal Strategies for Maximizing Profit
- Peak Season: Maximize revenue through premium pricing and potentially longer minimum stays. Ensure high availability.
- Low Season: Offer competitive pricing, special promotions (e.g., extended stay discounts), and flexible cancellation policies. Target off-season travelers like remote workers or budget-conscious guests.
- Shoulder Seasons: Implement dynamic pricing that balances peak and low rates. Target weekend travelers or specific events. Offer slightly more flexible terms than peak season.
- Regularly analyze your own performance against these Wānaka seasonality benchmarks and adjust your pricing and availability strategy accordingly.
Best Areas for Airbnb Investment in Wānaka (2026)
Exploring the top neighborhoods for short-term rentals in Wānaka? This section highlights key areas, outlining why they are attractive for hosts and guests, along with notable local attractions. Consider these locations based on your target guest profile and investment strategy.
| Neighborhood / Area | Why Host Here? (Target Guests & Appeal) | Key Attractions & Landmarks |
|---|---|---|
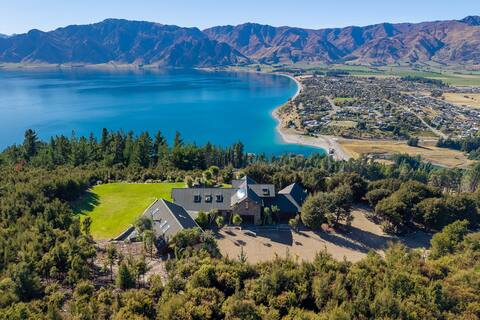
| Wānaka Town Centre | The vibrant heart of Wānaka, offering a mix of shops, cafes, and restaurants. This area is ideal for tourists looking to explore the local culture and attractions, with easy access to the lake and hiking trails. | Lake Wānaka, Wānaka Tree, Puzzling World, Cinema Paradiso, Mountain biking trails |
| Cardrona Valley | Known for its stunning landscapes and outdoor activities, Cardrona is a favorite for ski enthusiasts in winter and mountain bikers in summer. Perfect for visitors seeking adventure and breathtaking scenery. | Cardrona Ski Resort, Cardrona Alpine Resort, Cardrona Distillery, Mountain biking trails |
| Lake Wānaka Foreshore | A picturesque area along the lake that attracts families and couples alike, offering stunning views and recreational activities. Ideal for those wanting a relaxing lakeside experience. | Lake Foreshore Walk, Wānaka Skate Park, Picnic areas, Jet boating, Stand-up paddleboarding |
| Mount Aspiring National Park | A UNESCO World Heritage site, this national park is perfect for nature lovers and adventurers looking to explore breathtaking hikes and landscapes. A prime location for those interested in outdoor activities. | Rob Roy Glacier Track, Fishing spots, Hiking trails, Wildlife viewing |
| Rippon Vineyard | Offering not just local wines but stunning views over Wānaka and the lake. Attractive for visitors looking to enjoy good food, wine, and beautiful scenery. | Rippon Vineyard Tastings, Wine tours, Views over Lake Wānaka, Culinary events |
| Albert Town | A burgeoning suburb just outside Wānaka, popular with families and those looking for more affordable accommodation while still close to amenities and nature. | Outdoor swimming pool, Riverside walks, Cafe culture |
| Hawea | A quieter lakeside community, perfect for families and those seeking a more serene environment. Offers beautiful views and easy access to the outdoor activities surrounding both Lake Hawea and Lake Wānaka. | Lake Hawea, Fishing spots, Hiking trails, Local cafes |
| Glendhu Bay | A stunning natural area known for its beautiful lakefront vistas and various outdoor activities including water sports, hiking, and biking. Ideal for adventure-seeking guests. | Glendhu Bay Track, Water sports, Picnic areas, Mountain biking trails |
Understanding Airbnb License Requirements & STR Laws in Wānaka (2026)
While Wānaka, Otago, New Zealand currently shows low STR regulations, specific Airbnb license requirements might still exist or change. Always verify the latest short term rental regulations and Airbnb license requirements directly with local government authorities for Wānaka to ensure full compliance before hosting.
(Source: AirROI data, 2026, based on 0% licensed listings)
Top Performing Airbnb Properties in Wānaka (2026)
Benchmark your potential! Explore examples of top-performing Airbnb properties in Wānakabased on Trailing Twelve Month (TTM) revenue. Analyze their characteristics, revenue, occupancy rate, and ADR to understand what drives success in this market.
Lake Hawea View
Entire Place • 7 bedrooms
Private Boutique Lodge in Wanaka, Views & HotTub
Entire Place • 6 bedrooms

Grand Peninsula Lodge
Entire Place • 5 bedrooms

Lakeside Luxury Retreat | Pool & Stunning Views
Entire Place • 3 bedrooms
Peninsula Bay Luxury Retreat
Entire Place • 6 bedrooms

That Wanaka Tree House - BEST Lake Front Location
Entire Place • 5 bedrooms
Note: Performance varies based on location, size, amenities, seasonality, and management quality. Data reflects the past 12 months.
Top Performing Airbnb Hosts in Wānaka (2026)
Learn from the best! This table showcases top-performing Airbnb hosts in Wānaka based on the number of properties managed and estimated total revenue over the past year. Analyze their scale and performance metrics.
| Host Name | Properties | Grossing Revenue | Stay Reviews | Avg Rating |
|---|---|---|---|---|
| Heather | 52 | $2,581,925 | 2052 | 4.94/5.0 |
| Wanaka Selection | 59 | $2,066,668 | 847 | 4.77/5.0 |
| Simon | 41 | $1,560,010 | 635 | 4.71/5.0 |
| Kim - Lakeview Properties Wana | 40 | $1,528,827 | 858 | 4.92/5.0 |
| Home Base Wanaka | 15 | $1,035,128 | 523 | 4.76/5.0 |
| New Zealand Sothebys Internati | 12 | $921,826 | 77 | 4.88/5.0 |
| Release | 18 | $806,241 | 65 | 4.98/5.0 |
| Brendan | 11 | $661,188 | 1500 | 4.56/5.0 |
| Adrien | 12 | $565,146 | 969 | 4.85/5.0 |
| Be Our Guest Wanaka | 21 | $552,075 | 242 | 4.86/5.0 |
Analyzing the strategies of top hosts, such as their property selection, pricing, and guest communication, can offer valuable lessons for optimizing your own Airbnb operations in Wānaka.
Dive Deeper: Advanced Wānaka STR Market Data (2026)
Ready to unlock more insights? AirROI provides access to advanced metrics and comprehensive Airbnb data for Wānaka. Explore detailed analytics beyond this report to refine your investment strategy, optimize pricing, and maximize your vacation rental profits.
Explore Advanced MetricsWānaka Short-Term Rental Market Composition (2026): Property & Room Types
Room Type Distribution
Property Type Distribution
Market Composition Insights for Wānaka
- The Wānaka Airbnb market composition is heavily skewed towards Entire Home/Apt listings, which make up 92.4% of the 1,143 active rentals. This indicates strong guest preference for privacy and space.
- Looking at the property type distribution in Wānaka, House properties are the most common (59.7%), reflecting the local real estate landscape.
- Houses represent a significant 59.7% portion, catering likely to families or larger groups.
- The presence of 6.5% Hotel/Boutique listings indicates integration with traditional hospitality.
- Smaller segments like outdoor/unique (combined 1.8%) offer potential for unique stay experiences.
Wānaka Airbnb Room Capacity Analysis (2026): Bedroom Distribution
Distribution of Listings by Number of Bedrooms
Room Capacity Insights for Wānaka
- The dominant room capacity in Wānaka is 3 bedrooms listings, making up 26.2% of the market. This suggests a strong demand for properties suitable for families or small groups.
- Together, 3 bedrooms and 2 bedrooms properties represent 48.0% of the active Airbnb listings in Wānaka, indicating a high concentration in these sizes.
- A significant 50.1% of listings offer 3+ bedrooms, catering to larger groups and families seeking more space in Wānaka.
Wānaka Vacation Rental Guest Capacity Trends (2026)
Distribution of Listings by Guest Capacity
Guest Capacity Insights for Wānaka
- The most common guest capacity trend in Wānaka vacation rentals is listings accommodating 8+ guests (26%). This suggests the primary traveler segment is likely larger groups.
- Properties designed for 8+ guests and 6 guests dominate the Wānaka STR market, accounting for 47.2% of listings.
- 50.3% of properties accommodate 6+ guests, serving the market segment for larger families or group travel in Wānaka.
- On average, properties in Wānaka are equipped to host 5.0 guests.
Wānaka Airbnb Booking Patterns (2026): Available vs. Booked Days
Available Days Distribution
Booked Days Distribution
Booking Pattern Insights for Wānaka
- The most common availability pattern in Wānaka falls within the 271-366 days range, representing 40.2% of listings. This suggests many properties have significant open periods on their calendars.
- Approximately 71.3% of listings show high availability (181+ days open annually), indicating potential for increased bookings or specific owner usage patterns.
- For booked days, the 91-180 days range is most frequent in Wānaka (31.4%), reflecting common guest stay durations or potential owner blocking patterns.
- A notable 29.9% of properties secure long booking periods (181+ days booked per year), highlighting successful long-term rental strategies or significant owner usage.
Wānaka Airbnb Minimum Stay Requirements Analysis
Distribution of Listings by Minimum Night Requirement
1 Night
158 listings
13.8% of total
2 Nights
192 listings
16.8% of total
3 Nights
76 listings
6.6% of total
4-6 Nights
82 listings
7.2% of total
7-29 Nights
9 listings
0.8% of total
30+ Nights
626 listings
54.8% of total
Key Insights
- The most prevalent minimum stay requirement in Wānaka is 30+ Nights, adopted by 54.8% of listings. This highlights the market's preference for longer commitments.
- A significant segment (54.8%) caters to monthly stays (30+ nights) in Wānaka, pointing to opportunities in the extended-stay market.
Recommendations
- Align with the market by considering a 30+ Nights minimum stay, as 54.8% of Wānaka hosts use this setting.
- If feasible, allowing 1-night stays, especially midweek or during low season, could capture last-minute bookings, as only 13.8% currently do.
- Explore offering discounts for stays of 30+ nights to attract the 54.8% of the market seeking extended stays.
- Adjust minimum nights based on seasonality – potentially shorter during low season and longer during peak demand periods in Wānaka.
Wānaka Airbnb Cancellation Policy Trends Analysis (2026)
Limited
29 listings
2.5% of total
Super Strict 60 Days
22 listings
1.9% of total
Super Strict 30 Days
81 listings
7.1% of total
Flexible
87 listings
7.6% of total
Moderate
269 listings
23.6% of total
Firm
566 listings
49.6% of total
Strict
87 listings
7.6% of total
Cancellation Policy Insights for Wānaka
- The prevailing Airbnb cancellation policy trend in Wānaka is Firm, used by 49.6% of listings.
- A majority (57.2%) of hosts in Wānaka utilize Firm or Strict policies, indicating a market where hosts prioritize booking security.
- Strict cancellation policies are quite rare (7.6%), potentially making listings with this policy less competitive unless justified by high demand or property type.
Recommendations for Hosts
- Consider adopting a Firm policy to align with the 49.6% market standard in Wānaka.
- Using a Strict policy might deter some guests, as only 7.6% of listings use it. Evaluate if potential revenue protection outweighs possible lower booking rates.
- Regularly review your cancellation policy against competitors and market demand shifts in Wānaka.
Wānaka STR Booking Lead Time Analysis (2026)
Average Booking Lead Time by Month
Booking Lead Time Insights for Wānaka
- The overall average booking lead time for vacation rentals in Wānaka is 79 days.
- Guests book furthest in advance for stays during December (average 105 days), likely coinciding with peak travel demand or local events.
- The shortest booking windows occur for stays in June (average 48 days), indicating more last-minute travel plans during this time.
- Seasonally, Winter (91 days avg.) sees the longest lead times, while Summer (70 days avg.) has the shortest, reflecting typical travel planning cycles.
Recommendations for Hosts
- Use the overall average lead time (79 days) as a baseline for your pricing and availability strategy in Wānaka.
- For December stays, consider implementing length-of-stay discounts or slightly higher rates for bookings made less than 105 days out to capitalize on advance planning.
- Target marketing efforts for the Winter season well in advance (at least 91 days) to capture early planners.
- Monitor your own booking lead times against these Wānaka averages to identify opportunities for dynamic pricing adjustments.
Popular & Essential Airbnb Amenities in Wānaka (2026)
Amenity Prevalence
Amenity Insights for Wānaka
- Essential amenities in Wānaka that guests expect include: Wifi, Smoke alarm. Lacking these (any) could significantly impact bookings.
- Popular amenities like Free parking on premises, Heating, TV are common but not universal. Offering these can provide a competitive edge.
Recommendations for Hosts
- Ensure your listing includes all essential amenities for Wānaka: Wifi, Smoke alarm.
- Prioritize adding missing essentials: Wifi, Smoke alarm.
- Consider adding popular differentiators like Free parking on premises or Heating to increase appeal.
- Highlight unique or less common amenities you offer (e.g., hot tub, dedicated workspace, EV charger) in your listing description and photos.
- Regularly check competitor amenities in Wānaka to stay competitive.
Wānaka Airbnb Guest Demographics & Profile Analysis (2026)
Guest Profile Summary for Wānaka
- The typical guest profile for Airbnb in Wānaka consists of predominantly international visitors (76%), with top international origins including New Zealand, typically belonging to the Post-2000s (Gen Z/Alpha) group (50%), primarily speaking English or Chinese.
- Domestic travelers account for 23.6% of guests.
- Key international markets include Australia (27.6%) and New Zealand (23.6%).
- Top languages spoken are English (60.3%) followed by Chinese (11.7%).
- A significant demographic segment is the Post-2000s (Gen Z/Alpha) group, representing 50% of guests.
Recommendations for Hosts
- Focus marketing internationally, particularly towards travelers from New Zealand.
- Tailor amenities and listing descriptions to appeal to the dominant Post-2000s (Gen Z/Alpha) demographic (e.g., highlight fast WiFi, smart home features, local guides).
- Highlight unique local experiences or amenities relevant to the primary guest profile.
- Consider seasonal promotions aligned with peak travel times for key origin markets.
Nearby Short-Term Rental Market Comparison
How does the Wānaka Airbnb market stack up against its neighbors? Compare key performance metrics like average monthly revenue, ADR, and occupancy rates in surrounding areas to understand the broader regional STR landscape.
| Market | Active Properties | Monthly Revenue | Daily Rate | Avg. Occupancy |
|---|---|---|---|---|
| Lake Tekapo | 428 | $4,977 | $282.80 | 61% |
| Queenstown | 2,391 | $4,767 | $355.38 | 55% |
| Ben Ohau | 14 | $4,707 | $224.83 | 72% |
| Kawarau Falls | 23 | $4,070 | $508.60 | 49% |
| Speargrass Flat | 15 | $3,817 | $522.43 | 50% |
| Closeburn | 10 | $3,606 | $291.60 | 54% |
| Arrow Junction | 19 | $3,571 | $314.34 | 54% |
| Franz Josef Glacier | 23 | $3,435 | $194.79 | 64% |
| Dalefield | 14 | $3,194 | $310.72 | 43% |
| Franz Josef | 34 | $3,157 | $221.43 | 50% |