Mount Creighton Airbnb Market Analysis 2026: Short Term Rental Data & Vacation Rental Statistics in Otago, New Zealand
Is Airbnb profitable in Mount Creighton in 2026? Explore comprehensive Airbnb analytics for Mount Creighton, Otago, New Zealand to uncover income potential. This 2026 STR market report for Mount Creighton, based on AirROI data from February 2025 to January 2026, reveals key trends in the niche market of 21 active listings.
Whether you're considering an Airbnb investment in Mount Creighton, optimizing your existing vacation rental, or exploring rental arbitrage opportunities, understanding the Mount Creighton Airbnb data is crucial. Leveraging the low regulation environment is key to maximizing your short term rental income potential. Let's dive into the specifics.
Key Mount Creighton Airbnb Performance Metrics Overview
Monthly Airbnb Revenue Variations & Income Potential in Mount Creighton (2026)
Understanding the monthly revenue variations for Airbnb listings in Mount Creighton is key to maximizing your short term rental income potential. Seasonality significantly impacts earnings. Our analysis, based on data from the past 12 months, shows that the peak revenue month for STRs in Mount Creighton is typically December, while May often presents the lowest earnings, highlighting opportunities for strategic pricing adjustments during shoulder and low seasons. Explore the typical Airbnb income in Mount Creighton across different performance tiers:
- Best-in-class properties (Top 10%) achieve $7,630+ monthly, often utilizing dynamic pricing and superior guest experiences.
- Strong performing properties (Top 25%) earn $4,017 or more, indicating effective management and desirable locations/amenities.
- Typical properties (Median) generate around $2,158 per month, representing the average market performance.
- Entry-level properties (Bottom 25%) see earnings around $1,351, often with potential for optimization.
Average Monthly Airbnb Earnings Trend in Mount Creighton
Mount Creighton Airbnb Occupancy Rate Trends (2026)
Maximize your bookings by understanding the Mount Creighton STR occupancy trends. Seasonal demand shifts significantly influence how often properties are booked. Typically, Februarysees the highest demand (peak season occupancy), while May experiences the lowest (low season). Effective strategies, like adjusting minimum stays or offering promotions, can boost occupancy during slower periods. Here's how different property tiers perform in Mount Creighton:
- Best-in-class properties (Top 10%) achieve 81%+ occupancy, indicating high desirability and potentially optimized availability.
- Strong performing properties (Top 25%) maintain 71% or higher occupancy, suggesting good market fit and guest satisfaction.
- Typical properties (Median) have an occupancy rate around 52%.
- Entry-level properties (Bottom 25%) average 30% occupancy, potentially facing higher vacancy.
Average Monthly Occupancy Rate Trend in Mount Creighton
Average Daily Rate (ADR) Airbnb Trends in Mount Creighton (2026)
Effective short term rental pricing strategy in Mount Creighton involves understanding monthly ADR fluctuations. The Average Daily Rate (ADR) for Airbnb in Mount Creighton typically peaks in December and dips lowest during March. Leveraging Airbnb dynamic pricing tools or strategies based on this seasonality can significantly boost revenue. Here's a look at the typical nightly rates achieved:
- Best-in-class properties (Top 10%) command rates of $442+ per night, often due to premium features or locations.
- Strong performing properties (Top 25%) achieve nightly rates of $303 or more.
- Typical properties (Median) charge around $177 per night.
- Entry-level properties (Bottom 25%) earn around $116 per night.
Average Daily Rate (ADR) Trend by Month in Mount Creighton
Get Live Mount Creighton Market Intelligence 👇

Explore Real-time Analytics
Airbnb Seasonality Analysis & Trends in Mount Creighton (2026)
Peak Season (December, February, July)
- Revenue averages $4,311 per month
- Occupancy rates average 60.6%
- Daily rates average $235
Shoulder Season
- Revenue averages $3,324 per month
- Occupancy maintains around 51.5%
- Daily rates hold near $237
Low Season (April, May, June)
- Revenue drops to average $2,470 per month
- Occupancy decreases to average 43.0%
- Daily rates adjust to average $207
Seasonality Insights for Mount Creighton
- The Airbnb seasonality in Mount Creighton shows moderate seasonality with distinct peak and low periods. While the sections above show seasonal averages, it's also insightful to look at the extremes:
- During the high season, the absolute peak month showcases Mount Creighton's highest earning potential, with monthly revenues capable of climbing to $4,536, occupancy reaching a high of 72.7%, and ADRs peaking at $275.
- Conversely, the slowest single month of the year, typically falling within the low season, marks the market's lowest point. In this month, revenue might dip to $2,193, occupancy could drop to 34.7%, and ADRs may adjust down to $203.
- Understanding both the seasonal averages and these monthly peaks and troughs in revenue, occupancy, and ADR is crucial for maximizing your Airbnb profit potential in Mount Creighton.
Seasonal Strategies for Maximizing Profit
- Peak Season: Maximize revenue through premium pricing and potentially longer minimum stays. Ensure high availability.
- Low Season: Offer competitive pricing, special promotions (e.g., extended stay discounts), and flexible cancellation policies. Target off-season travelers like remote workers or budget-conscious guests.
- Shoulder Seasons: Implement dynamic pricing that balances peak and low rates. Target weekend travelers or specific events. Offer slightly more flexible terms than peak season.
- Regularly analyze your own performance against these Mount Creighton seasonality benchmarks and adjust your pricing and availability strategy accordingly.
Best Areas for Airbnb Investment in Mount Creighton (2026)
Exploring the top neighborhoods for short-term rentals in Mount Creighton? This section highlights key areas, outlining why they are attractive for hosts and guests, along with notable local attractions. Consider these locations based on your target guest profile and investment strategy.
| Neighborhood / Area | Why Host Here? (Target Guests & Appeal) | Key Attractions & Landmarks |
|---|---|---|
| Queenstown | Popular tourist destination known for its stunning scenery, adventure sports, and vibrant nightlife. A hotspot for travelers year-round, from skiing in winter to hiking and boating in summer. | Lake Wakatipu, Skyline Queenstown, Queenstown Gardens, Shotover Jet, Glenorchy, Milford Sound |
| Wanaka | Scenic town beside Lake Wanaka offering outdoor activities and a laid-back vibe. Ideal for families and tourists looking for relaxation and nature. | Lake Wanaka, Treble Cone Ski Area, Wanaka Tree, Rippon Vineyard, Mount Aspiring National Park, Puzzling World |
| Arrowtown | Historic gold mining town with charming streets and beautiful autumn colors. Attracts visitors for its history and local cuisine. | Arrow River, Historic Buildings, Doe Street, Arrowtown Autumn Festival, Goldfields Mining Centre |
| Glenorchy | Gateway to some of New Zealand's most incredible natural scenery. Perfect for eco-tourists and those seeking adventure activities. | Glenorchy Lagoon Walkway, Routeburn Track, Paradise, Glenorchy Air, Kinloch |
| Frankton | Convenient location with easy access to Queenstown Airport and nearby amenities. Popular with families and business travelers alike. | Frankton Arm Pump Track, Lake Hayes, Local shops, Queenstown Airport, Golf courses |
| Milford Sound | One of New Zealand's top natural attractions, famed for its breathtaking fjords. Ideal for visitors seeking a unique and memorable experience. | Mitre Peak, Milford Track, Doubtful Sound, Kayaking Tours, Visitor Centre |
| Cardrona | Famous for its ski resort and summer mountain biking trails, it draws outdoor enthusiasts throughout the year. | Cardrona Ski Resort, Cardrona Alpine Resort, Cardrona Distillery, Bra Fence, Walking trails |
| Kawarau Gorge | A scenic gorge offering bungee jumping and stunning landscapes. Great for adventure seekers and nature lovers. | Kawarau Bridge, AJ Hackett Bungy, Bicycling trails, Wine tasting at nearby wineries, Scenic lookouts |
Understanding Airbnb License Requirements & STR Laws in Mount Creighton (2026)
While Mount Creighton, Otago, New Zealand currently shows low STR regulations, specific Airbnb license requirements might still exist or change. Always verify the latest short term rental regulations and Airbnb license requirements directly with local government authorities for Mount Creighton to ensure full compliance before hosting.
(Source: AirROI data, 2026, finding no licensed listings among those analyzed)
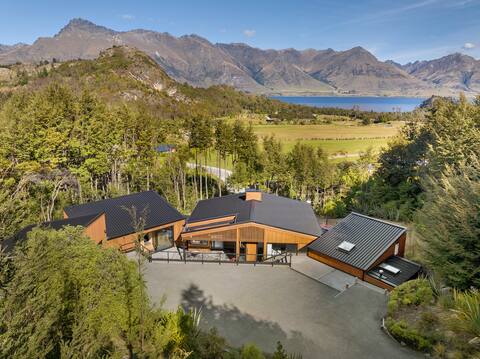
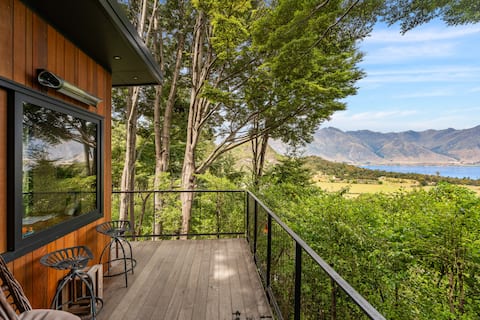
Top Performing Airbnb Properties in Mount Creighton (2026)
Benchmark your potential! Explore examples of top-performing Airbnb properties in Mount Creightonbased on Trailing Twelve Month (TTM) revenue. Analyze their characteristics, revenue, occupancy rate, and ADR to understand what drives success in this market.

Lookout Lodge I Queenstown
Entire Place • 4 bedrooms
Serene Mountain Oasis Hideaway
Entire Place • 4 bedrooms

Family home in the forest. Epic views, spa & cat
Entire Place • 3 bedrooms
Unique & Private Treehouse with Outdoor Bathtub
Entire Place • 1 bedroom

Mount Creighton Escapes Limited
Entire Place • 2 bedrooms

Tree Retreat in Queenstown (Award Winning)
Entire Place • 2 bedrooms
Note: Performance varies based on location, size, amenities, seasonality, and management quality. Data reflects the past 12 months.
Top Performing Airbnb Hosts in Mount Creighton (2026)
Learn from the best! This table showcases top-performing Airbnb hosts in Mount Creighton based on the number of properties managed and estimated total revenue over the past year. Analyze their scale and performance metrics.
| Host Name | Properties | Grossing Revenue | Stay Reviews | Avg Rating |
|---|---|---|---|---|
| Anna | 1 | $128,353 | 18 | 5.00/5.0 |
| Emma | 1 | $74,083 | 13 | 5.00/5.0 |
| Jonny | 1 | $56,114 | 38 | 4.97/5.0 |
| Amy N Jonny | 1 | $44,449 | 259 | 4.96/5.0 |
| Ashley | 1 | $40,852 | 243 | 4.95/5.0 |
| Carolin | 1 | $40,149 | 50 | 4.88/5.0 |
| Spud | 1 | $34,088 | 225 | 4.79/5.0 |
| Suzanne | 3 | $33,563 | 307 | 4.97/5.0 |
| Tena Maree | 1 | $25,665 | 28 | 5.00/5.0 |
| Sarah | 1 | $24,092 | 125 | 4.98/5.0 |
Analyzing the strategies of top hosts, such as their property selection, pricing, and guest communication, can offer valuable lessons for optimizing your own Airbnb operations in Mount Creighton.
Dive Deeper: Advanced Mount Creighton STR Market Data (2026)
Ready to unlock more insights? AirROI provides access to advanced metrics and comprehensive Airbnb data for Mount Creighton. Explore detailed analytics beyond this report to refine your investment strategy, optimize pricing, and maximize your vacation rental profits.
Explore Advanced MetricsMount Creighton Short-Term Rental Market Composition (2026): Property & Room Types
Room Type Distribution
Property Type Distribution
Market Composition Insights for Mount Creighton
- The Mount Creighton Airbnb market composition is heavily skewed towards Entire Home/Apt listings, which make up 90.5% of the 21 active rentals. This indicates strong guest preference for privacy and space.
- Looking at the property type distribution in Mount Creighton, House properties are the most common (42.9%), reflecting the local real estate landscape.
- Houses represent a significant 42.9% portion, catering likely to families or larger groups.
- The presence of 19% Hotel/Boutique listings indicates integration with traditional hospitality.
- Smaller segments like apartment/condo, unique stays (combined 9.6%) offer potential for unique stay experiences.
Mount Creighton Airbnb Room Capacity Analysis (2026): Bedroom Distribution
Distribution of Listings by Number of Bedrooms
Room Capacity Insights for Mount Creighton
- The dominant room capacity in Mount Creighton is 2 bedrooms listings, making up 33.3% of the market. This suggests a strong demand for properties suitable for couples or solo travelers.
- Together, 2 bedrooms and 1 bedroom properties represent 61.9% of the active Airbnb listings in Mount Creighton, indicating a high concentration in these sizes.
- A significant 28.6% of listings offer 3+ bedrooms, catering to larger groups and families seeking more space in Mount Creighton.
Mount Creighton Vacation Rental Guest Capacity Trends (2026)
Distribution of Listings by Guest Capacity
Guest Capacity Insights for Mount Creighton
- The most common guest capacity trend in Mount Creighton vacation rentals is listings accommodating 4 guests (38.1%). This suggests the primary traveler segment is likely small families or groups.
- Properties designed for 4 guests and 2 guests dominate the Mount Creighton STR market, accounting for 61.9% of listings.
- 28.6% of properties accommodate 6+ guests, serving the market segment for larger families or group travel in Mount Creighton.
- On average, properties in Mount Creighton are equipped to host 4.3 guests.
Mount Creighton Airbnb Booking Patterns (2026): Available vs. Booked Days
Available Days Distribution
Booked Days Distribution
Booking Pattern Insights for Mount Creighton
- The most common availability pattern in Mount Creighton falls within the 181-270 days range, representing 47.6% of listings. This suggests many properties have significant open periods on their calendars.
- Approximately 71.4% of listings show high availability (181+ days open annually), indicating potential for increased bookings or specific owner usage patterns.
- For booked days, the 91-180 days range is most frequent in Mount Creighton (42.9%), reflecting common guest stay durations or potential owner blocking patterns.
- A notable 33.3% of properties secure long booking periods (181+ days booked per year), highlighting successful long-term rental strategies or significant owner usage.
Mount Creighton Airbnb Minimum Stay Requirements Analysis
Distribution of Listings by Minimum Night Requirement
1 Night
1 listings
4.8% of total
2 Nights
7 listings
33.3% of total
3 Nights
1 listings
4.8% of total
7-29 Nights
1 listings
4.8% of total
30+ Nights
11 listings
52.4% of total
Key Insights
- The most prevalent minimum stay requirement in Mount Creighton is 30+ Nights, adopted by 52.4% of listings. This highlights the market's preference for longer commitments.
- A significant segment (52.4%) caters to monthly stays (30+ nights) in Mount Creighton, pointing to opportunities in the extended-stay market.
Recommendations
- Align with the market by considering a 30+ Nights minimum stay, as 52.4% of Mount Creighton hosts use this setting.
- If feasible, allowing 1-night stays, especially midweek or during low season, could capture last-minute bookings, as only 4.8% currently do.
- A 2-night minimum appears standard (33.3%). Consider this for weekends or peak periods.
- Explore offering discounts for stays of 30+ nights to attract the 52.4% of the market seeking extended stays.
- Adjust minimum nights based on seasonality – potentially shorter during low season and longer during peak demand periods in Mount Creighton.
Mount Creighton Airbnb Cancellation Policy Trends Analysis (2026)
Flexible
2 listings
9.5% of total
Moderate
5 listings
23.8% of total
Firm
12 listings
57.1% of total
Strict
2 listings
9.5% of total
Cancellation Policy Insights for Mount Creighton
- The prevailing Airbnb cancellation policy trend in Mount Creighton is Firm, used by 57.1% of listings.
- A majority (66.6%) of hosts in Mount Creighton utilize Firm or Strict policies, indicating a market where hosts prioritize booking security.
- Strict cancellation policies are quite rare (9.5%), potentially making listings with this policy less competitive unless justified by high demand or property type.
Recommendations for Hosts
- Consider adopting a Firm policy to align with the 57.1% market standard in Mount Creighton.
- Using a Strict policy might deter some guests, as only 9.5% of listings use it. Evaluate if potential revenue protection outweighs possible lower booking rates.
- Regularly review your cancellation policy against competitors and market demand shifts in Mount Creighton.
Mount Creighton STR Booking Lead Time Analysis (2026)
Average Booking Lead Time by Month
Booking Lead Time Insights for Mount Creighton
- The overall average booking lead time for vacation rentals in Mount Creighton is 58 days.
- Guests book furthest in advance for stays during December (average 104 days), likely coinciding with peak travel demand or local events.
- The shortest booking windows occur for stays in May (average 27 days), indicating more last-minute travel plans during this time.
- Seasonally, Winter (77 days avg.) sees the longest lead times, while Spring (36 days avg.) has the shortest, reflecting typical travel planning cycles.
Recommendations for Hosts
- Use the overall average lead time (58 days) as a baseline for your pricing and availability strategy in Mount Creighton.
- For December stays, consider implementing length-of-stay discounts or slightly higher rates for bookings made less than 104 days out to capitalize on advance planning.
- Target marketing efforts for the Winter season well in advance (at least 77 days) to capture early planners.
- Monitor your own booking lead times against these Mount Creighton averages to identify opportunities for dynamic pricing adjustments.
Popular & Essential Airbnb Amenities in Mount Creighton (2026)
Amenity Prevalence
Amenity Insights for Mount Creighton
- Essential amenities in Mount Creighton that guests expect include: Free parking on premises, Smoke alarm, Wifi, Hair dryer, Heating. Lacking these (any) could significantly impact bookings.
- Popular amenities like TV, Dishes and silverware, Bed linens are common but not universal. Offering these can provide a competitive edge.
Recommendations for Hosts
- Ensure your listing includes all essential amenities for Mount Creighton: Free parking on premises, Smoke alarm, Wifi, Hair dryer, Heating.
- Prioritize adding missing essentials: Heating.
- Consider adding popular differentiators like TV or Dishes and silverware to increase appeal.
- Highlight unique or less common amenities you offer (e.g., hot tub, dedicated workspace, EV charger) in your listing description and photos.
- Regularly check competitor amenities in Mount Creighton to stay competitive.
Mount Creighton Airbnb Guest Demographics & Profile Analysis (2026)
Guest Profile Summary for Mount Creighton
- The typical guest profile for Airbnb in Mount Creighton consists of predominantly international visitors (78%), with top international origins including New Zealand, typically belonging to the Post-2000s (Gen Z/Alpha) group (50%), primarily speaking English or German.
- Domestic travelers account for 22.1% of guests.
- Key international markets include Australia (30.8%) and New Zealand (22.1%).
- Top languages spoken are English (55.7%) followed by German (9.8%).
- A significant demographic segment is the Post-2000s (Gen Z/Alpha) group, representing 50% of guests.
Recommendations for Hosts
- Focus marketing internationally, particularly towards travelers from New Zealand.
- Tailor amenities and listing descriptions to appeal to the dominant Post-2000s (Gen Z/Alpha) demographic (e.g., highlight fast WiFi, smart home features, local guides).
- Highlight unique local experiences or amenities relevant to the primary guest profile.
- Consider seasonal promotions aligned with peak travel times for key origin markets.
Nearby Short-Term Rental Market Comparison
How does the Mount Creighton Airbnb market stack up against its neighbors? Compare key performance metrics like average monthly revenue, ADR, and occupancy rates in surrounding areas to understand the broader regional STR landscape.
| Market | Active Properties | Monthly Revenue | Daily Rate | Avg. Occupancy |
|---|---|---|---|---|
| Queenstown | 2,391 | $4,767 | $355.38 | 55% |
| Ben Ohau | 14 | $4,707 | $224.83 | 72% |
| Kawarau Falls | 23 | $4,070 | $508.60 | 49% |
| Speargrass Flat | 15 | $3,817 | $522.43 | 50% |
| Closeburn | 10 | $3,606 | $291.60 | 54% |
| Arrow Junction | 19 | $3,571 | $314.34 | 54% |
| Arrowtown | 186 | $2,813 | $325.59 | 46% |
| Millbrook | 23 | $2,808 | $366.17 | 38% |
| Arthurs Point | 43 | $2,658 | $268.64 | 47% |
| Wānaka | 1,143 | $2,641 | $281.00 | 45% |