Luggate Airbnb Market Analysis 2025: Short Term Rental Data & Vacation Rental Statistics in Otago, New Zealand
Is Airbnb profitable in Luggate in 2025? Explore comprehensive Airbnb analytics for Luggate, Otago, New Zealand to uncover income potential. This 2025 STR market report for Luggate, based on AirROI data from November 2024 to October 2025, reveals key trends in the niche market of 19 active listings.
Whether you're considering an Airbnb investment in Luggate, optimizing your existing vacation rental, or exploring rental arbitrage opportunities, understanding the Luggate Airbnb data is crucial. Leveraging the low regulation environment is key to maximizing your short term rental income potential. Let's dive into the specifics.
Key Luggate Airbnb Performance Metrics Overview
Monthly Airbnb Revenue Variations & Income Potential in Luggate (2025)
Understanding the monthly revenue variations for Airbnb listings in Luggate is key to maximizing your short term rental income potential. Seasonality significantly impacts earnings. Our analysis, based on data from the past 12 months, shows that the peak revenue month for STRs in Luggate is typically December, while October often presents the lowest earnings, highlighting opportunities for strategic pricing adjustments during shoulder and low seasons. Explore the typical Airbnb income in Luggate across different performance tiers:
- Best-in-class properties (Top 10%) achieve $4,994+ monthly, often utilizing dynamic pricing and superior guest experiences.
- Strong performing properties (Top 25%) earn $3,433 or more, indicating effective management and desirable locations/amenities.
- Typical properties (Median) generate around $1,537 per month, representing the average market performance.
- Entry-level properties (Bottom 25%) see earnings around $789, often with potential for optimization.
Average Monthly Airbnb Earnings Trend in Luggate
Luggate Airbnb Occupancy Rate Trends (2025)
Maximize your bookings by understanding the Luggate STR occupancy trends. Seasonal demand shifts significantly influence how often properties are booked. Typically, Augustsees the highest demand (peak season occupancy), while October experiences the lowest (low season). Effective strategies, like adjusting minimum stays or offering promotions, can boost occupancy during slower periods. Here's how different property tiers perform in Luggate:
- Best-in-class properties (Top 10%) achieve 76%+ occupancy, indicating high desirability and potentially optimized availability.
- Strong performing properties (Top 25%) maintain 63% or higher occupancy, suggesting good market fit and guest satisfaction.
- Typical properties (Median) have an occupancy rate around 44%.
- Entry-level properties (Bottom 25%) average 21% occupancy, potentially facing higher vacancy.
Average Monthly Occupancy Rate Trend in Luggate
Average Daily Rate (ADR) Airbnb Trends in Luggate (2025)
Effective short term rental pricing strategy in Luggate involves understanding monthly ADR fluctuations. The Average Daily Rate (ADR) for Airbnb in Luggate typically peaks in May and dips lowest during June. Leveraging Airbnb dynamic pricing tools or strategies based on this seasonality can significantly boost revenue. Here's a look at the typical nightly rates achieved:
- Best-in-class properties (Top 10%) command rates of $378+ per night, often due to premium features or locations.
- Strong performing properties (Top 25%) achieve nightly rates of $267 or more.
- Typical properties (Median) charge around $177 per night.
- Entry-level properties (Bottom 25%) earn around $103 per night.
Average Daily Rate (ADR) Trend by Month in Luggate
Get Live Luggate Market Intelligence 👇

Explore Real-time Analytics
Airbnb Seasonality Analysis & Trends in Luggate (2025)
Peak Season (December, January, November)
- Revenue averages $2,997 per month
- Occupancy rates average 45.9%
- Daily rates average $206
Shoulder Season
- Revenue averages $2,454 per month
- Occupancy maintains around 49.7%
- Daily rates hold near $198
Low Season (May, June, October)
- Revenue drops to average $1,318 per month
- Occupancy decreases to average 28.0%
- Daily rates adjust to average $192
Seasonality Insights for Luggate
- The Airbnb seasonality in Luggate shows highly seasonal trends requiring careful strategy. While the sections above show seasonal averages, it's also insightful to look at the extremes:
- During the high season, the absolute peak month showcases Luggate's highest earning potential, with monthly revenues capable of climbing to $3,428, occupancy reaching a high of 54.0%, and ADRs peaking at $211.
- Conversely, the slowest single month of the year, typically falling within the low season, marks the market's lowest point. In this month, revenue might dip to $1,116, occupancy could drop to 24.1%, and ADRs may adjust down to $179.
- Understanding both the seasonal averages and these monthly peaks and troughs in revenue, occupancy, and ADR is crucial for maximizing your Airbnb profit potential in Luggate.
Seasonal Strategies for Maximizing Profit
- Peak Season: Maximize revenue through premium pricing and potentially longer minimum stays. Ensure high availability.
- Low Season: Offer competitive pricing, special promotions (e.g., extended stay discounts), and flexible cancellation policies. Target off-season travelers like remote workers or budget-conscious guests.
- Shoulder Seasons: Implement dynamic pricing that balances peak and low rates. Target weekend travelers or specific events. Offer slightly more flexible terms than peak season.
- Regularly analyze your own performance against these Luggate seasonality benchmarks and adjust your pricing and availability strategy accordingly.
Best Areas for Airbnb Investment in Luggate (2025)
Exploring the top neighborhoods for short-term rentals in Luggate? This section highlights key areas, outlining why they are attractive for hosts and guests, along with notable local attractions. Consider these locations based on your target guest profile and investment strategy.
| Neighborhood / Area | Why Host Here? (Target Guests & Appeal) | Key Attractions & Landmarks |
|---|---|---|
| Luggate Village | A picturesque rural village with a charming atmosphere, ideal for visitors seeking a tranquil escape amidst stunning landscapes. Proximity to Wanaka and Queenstown makes it a prime location for outdoor adventurers. | Luggate Creek, Luggate Hotel, Scenic views of the Southern Alps, Access to biking and hiking trails, Nearby wineries and vineyards |
| Lake Wanaka | Close to Luggate, this popular destination offers stunning lake views and a range of water activities. It attracts tourists year-round for skiing in winter and water sports in summer. | Lake Wanaka, Mount Aspiring National Park, Wanaka Tree, Rippon Vineyard, Skyline Wanaka |
| Queenstown | Known as the adventure capital of the world, Queenstown is a short drive away offering a plethora of outdoor activities, dining, and nightlife that attracts visitors year-round. | Queenstown Gondola, Skydiving, Shotover Jet, AJ Hackett Bungy, Lake Wakatipu |
| Cardrona | A nearby ski resort that draws winter sports enthusiasts and summer visitors for hiking and biking. A perfect spot for Airbnb investment targeting adventure seekers. | Cardrona Alpine Resort, Cardrona Distillery, Outdoor biking and hiking trails, Cardrona Valley, Scenic views |
| Wanaka Town | A vibrant town surrounded by mountains and the lake, Wanaka has a relaxed atmosphere and caters to families, couples, and adventurers alike, making it very popular for short-term rentals. | Lake Wanaka, Puzzling World, Mount Iron, Wanaka Lavender Farm, Local boutiques and cafes |
| Glendhu Bay | A beautiful area on the edge of Lake Wanaka, perfect for those seeking tranquility and nature. Popular for water activities, and ideal for outdoor enthusiasts. | Glendhu Bay Campsite, Water sports on Lake Wanaka, Hiking trails, Scenic picnic spots, Cycle trails |
| Albert Town | A quaint village close to Wanaka, Albert Town is becoming increasingly popular for those seeking a peaceful retreat while still being close to attractions and amenities. | Clutha River, Local cafes, Biking and walking trails, Community markets, Access to nearby lakes |
| Mt. Aspirations | This area offers breathtaking mountain views and is a key location for outdoor activities. It attracts visitors who are looking for an adventurous getaway with plenty of nature. | Mt. Aspiring National Park, Hiking in the park, Scenic viewpoints, Adventure tourism, Trout fishing |
Understanding Airbnb License Requirements & STR Laws in Luggate (2025)
While Luggate, Otago, New Zealand currently shows low STR regulations, specific Airbnb license requirements might still exist or change. Always verify the latest short term rental regulations and Airbnb license requirements directly with local government authorities for Luggate to ensure full compliance before hosting.
(Source: AirROI data, 2025, finding no licensed listings among those analyzed)
Top Performing Airbnb Properties in Luggate (2025)
Benchmark your potential! Explore examples of top-performing Airbnb properties in Luggatebased on Trailing Twelve Month (TTM) revenue. Analyze their characteristics, revenue, occupancy rate, and ADR to understand what drives success in this market.

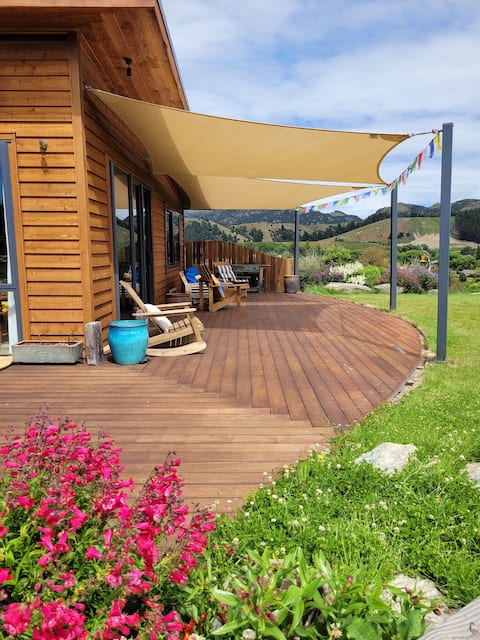
Gather, Feast & Relax - minutes from Wānaka
Entire Place • 3 bedrooms

Wanaka Winter Luxury, Hot Tub & Mountain Views
Entire Place • 3 bedrooms

Creek House near Wanaka
Entire Place • 2 bedrooms
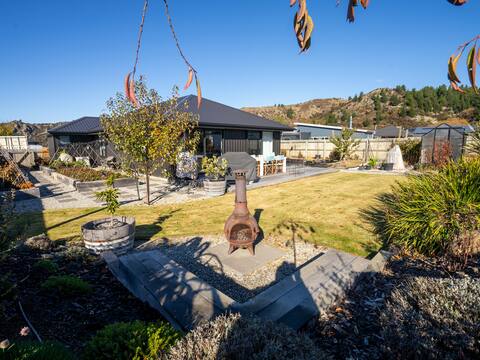
Riverland retreat
Entire Place • 2 bedrooms
Luggate Family Retreat - 3 Bedroom
Entire Place • 3 bedrooms
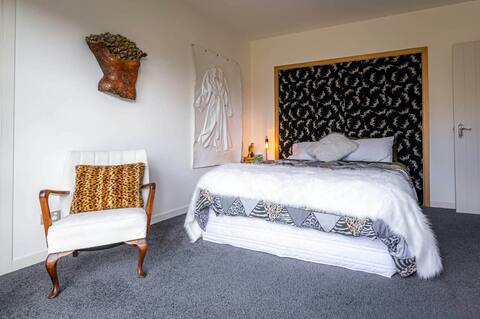
Queen Room in The Artist's House
Private Room • N/A
Note: Performance varies based on location, size, amenities, seasonality, and management quality. Data reflects the past 12 months.
Top Performing Airbnb Hosts in Luggate (2025)
Learn from the best! This table showcases top-performing Airbnb hosts in Luggate based on the number of properties managed and estimated total revenue over the past year. Analyze their scale and performance metrics.
| Host Name | Properties | Grossing Revenue | Stay Reviews | Avg Rating |
|---|---|---|---|---|
| Sonia | 3 | $85,560 | 31 | 5.00/5.0 |
| Shall | 1 | $55,416 | 70 | 4.97/5.0 |
| Ellen | 1 | $35,016 | 52 | 5.00/5.0 |
| Rachael | 1 | $32,897 | 22 | 4.91/5.0 |
| Jo | 1 | $30,358 | 5 | 5.00/5.0 |
| Rowena | 3 | $21,866 | 75 | 4.90/5.0 |
| Madeleine | 1 | $17,953 | 8 | 4.63/5.0 |
| Sandra | 1 | $14,849 | 203 | 4.94/5.0 |
| Julie | 1 | $14,160 | 19 | 5.00/5.0 |
| Abby | 1 | $12,768 | 773 | 4.78/5.0 |
Analyzing the strategies of top hosts, such as their property selection, pricing, and guest communication, can offer valuable lessons for optimizing your own Airbnb operations in Luggate.
Dive Deeper: Advanced Luggate STR Market Data (2025)
Ready to unlock more insights? AirROI provides access to advanced metrics and comprehensive Airbnb data for Luggate. Explore detailed analytics beyond this report to refine your investment strategy, optimize pricing, and maximize your vacation rental profits.
Explore Advanced MetricsLuggate Short-Term Rental Market Composition (2025): Property & Room Types
Room Type Distribution
Property Type Distribution
Market Composition Insights for Luggate
- The Luggate Airbnb market composition is heavily skewed towards Entire Home/Apt listings, which make up 84.2% of the 19 active rentals. This indicates strong guest preference for privacy and space.
- Looking at the property type distribution in Luggate, House properties are the most common (57.9%), reflecting the local real estate landscape.
- Houses represent a significant 57.9% portion, catering likely to families or larger groups.
- The presence of 21.1% Hotel/Boutique listings indicates integration with traditional hospitality.
Luggate Airbnb Room Capacity Analysis (2025): Bedroom Distribution
Distribution of Listings by Number of Bedrooms
Room Capacity Insights for Luggate
- The dominant room capacity in Luggate is 1 bedroom listings, making up 31.6% of the market. This suggests a strong demand for properties suitable for couples or solo travelers.
- Together, 1 bedroom and 3 bedrooms properties represent 57.9% of the active Airbnb listings in Luggate, indicating a high concentration in these sizes.
- A significant 42.1% of listings offer 3+ bedrooms, catering to larger groups and families seeking more space in Luggate.
Luggate Vacation Rental Guest Capacity Trends (2025)
Distribution of Listings by Guest Capacity
Guest Capacity Insights for Luggate
- The most common guest capacity trend in Luggate vacation rentals is listings accommodating 2 guests (31.6%). This suggests the primary traveler segment is likely couples or solo travelers.
- Properties designed for 2 guests and 4 guests dominate the Luggate STR market, accounting for 57.9% of listings.
- 36.8% of properties accommodate 6+ guests, serving the market segment for larger families or group travel in Luggate.
- On average, properties in Luggate are equipped to host 4.3 guests.
Luggate Airbnb Booking Patterns (2025): Available vs. Booked Days
Available Days Distribution
Booked Days Distribution
Booking Pattern Insights for Luggate
- The most common availability pattern in Luggate falls within the 271-366 days range, representing 47.4% of listings. This suggests many properties have significant open periods on their calendars.
- Approximately 84.2% of listings show high availability (181+ days open annually), indicating potential for increased bookings or specific owner usage patterns.
- For booked days, the 91-180 days range is most frequent in Luggate (36.8%), reflecting common guest stay durations or potential owner blocking patterns.
- A notable 15.8% of properties secure long booking periods (181+ days booked per year), highlighting successful long-term rental strategies or significant owner usage.
Luggate Airbnb Minimum Stay Requirements Analysis
Distribution of Listings by Minimum Night Requirement
1 Night
2 listings
10.5% of total
2 Nights
2 listings
10.5% of total
3 Nights
1 listings
5.3% of total
4-6 Nights
3 listings
15.8% of total
30+ Nights
11 listings
57.9% of total
Key Insights
- The most prevalent minimum stay requirement in Luggate is 30+ Nights, adopted by 57.9% of listings. This highlights the market's preference for longer commitments.
- A significant segment (57.9%) caters to monthly stays (30+ nights) in Luggate, pointing to opportunities in the extended-stay market.
Recommendations
- Align with the market by considering a 30+ Nights minimum stay, as 57.9% of Luggate hosts use this setting.
- If feasible, allowing 1-night stays, especially midweek or during low season, could capture last-minute bookings, as only 10.5% currently do.
- Explore offering discounts for stays of 30+ nights to attract the 57.9% of the market seeking extended stays.
- Adjust minimum nights based on seasonality – potentially shorter during low season and longer during peak demand periods in Luggate.
Luggate Airbnb Cancellation Policy Trends Analysis (2025)
Flexible
4 listings
21.1% of total
Moderate
4 listings
21.1% of total
Firm
5 listings
26.3% of total
Strict
6 listings
31.6% of total
Cancellation Policy Insights for Luggate
- The prevailing Airbnb cancellation policy trend in Luggate is Strict, used by 31.6% of listings.
- A majority (57.9%) of hosts in Luggate utilize Firm or Strict policies, indicating a market where hosts prioritize booking security.
Recommendations for Hosts
- Consider adopting a Strict policy to align with the 31.6% market standard in Luggate.
- With 31.6% using Strict terms, this is a viable option in Luggate, particularly for high-value properties or during peak demand periods.
- Regularly review your cancellation policy against competitors and market demand shifts in Luggate.
Luggate STR Booking Lead Time Analysis (2025)
Average Booking Lead Time by Month
Booking Lead Time Insights for Luggate
- The overall average booking lead time for vacation rentals in Luggate is 53 days.
- Guests book furthest in advance for stays during August (average 75 days), likely coinciding with peak travel demand or local events.
- The shortest booking windows occur for stays in May (average 26 days), indicating more last-minute travel plans during this time.
- Seasonally, Summer (69 days avg.) sees the longest lead times, while Spring (41 days avg.) has the shortest, reflecting typical travel planning cycles.
Recommendations for Hosts
- Use the overall average lead time (53 days) as a baseline for your pricing and availability strategy in Luggate.
- For August stays, consider implementing length-of-stay discounts or slightly higher rates for bookings made less than 75 days out to capitalize on advance planning.
- Target marketing efforts for the Summer season well in advance (at least 69 days) to capture early planners.
- Monitor your own booking lead times against these Luggate averages to identify opportunities for dynamic pricing adjustments.
Popular & Essential Airbnb Amenities in Luggate (2025)
Amenity Prevalence
Amenity Insights for Luggate
- Popular amenities like Heating, Free parking on premises, Hot water are common but not universal. Offering these can provide a competitive edge.
- Warning: Wifi is not universally provided but is considered essential globally. Ensure reliable Wifi is offered.
Recommendations for Hosts
- Consider adding popular differentiators like Heating or Free parking on premises to increase appeal.
- Highlight unique or less common amenities you offer (e.g., hot tub, dedicated workspace, EV charger) in your listing description and photos.
- Regularly check competitor amenities in Luggate to stay competitive.
Luggate Airbnb Guest Demographics & Profile Analysis (2025)
Guest Profile Summary for Luggate
- The typical guest profile for Airbnb in Luggate consists of predominantly international visitors (71%), with top international origins including Australia, typically belonging to the Post-2000s (Gen Z/Alpha) group (50%), primarily speaking English or French.
- Domestic travelers account for 28.6% of guests.
- Key international markets include New Zealand (28.6%) and Australia (16.4%).
- Top languages spoken are English (58.9%) followed by French (8.4%).
- A significant demographic segment is the Post-2000s (Gen Z/Alpha) group, representing 50% of guests.
Recommendations for Hosts
- Focus marketing internationally, particularly towards travelers from Australia.
- Tailor amenities and listing descriptions to appeal to the dominant Post-2000s (Gen Z/Alpha) demographic (e.g., highlight fast WiFi, smart home features, local guides).
- Highlight unique local experiences or amenities relevant to the primary guest profile.
- Consider seasonal promotions aligned with peak travel times for key origin markets.
Nearby Short-Term Rental Market Comparison
How does the Luggate Airbnb market stack up against its neighbors? Compare key performance metrics like average monthly revenue, ADR, and occupancy rates in surrounding areas to understand the broader regional STR landscape.
| Market | Active Properties | Monthly Revenue | Daily Rate | Avg. Occupancy |
|---|---|---|---|---|
| Lake Tekapo | 402 | $5,312 | $291.11 | 61% |
| Ben Ohau | 11 | $4,977 | $220.59 | 72% |
| Queenstown | 2,229 | $4,976 | $357.69 | 55% |
| Speargrass Flat | 12 | $4,762 | $559.27 | 53% |
| Dalefield | 11 | $3,918 | $378.30 | 44% |
| Franz Josef Glacier | 23 | $3,840 | $202.04 | 64% |
| Kawarau Falls | 22 | $3,559 | $566.40 | 44% |
| Franz Josef | 34 | $3,394 | $235.89 | 49% |
| Arrow Junction | 19 | $3,347 | $302.25 | 50% |
| Millbrook | 23 | $3,157 | $370.63 | 38% |