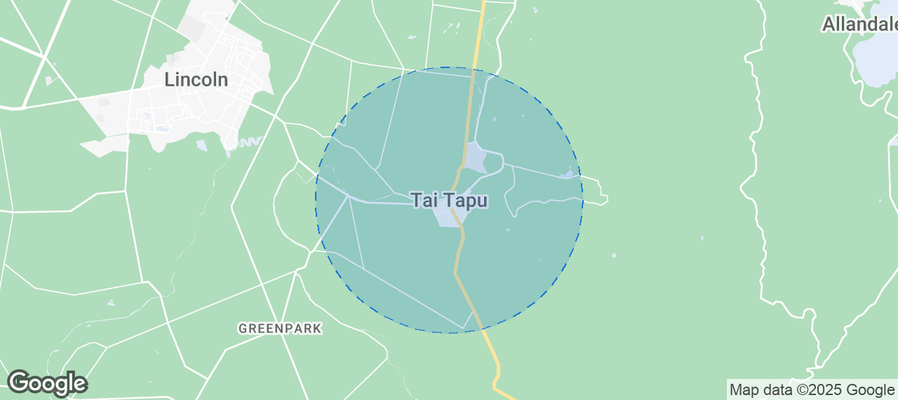
Tai Tapu Airbnb Market Analysis 2026: Short Term Rental Data & Vacation Rental Statistics in Canterbury, New Zealand
Is Airbnb profitable in Tai Tapu in 2026? Explore comprehensive Airbnb analytics for Tai Tapu, Canterbury, New Zealand to uncover income potential. This 2026 STR market report for Tai Tapu, based on AirROI data from February 2025 to January 2026, reveals key trends in the niche market of 19 active listings.
Whether you're considering an Airbnb investment in Tai Tapu, optimizing your existing vacation rental, or exploring rental arbitrage opportunities, understanding the Tai Tapu Airbnb data is crucial. Leveraging the low regulation environment is key to maximizing your short term rental income potential. Let's dive into the specifics.
Key Tai Tapu Airbnb Performance Metrics Overview
Monthly Airbnb Revenue Variations & Income Potential in Tai Tapu (2026)
Understanding the monthly revenue variations for Airbnb listings in Tai Tapu is key to maximizing your short term rental income potential. Seasonality significantly impacts earnings. Our analysis, based on data from the past 12 months, shows that the peak revenue month for STRs in Tai Tapu is typically February, while March often presents the lowest earnings, highlighting opportunities for strategic pricing adjustments during shoulder and low seasons. Explore the typical Airbnb income in Tai Tapu across different performance tiers:
- Best-in-class properties (Top 10%) achieve $2,870+ monthly, often utilizing dynamic pricing and superior guest experiences.
- Strong performing properties (Top 25%) earn $1,917 or more, indicating effective management and desirable locations/amenities.
- Typical properties (Median) generate around $1,161 per month, representing the average market performance.
- Entry-level properties (Bottom 25%) see earnings around $633, often with potential for optimization.
Average Monthly Airbnb Earnings Trend in Tai Tapu
Tai Tapu Airbnb Occupancy Rate Trends (2026)
Maximize your bookings by understanding the Tai Tapu STR occupancy trends. Seasonal demand shifts significantly influence how often properties are booked. Typically, Februarysees the highest demand (peak season occupancy), while June experiences the lowest (low season). Effective strategies, like adjusting minimum stays or offering promotions, can boost occupancy during slower periods. Here's how different property tiers perform in Tai Tapu:
- Best-in-class properties (Top 10%) achieve 75%+ occupancy, indicating high desirability and potentially optimized availability.
- Strong performing properties (Top 25%) maintain 58% or higher occupancy, suggesting good market fit and guest satisfaction.
- Typical properties (Median) have an occupancy rate around 34%.
- Entry-level properties (Bottom 25%) average 17% occupancy, potentially facing higher vacancy.
Average Monthly Occupancy Rate Trend in Tai Tapu
Average Daily Rate (ADR) Airbnb Trends in Tai Tapu (2026)
Effective short term rental pricing strategy in Tai Tapu involves understanding monthly ADR fluctuations. The Average Daily Rate (ADR) for Airbnb in Tai Tapu typically peaks in November and dips lowest during February. Leveraging Airbnb dynamic pricing tools or strategies based on this seasonality can significantly boost revenue. Here's a look at the typical nightly rates achieved:
- Best-in-class properties (Top 10%) command rates of $165+ per night, often due to premium features or locations.
- Strong performing properties (Top 25%) achieve nightly rates of $131 or more.
- Typical properties (Median) charge around $101 per night.
- Entry-level properties (Bottom 25%) earn around $71 per night.
Average Daily Rate (ADR) Trend by Month in Tai Tapu
Get Live Tai Tapu Market Intelligence 👇
Explore Real-time Analytics
Airbnb Seasonality Analysis & Trends in Tai Tapu (2026)
Peak Season (February, September, August)
- Revenue averages $1,830 per month
- Occupancy rates average 48.3%
- Daily rates average $124
Shoulder Season
- Revenue averages $1,489 per month
- Occupancy maintains around 38.9%
- Daily rates hold near $131
Low Season (March, April, July)
- Revenue drops to average $1,014 per month
- Occupancy decreases to average 32.1%
- Daily rates adjust to average $116
Seasonality Insights for Tai Tapu
- The Airbnb seasonality in Tai Tapu shows moderate seasonality with distinct peak and low periods. While the sections above show seasonal averages, it's also insightful to look at the extremes:
- During the high season, the absolute peak month showcases Tai Tapu's highest earning potential, with monthly revenues capable of climbing to $1,881, occupancy reaching a high of 57.3%, and ADRs peaking at $138.
- Conversely, the slowest single month of the year, typically falling within the low season, marks the market's lowest point. In this month, revenue might dip to $886, occupancy could drop to 30.0%, and ADRs may adjust down to $113.
- Understanding both the seasonal averages and these monthly peaks and troughs in revenue, occupancy, and ADR is crucial for maximizing your Airbnb profit potential in Tai Tapu.
Seasonal Strategies for Maximizing Profit
- Peak Season: Maximize revenue through premium pricing and potentially longer minimum stays. Ensure high availability.
- Low Season: Offer competitive pricing, special promotions (e.g., extended stay discounts), and flexible cancellation policies. Target off-season travelers like remote workers or budget-conscious guests.
- Shoulder Seasons: Implement dynamic pricing that balances peak and low rates. Target weekend travelers or specific events. Offer slightly more flexible terms than peak season.
- Regularly analyze your own performance against these Tai Tapu seasonality benchmarks and adjust your pricing and availability strategy accordingly.
Best Areas for Airbnb Investment in Tai Tapu (2026)
Exploring the top neighborhoods for short-term rentals in Tai Tapu? This section highlights key areas, outlining why they are attractive for hosts and guests, along with notable local attractions. Consider these locations based on your target guest profile and investment strategy.
| Neighborhood / Area | Why Host Here? (Target Guests & Appeal) | Key Attractions & Landmarks |
|---|---|---|
| Tai Tapu Village | A charming small village atmosphere with a close-knit community, Tai Tapu is appealing for guests looking for a quiet retreat near Christchurch. It's perfect for families and couples seeking relaxation and the beauty of the New Zealand countryside. | Tai Tapu Domain, Local cafes and shops, Scenic walks, Close proximity to Christchurch |
| Birdlings Flat | A beachside location known for its beautiful coastline and natural scenery. Birdlings Flat attracts nature lovers and offers a unique escape for visitors looking to explore the local beaches and outdoors. | Birdlings Flat Beach, Fishing spots, Local wildlife observations, Beach walks |
| Governor's Bay | Known for its stunning views over Lyttelton Harbour, Governor's Bay offers a picturesque setting for tourists. It's a great spot for exploring the nearby hills and enjoying the local wine bars. | Lyttelton Harbour views, Governor's Bay Hotel, Walking trails, Local vineyards |
| Cashmere | An upscale suburb with beautiful hills and parks. Cashmere is ideal for those wanting to experience a more suburban environment while still being close to the amenities of Christchurch city. | Cashmere Hills, Local parks, Christchurch Adventure Park, Scenic drives |
| Halswell | A growing suburb that offers family-friendly attractions and green spaces. Halswell is appealing due to its parks and easy access to the city while providing a suburban feel. | Halswell Quarry Park, Local cafes, Sports facilities, Community events |
| Lyttelton | A vibrant port town with a rich history and lively atmosphere. Lyttelton is sought after by travelers wanting culture, local markets, and stunning views of the harbour. | Lyttelton Farmers Market, Chinese Garden, Local shops and cafes, Harbour hikes |
| Little River | A rural area that provides a peaceful escape filled with scenic views and outdoor activities. Ideal for guests who enjoy tranquility and exploring the nearby lakes and hills. | Little River Rail Trail, Birdwatching, Local art galleries, Stunning landscapes |
| Gemmel's Bush | A hidden gem for nature enthusiasts, offering walking trails and beautiful landscapes. Ideal for those seeking solitude and the beauty of New Zealand's natural environment. | Hiking trails, Native bush, Stunning views, Outdoor photography opportunities |
Understanding Airbnb License Requirements & STR Laws in Tai Tapu (2026)
While Tai Tapu, Canterbury, New Zealand currently shows low STR regulations, specific Airbnb license requirements might still exist or change. Always verify the latest short term rental regulations and Airbnb license requirements directly with local government authorities for Tai Tapu to ensure full compliance before hosting.
(Source: AirROI data, 2026, finding no licensed listings among those analyzed)
Top Performing Airbnb Properties in Tai Tapu (2026)
Benchmark your potential! Explore examples of top-performing Airbnb properties in Tai Tapubased on Trailing Twelve Month (TTM) revenue. Analyze their characteristics, revenue, occupancy rate, and ADR to understand what drives success in this market.

Hampstead Heights
Entire Place • 4 bedrooms

Birdsong View - includes breakfast
Entire Place • 1 bedroom

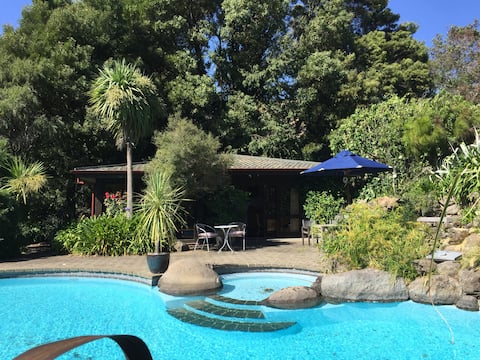
Romantic Country Cottage | Farm Animals & Birdsong
Entire Place • 2 bedrooms
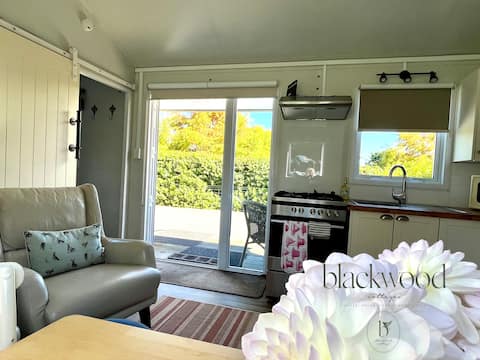
Blackbird Cottage-Country Comfort, Birdsong & Pigs
Entire Place • 1 bedroom

Mangels
Entire Place • 3 bedrooms
Secluded Tranquil Country studio 15km Christchurch
Entire Place • 1 bedroom
Note: Performance varies based on location, size, amenities, seasonality, and management quality. Data reflects the past 12 months.
Top Performing Airbnb Hosts in Tai Tapu (2026)
Learn from the best! This table showcases top-performing Airbnb hosts in Tai Tapu based on the number of properties managed and estimated total revenue over the past year. Analyze their scale and performance metrics.
| Host Name | Properties | Grossing Revenue | Stay Reviews | Avg Rating |
|---|---|---|---|---|
| Liz | 1 | $44,206 | 4 | 5.00/5.0 |
| Blackwood Common | 2 | $43,440 | 294 | 4.97/5.0 |
| Teunis | 1 | $23,754 | 443 | 4.98/5.0 |
| The Red Barns | 3 | $22,589 | 36 | 5.00/5.0 |
| Helen | 2 | $18,909 | 74 | 4.92/5.0 |
| Julia | 1 | $17,350 | 813 | 4.80/5.0 |
| Odette | 1 | $15,952 | 112 | 4.83/5.0 |
| Mayie, Judi And Karen At Booka | 1 | $14,052 | 24 | 4.88/5.0 |
| Guppy | 2 | $11,457 | 189 | 4.80/5.0 |
| Lindsey | 1 | $11,402 | 179 | 4.76/5.0 |
Analyzing the strategies of top hosts, such as their property selection, pricing, and guest communication, can offer valuable lessons for optimizing your own Airbnb operations in Tai Tapu.
Dive Deeper: Advanced Tai Tapu STR Market Data (2026)
Ready to unlock more insights? AirROI provides access to advanced metrics and comprehensive Airbnb data for Tai Tapu. Explore detailed analytics beyond this report to refine your investment strategy, optimize pricing, and maximize your vacation rental profits.
Explore Advanced MetricsTai Tapu Short-Term Rental Market Composition (2026): Property & Room Types
Room Type Distribution
Property Type Distribution
Market Composition Insights for Tai Tapu
- The Tai Tapu Airbnb market composition is heavily skewed towards Entire Home/Apt listings, which make up 94.7% of the 19 active rentals. This indicates strong guest preference for privacy and space.
- Looking at the property type distribution in Tai Tapu, House properties are the most common (36.8%), reflecting the local real estate landscape.
- Houses represent a significant 36.8% portion, catering likely to families or larger groups.
- The presence of 5.3% Hotel/Boutique listings indicates integration with traditional hospitality.
Tai Tapu Airbnb Room Capacity Analysis (2026): Bedroom Distribution
Distribution of Listings by Number of Bedrooms
Room Capacity Insights for Tai Tapu
- The dominant room capacity in Tai Tapu is 1 bedroom listings, making up 52.6% of the market. This suggests a strong demand for properties suitable for couples or solo travelers.
- Together, 1 bedroom and 2 bedrooms properties represent 73.7% of the active Airbnb listings in Tai Tapu, indicating a high concentration in these sizes.
- With over half the market (52.6%) consisting of studios or 1-bedroom units, Tai Tapu is particularly well-suited for individuals or couples.
- A significant 26.4% of listings offer 3+ bedrooms, catering to larger groups and families seeking more space in Tai Tapu.
Tai Tapu Vacation Rental Guest Capacity Trends (2026)
Distribution of Listings by Guest Capacity
Guest Capacity Insights for Tai Tapu
- The most common guest capacity trend in Tai Tapu vacation rentals is listings accommodating 2 guests (42.1%). This suggests the primary traveler segment is likely couples or solo travelers.
- Properties designed for 2 guests and 4 guests dominate the Tai Tapu STR market, accounting for 57.9% of listings.
- A significant 42.1% of listings cater specifically to 1-2 guests, highlighting strong demand from couples and solo travelers in Tai Tapu.
- 26.3% of properties accommodate 6+ guests, serving the market segment for larger families or group travel in Tai Tapu.
- On average, properties in Tai Tapu are equipped to host 3.9 guests.
Tai Tapu Airbnb Booking Patterns (2026): Available vs. Booked Days
Available Days Distribution
Booked Days Distribution
Booking Pattern Insights for Tai Tapu
- The most common availability pattern in Tai Tapu falls within the 181-270 days range, representing 42.1% of listings. This suggests many properties have significant open periods on their calendars.
- Approximately 84.2% of listings show high availability (181+ days open annually), indicating potential for increased bookings or specific owner usage patterns.
- For booked days, the 31-90 days range is most frequent in Tai Tapu (42.1%), reflecting common guest stay durations or potential owner blocking patterns.
- A notable 15.8% of properties secure long booking periods (181+ days booked per year), highlighting successful long-term rental strategies or significant owner usage.
Tai Tapu Airbnb Minimum Stay Requirements Analysis
Distribution of Listings by Minimum Night Requirement
1 Night
13 listings
68.4% of total
2 Nights
2 listings
10.5% of total
3 Nights
1 listings
5.3% of total
30+ Nights
3 listings
15.8% of total
Key Insights
- The most prevalent minimum stay requirement in Tai Tapu is 1 Night, adopted by 68.4% of listings. This highlights the market's preference for shorter, flexible bookings.
- A strong majority (78.9%) of the Tai Tapu Airbnb data shows acceptance of very short stays (1-2 nights), indicating a dynamic, high-turnover market.
- A significant segment (15.8%) caters to monthly stays (30+ nights) in Tai Tapu, pointing to opportunities in the extended-stay market.
Recommendations
- Align with the market by considering a 1 Night minimum stay, as 68.4% of Tai Tapu hosts use this setting.
- Explore offering discounts for stays of 30+ nights to attract the 15.8% of the market seeking extended stays.
- Adjust minimum nights based on seasonality – potentially shorter during low season and longer during peak demand periods in Tai Tapu.
Tai Tapu Airbnb Cancellation Policy Trends Analysis (2026)
Limited
1 listings
5.3% of total
Flexible
10 listings
52.6% of total
Moderate
7 listings
36.8% of total
Firm
1 listings
5.3% of total
Cancellation Policy Insights for Tai Tapu
- The prevailing Airbnb cancellation policy trend in Tai Tapu is Flexible, used by 52.6% of listings.
- The market strongly favors guest-friendly terms, with 89.4% of listings offering Flexible or Moderate policies. This suggests guests in Tai Tapu may expect booking flexibility.
Recommendations for Hosts
- Consider adopting a Flexible policy to align with the 52.6% market standard in Tai Tapu.
- Given the high prevalence of Flexible policies (52.6%), offering this can enhance booking appeal, especially during shoulder seasons.
- Regularly review your cancellation policy against competitors and market demand shifts in Tai Tapu.
Tai Tapu STR Booking Lead Time Analysis (2026)
Average Booking Lead Time by Month
Booking Lead Time Insights for Tai Tapu
- The overall average booking lead time for vacation rentals in Tai Tapu is 72 days.
- Guests book furthest in advance for stays during December (average 93 days), likely coinciding with peak travel demand or local events.
- The shortest booking windows occur for stays in June (average 28 days), indicating more last-minute travel plans during this time.
- Seasonally, Winter (74 days avg.) sees the longest lead times, while Summer (45 days avg.) has the shortest, reflecting typical travel planning cycles.
Recommendations for Hosts
- Use the overall average lead time (72 days) as a baseline for your pricing and availability strategy in Tai Tapu.
- For December stays, consider implementing length-of-stay discounts or slightly higher rates for bookings made less than 93 days out to capitalize on advance planning.
- Target marketing efforts for the Winter season well in advance (at least 74 days) to capture early planners.
- Monitor your own booking lead times against these Tai Tapu averages to identify opportunities for dynamic pricing adjustments.
Popular & Essential Airbnb Amenities in Tai Tapu (2026)
Amenity Prevalence
Amenity Insights for Tai Tapu
- Popular amenities like Dishes and silverware, Wifi, Refrigerator are common but not universal. Offering these can provide a competitive edge.
- Warning: Wifi is not universally provided but is considered essential globally. Ensure reliable Wifi is offered.
Recommendations for Hosts
- Consider adding popular differentiators like Dishes and silverware or Wifi to increase appeal.
- Highlight unique or less common amenities you offer (e.g., hot tub, dedicated workspace, EV charger) in your listing description and photos.
- Regularly check competitor amenities in Tai Tapu to stay competitive.
Tai Tapu Airbnb Guest Demographics & Profile Analysis (2026)
Guest Profile Summary for Tai Tapu
- The typical guest profile for Airbnb in Tai Tapu consists of a mix of domestic (64%) and international guests, often arriving from nearby Christchurch, typically belonging to the Post-2000s (Gen Z/Alpha) group (50%), primarily speaking English or Chinese.
- Domestic travelers account for 64.1% of guests.
- Key international markets include New Zealand (64.1%) and Australia (10.9%).
- Top languages spoken are English (63.6%) followed by Chinese (6.4%).
- A significant demographic segment is the Post-2000s (Gen Z/Alpha) group, representing 50% of guests.
Recommendations for Hosts
- Target domestic marketing efforts towards travelers from Christchurch and Auckland.
- Tailor amenities and listing descriptions to appeal to the dominant Post-2000s (Gen Z/Alpha) demographic (e.g., highlight fast WiFi, smart home features, local guides).
- Highlight unique local experiences or amenities relevant to the primary guest profile.
- Consider seasonal promotions aligned with peak travel times for key origin markets.
Nearby Short-Term Rental Market Comparison
How does the Tai Tapu Airbnb market stack up against its neighbors? Compare key performance metrics like average monthly revenue, ADR, and occupancy rates in surrounding areas to understand the broader regional STR landscape.
| Market | Active Properties | Monthly Revenue | Daily Rate | Avg. Occupancy |
|---|---|---|---|---|
| Canterbury | 12 | $3,002 | $233.67 | 42% |
| Prebbleton | 20 | $2,435 | $165.91 | 53% |
| Castle Hill Village | 16 | $2,294 | $182.78 | 44% |
| Punakaiki | 31 | $1,919 | $154.84 | 43% |
| Hanmer Springs | 274 | $1,873 | $257.36 | 30% |
| Fox River | 13 | $1,865 | $118.88 | 56% |
| Kaikōura | 282 | $1,852 | $191.41 | 40% |
| Waipara | 11 | $1,811 | $247.77 | 31% |
| Kaniere | 10 | $1,760 | $124.51 | 48% |
| Windwhistle | 14 | $1,683 | $186.51 | 38% |