Hanmer Springs Airbnb Market Analysis 2026: Short Term Rental Data & Vacation Rental Statistics in Canterbury, New Zealand
Is Airbnb profitable in Hanmer Springs in 2026? Explore comprehensive Airbnb analytics for Hanmer Springs, Canterbury, New Zealand to uncover income potential. This 2026 STR market report for Hanmer Springs, based on AirROI data from February 2025 to January 2026, reveals key trends in the market of 274 active listings.
Whether you're considering an Airbnb investment in Hanmer Springs, optimizing your existing vacation rental, or exploring rental arbitrage opportunities, understanding the Hanmer Springs Airbnb data is crucial. Leveraging the low regulation environment is key to maximizing your short term rental income potential. Let's dive into the specifics.
Key Hanmer Springs Airbnb Performance Metrics Overview
Monthly Airbnb Revenue Variations & Income Potential in Hanmer Springs (2026)
Understanding the monthly revenue variations for Airbnb listings in Hanmer Springs is key to maximizing your short term rental income potential. Seasonality significantly impacts earnings. Our analysis, based on data from the past 12 months, shows that the peak revenue month for STRs in Hanmer Springs is typically April, while June often presents the lowest earnings, highlighting opportunities for strategic pricing adjustments during shoulder and low seasons. Explore the typical Airbnb income in Hanmer Springs across different performance tiers:
- Best-in-class properties (Top 10%) achieve $4,439+ monthly, often utilizing dynamic pricing and superior guest experiences.
- Strong performing properties (Top 25%) earn $2,967 or more, indicating effective management and desirable locations/amenities.
- Typical properties (Median) generate around $1,973 per month, representing the average market performance.
- Entry-level properties (Bottom 25%) see earnings around $1,082, often with potential for optimization.
Average Monthly Airbnb Earnings Trend in Hanmer Springs
Hanmer Springs Airbnb Occupancy Rate Trends (2026)
Maximize your bookings by understanding the Hanmer Springs STR occupancy trends. Seasonal demand shifts significantly influence how often properties are booked. Typically, Aprilsees the highest demand (peak season occupancy), while May experiences the lowest (low season). Effective strategies, like adjusting minimum stays or offering promotions, can boost occupancy during slower periods. Here's how different property tiers perform in Hanmer Springs:
- Best-in-class properties (Top 10%) achieve 64%+ occupancy, indicating high desirability and potentially optimized availability.
- Strong performing properties (Top 25%) maintain 46% or higher occupancy, suggesting good market fit and guest satisfaction.
- Typical properties (Median) have an occupancy rate around 28%.
- Entry-level properties (Bottom 25%) average 15% occupancy, potentially facing higher vacancy.
Average Monthly Occupancy Rate Trend in Hanmer Springs
Average Daily Rate (ADR) Airbnb Trends in Hanmer Springs (2026)
Effective short term rental pricing strategy in Hanmer Springs involves understanding monthly ADR fluctuations. The Average Daily Rate (ADR) for Airbnb in Hanmer Springs typically peaks in January and dips lowest during October. Leveraging Airbnb dynamic pricing tools or strategies based on this seasonality can significantly boost revenue. Here's a look at the typical nightly rates achieved:
- Best-in-class properties (Top 10%) command rates of $397+ per night, often due to premium features or locations.
- Strong performing properties (Top 25%) achieve nightly rates of $325 or more.
- Typical properties (Median) charge around $256 per night.
- Entry-level properties (Bottom 25%) earn around $169 per night.
Average Daily Rate (ADR) Trend by Month in Hanmer Springs
Get Live Hanmer Springs Market Intelligence 👇

Explore Real-time Analytics
Airbnb Seasonality Analysis & Trends in Hanmer Springs (2026)
Peak Season (April, July, January)
- Revenue averages $2,710 per month
- Occupancy rates average 37.4%
- Daily rates average $262
Shoulder Season
- Revenue averages $2,244 per month
- Occupancy maintains around 32.1%
- Daily rates hold near $255
Low Season (May, June, September)
- Revenue drops to average $1,962 per month
- Occupancy decreases to average 27.7%
- Daily rates adjust to average $258
Seasonality Insights for Hanmer Springs
- The Airbnb seasonality in Hanmer Springs shows moderate seasonality with distinct peak and low periods. While the sections above show seasonal averages, it's also insightful to look at the extremes:
- During the high season, the absolute peak month showcases Hanmer Springs's highest earning potential, with monthly revenues capable of climbing to $3,001, occupancy reaching a high of 41.7%, and ADRs peaking at $269.
- Conversely, the slowest single month of the year, typically falling within the low season, marks the market's lowest point. In this month, revenue might dip to $1,896, occupancy could drop to 25.9%, and ADRs may adjust down to $249.
- Understanding both the seasonal averages and these monthly peaks and troughs in revenue, occupancy, and ADR is crucial for maximizing your Airbnb profit potential in Hanmer Springs.
Seasonal Strategies for Maximizing Profit
- Peak Season: Maximize revenue through premium pricing and potentially longer minimum stays. Ensure high availability.
- Low Season: Offer competitive pricing, special promotions (e.g., extended stay discounts), and flexible cancellation policies. Target off-season travelers like remote workers or budget-conscious guests.
- Shoulder Seasons: Implement dynamic pricing that balances peak and low rates. Target weekend travelers or specific events. Offer slightly more flexible terms than peak season.
- Regularly analyze your own performance against these Hanmer Springs seasonality benchmarks and adjust your pricing and availability strategy accordingly.
Best Areas for Airbnb Investment in Hanmer Springs (2026)
Exploring the top neighborhoods for short-term rentals in Hanmer Springs? This section highlights key areas, outlining why they are attractive for hosts and guests, along with notable local attractions. Consider these locations based on your target guest profile and investment strategy.
| Neighborhood / Area | Why Host Here? (Target Guests & Appeal) | Key Attractions & Landmarks |
|---|---|---|
| Hanmer Springs Village | The central hub of Hanmer Springs, known for its famous thermal pools and spa facilities. It attracts tourists looking for relaxation and wellness in a picturesque alpine setting. | Hanmer Springs Thermal Pools & Spa, Conical Hill, Hanmer Forest, Mountain Biking Trails, Hot Air Ballooning |
| Queen Mary Drive | A scenic drive that offers beautiful views of the surrounding mountains and access to various outdoor activities. Popular among tourists looking for adventure and photography opportunities. | Hanmer Springs Golf Course, The Majuba Walkway, Mountain Biking Tracks, Scenic Lookouts |
| Hanmer Forest | A beautiful forest area ideal for hiking, biking, and outdoor adventures. Attracts nature lovers and adventure seekers looking to explore the outdoors. | Hanmer Forest Park, Walking and Biking Trails, Picnic Areas, Scenic Lookouts |
| Amuri Avenue | Close to the main attractions and amenities, offering a blend of local charm and convenience. Great for visitors wanting easy access to shops and restaurants. | Local Cafes and Restaurants, Shopping Area, Spa Treatments |
| Chisholm Park | A family-friendly park with ample green space, picnic areas, and children's play equipment. Ideal for family travelers looking for a relaxing environment. | Public Gardens, Playground, Walking Trails |
| The Mule Track | This track provides stunning views and is popular for hiking and mountain biking, appealing to outdoor enthusiasts. | Hiking Trails, Mountain Biking Opportunities, Scenic Views |
| Marble Point | A tranquil area near down to the Waiau River, known for its scenic beauty and outdoor activities like fishing and rafting. Perfect for visitors who love nature and water sports. | Waiau River, Fishing, Rafting, Scenic Picnic Spots |
| Lake Sumner Road | A rural area that offers access to beautiful lakes and bush walks, attracting travelers seeking peace and outdoor exploration. | Lake Sumner, Bush Walking Tracks, Wildlife Spotting |
Understanding Airbnb License Requirements & STR Laws in Hanmer Springs (2026)
While Hanmer Springs, Canterbury, New Zealand currently shows low STR regulations, specific Airbnb license requirements might still exist or change. Always verify the latest short term rental regulations and Airbnb license requirements directly with local government authorities for Hanmer Springs to ensure full compliance before hosting.
(Source: AirROI data, 2026, finding no licensed listings among those analyzed)
Top Performing Airbnb Properties in Hanmer Springs (2026)
Benchmark your potential! Explore examples of top-performing Airbnb properties in Hanmer Springsbased on Trailing Twelve Month (TTM) revenue. Analyze their characteristics, revenue, occupancy rate, and ADR to understand what drives success in this market.
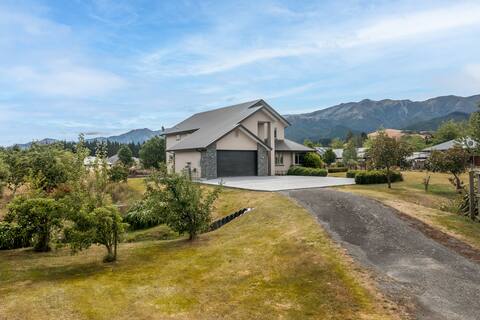
A holiday spot not to be missed!
Entire Place • 5 bedrooms
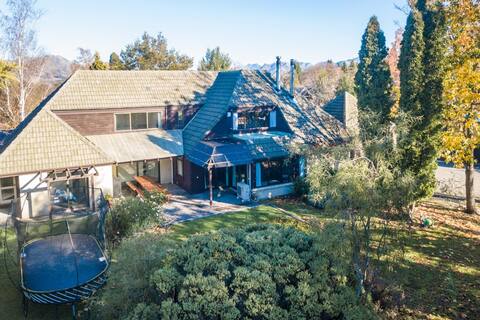
Fantastic Family 6-bedroom Home
Entire Place • 6 bedrooms

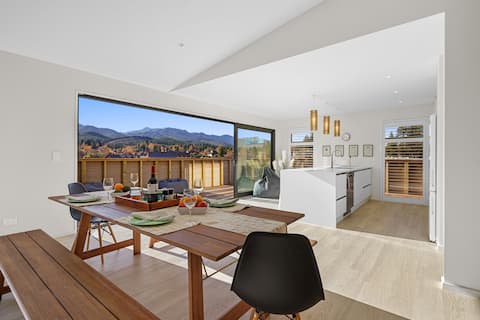
Scandinavian Luxury Lodge.
Entire Place • 4 bedrooms

Views and space for large groups - Hanmer
Entire Place • 5 bedrooms
At Work Hour
Entire Place • 4 bedrooms

Peaceful Cottage | 5 mins to Pools | Games Room
Entire Place • 3 bedrooms
Note: Performance varies based on location, size, amenities, seasonality, and management quality. Data reflects the past 12 months.
Top Performing Airbnb Hosts in Hanmer Springs (2026)
Learn from the best! This table showcases top-performing Airbnb hosts in Hanmer Springs based on the number of properties managed and estimated total revenue over the past year. Analyze their scale and performance metrics.
| Host Name | Properties | Grossing Revenue | Stay Reviews | Avg Rating |
|---|---|---|---|---|
| Hanmer Holiday Homes | 128 | $2,839,383 | 1395 | 4.51/5.0 |
| Petra | 41 | $967,564 | 925 | 4.87/5.0 |
| Jane | 2 | $114,606 | 577 | 4.96/5.0 |
| Maree | 3 | $97,985 | 506 | 4.92/5.0 |
| Adela | 3 | $92,028 | 402 | 4.90/5.0 |
| Tony | 2 | $88,113 | 58 | 5.00/5.0 |
| Chris | 2 | $75,859 | 832 | 4.85/5.0 |
| Yoko And Tristan | 5 | $71,534 | 1088 | 4.89/5.0 |
| Carol | 1 | $70,404 | 79 | 4.82/5.0 |
| Ryan And Ania | 1 | $69,297 | 274 | 5.00/5.0 |
Analyzing the strategies of top hosts, such as their property selection, pricing, and guest communication, can offer valuable lessons for optimizing your own Airbnb operations in Hanmer Springs.
Dive Deeper: Advanced Hanmer Springs STR Market Data (2026)
Ready to unlock more insights? AirROI provides access to advanced metrics and comprehensive Airbnb data for Hanmer Springs. Explore detailed analytics beyond this report to refine your investment strategy, optimize pricing, and maximize your vacation rental profits.
Explore Advanced MetricsHanmer Springs Short-Term Rental Market Composition (2026): Property & Room Types
Room Type Distribution
Property Type Distribution
Market Composition Insights for Hanmer Springs
- The Hanmer Springs Airbnb market composition is heavily skewed towards Entire Home/Apt listings, which make up 96% of the 274 active rentals. This indicates strong guest preference for privacy and space.
- Looking at the property type distribution in Hanmer Springs, House properties are the most common (86.9%), reflecting the local real estate landscape.
- Houses represent a significant 86.9% portion, catering likely to families or larger groups.
- Smaller segments like hotel/boutique, others, unique stays (combined 6.2%) offer potential for unique stay experiences.
Hanmer Springs Airbnb Room Capacity Analysis (2026): Bedroom Distribution
Distribution of Listings by Number of Bedrooms
Room Capacity Insights for Hanmer Springs
- The dominant room capacity in Hanmer Springs is 3 bedrooms listings, making up 47.4% of the market. This suggests a strong demand for properties suitable for families or small groups.
- Together, 3 bedrooms and 4 bedrooms properties represent 68.6% of the active Airbnb listings in Hanmer Springs, indicating a high concentration in these sizes.
- A significant 74.1% of listings offer 3+ bedrooms, catering to larger groups and families seeking more space in Hanmer Springs.
Hanmer Springs Vacation Rental Guest Capacity Trends (2026)
Distribution of Listings by Guest Capacity
Guest Capacity Insights for Hanmer Springs
- The most common guest capacity trend in Hanmer Springs vacation rentals is listings accommodating 8+ guests (38.7%). This suggests the primary traveler segment is likely larger groups.
- Properties designed for 8+ guests and 6 guests dominate the Hanmer Springs STR market, accounting for 64.6% of listings.
- 76.6% of properties accommodate 6+ guests, serving the market segment for larger families or group travel in Hanmer Springs.
- On average, properties in Hanmer Springs are equipped to host 6.2 guests.
Hanmer Springs Airbnb Booking Patterns (2026): Available vs. Booked Days
Available Days Distribution
Booked Days Distribution
Booking Pattern Insights for Hanmer Springs
- The most common availability pattern in Hanmer Springs falls within the 271-366 days range, representing 58.4% of listings. This suggests many properties have significant open periods on their calendars.
- Approximately 86.1% of listings show high availability (181+ days open annually), indicating potential for increased bookings or specific owner usage patterns.
- For booked days, the 31-90 days range is most frequent in Hanmer Springs (39.8%), reflecting common guest stay durations or potential owner blocking patterns.
- A notable 14.3% of properties secure long booking periods (181+ days booked per year), highlighting successful long-term rental strategies or significant owner usage.
Hanmer Springs Airbnb Minimum Stay Requirements Analysis
Distribution of Listings by Minimum Night Requirement
1 Night
64 listings
23.4% of total
2 Nights
66 listings
24.1% of total
30+ Nights
144 listings
52.6% of total
Key Insights
- The most prevalent minimum stay requirement in Hanmer Springs is 30+ Nights, adopted by 52.6% of listings. This highlights the market's preference for longer commitments.
- A significant segment (52.6%) caters to monthly stays (30+ nights) in Hanmer Springs, pointing to opportunities in the extended-stay market.
Recommendations
- Align with the market by considering a 30+ Nights minimum stay, as 52.6% of Hanmer Springs hosts use this setting.
- If feasible, allowing 1-night stays, especially midweek or during low season, could capture last-minute bookings, as only 23.4% currently do.
- Explore offering discounts for stays of 30+ nights to attract the 52.6% of the market seeking extended stays.
- Adjust minimum nights based on seasonality – potentially shorter during low season and longer during peak demand periods in Hanmer Springs.
Hanmer Springs Airbnb Cancellation Policy Trends Analysis (2026)
Super Strict 30 Days
5 listings
1.8% of total
Limited
12 listings
4.4% of total
Flexible
36 listings
13.2% of total
Moderate
31 listings
11.4% of total
Firm
160 listings
58.8% of total
Strict
28 listings
10.3% of total
Cancellation Policy Insights for Hanmer Springs
- The prevailing Airbnb cancellation policy trend in Hanmer Springs is Firm, used by 58.8% of listings.
- A majority (69.1%) of hosts in Hanmer Springs utilize Firm or Strict policies, indicating a market where hosts prioritize booking security.
Recommendations for Hosts
- Consider adopting a Firm policy to align with the 58.8% market standard in Hanmer Springs.
- Using a Strict policy might deter some guests, as only 10.3% of listings use it. Evaluate if potential revenue protection outweighs possible lower booking rates.
- Regularly review your cancellation policy against competitors and market demand shifts in Hanmer Springs.
Hanmer Springs STR Booking Lead Time Analysis (2026)
Average Booking Lead Time by Month
Booking Lead Time Insights for Hanmer Springs
- The overall average booking lead time for vacation rentals in Hanmer Springs is 75 days.
- Guests book furthest in advance for stays during April (average 96 days), likely coinciding with peak travel demand or local events.
- The shortest booking windows occur for stays in July (average 53 days), indicating more last-minute travel plans during this time.
- Seasonally, Spring (86 days avg.) sees the longest lead times, while Summer (60 days avg.) has the shortest, reflecting typical travel planning cycles.
Recommendations for Hosts
- Use the overall average lead time (75 days) as a baseline for your pricing and availability strategy in Hanmer Springs.
- For April stays, consider implementing length-of-stay discounts or slightly higher rates for bookings made less than 96 days out to capitalize on advance planning.
- Target marketing efforts for the Spring season well in advance (at least 86 days) to capture early planners.
- Monitor your own booking lead times against these Hanmer Springs averages to identify opportunities for dynamic pricing adjustments.
Popular & Essential Airbnb Amenities in Hanmer Springs (2026)
Amenity Prevalence
Amenity Insights for Hanmer Springs
- Essential amenities in Hanmer Springs that guests expect include: Free parking on premises, Smoke alarm, TV. Lacking these (any) could significantly impact bookings.
- Popular amenities like Wifi, Kitchen, Heating are common but not universal. Offering these can provide a competitive edge.
- Warning: Wifi is not universally provided but is considered essential globally. Ensure reliable Wifi is offered.
Recommendations for Hosts
- Ensure your listing includes all essential amenities for Hanmer Springs: Free parking on premises, Smoke alarm, TV.
- Prioritize adding missing essentials: Free parking on premises, Smoke alarm, TV.
- Consider adding popular differentiators like Wifi or Kitchen to increase appeal.
- Highlight unique or less common amenities you offer (e.g., hot tub, dedicated workspace, EV charger) in your listing description and photos.
- Regularly check competitor amenities in Hanmer Springs to stay competitive.
Hanmer Springs Airbnb Guest Demographics & Profile Analysis (2026)
Guest Profile Summary for Hanmer Springs
- The typical guest profile for Airbnb in Hanmer Springs consists of primarily domestic travelers (73%), often arriving from nearby Christchurch, typically belonging to the Post-2000s (Gen Z/Alpha) group (50%), primarily speaking English or French.
- Domestic travelers account for 72.9% of guests.
- Key international markets include New Zealand (72.9%) and Australia (13%).
- Top languages spoken are English (73.9%) followed by French (4.6%).
- A significant demographic segment is the Post-2000s (Gen Z/Alpha) group, representing 50% of guests.
Recommendations for Hosts
- Target domestic marketing efforts towards travelers from Christchurch and Canterbury.
- Tailor amenities and listing descriptions to appeal to the dominant Post-2000s (Gen Z/Alpha) demographic (e.g., highlight fast WiFi, smart home features, local guides).
- Highlight unique local experiences or amenities relevant to the primary guest profile.
- Consider seasonal promotions aligned with peak travel times for key origin markets.
Nearby Short-Term Rental Market Comparison
How does the Hanmer Springs Airbnb market stack up against its neighbors? Compare key performance metrics like average monthly revenue, ADR, and occupancy rates in surrounding areas to understand the broader regional STR landscape.
| Market | Active Properties | Monthly Revenue | Daily Rate | Avg. Occupancy |
|---|---|---|---|---|
| Prebbleton | 20 | $2,435 | $165.91 | 53% |
| Castle Hill Village | 16 | $2,294 | $182.78 | 44% |
| Punakaiki | 31 | $1,919 | $154.84 | 43% |
| Fox River | 13 | $1,865 | $118.88 | 56% |
| Kaikōura | 282 | $1,852 | $191.41 | 40% |
| Waipara | 11 | $1,811 | $247.77 | 31% |
| Renwick | 27 | $1,795 | $163.62 | 43% |
| Kaniere | 10 | $1,760 | $124.51 | 48% |
| Saint Arnaud | 21 | $1,747 | $143.69 | 45% |
| Windwhistle | 14 | $1,683 | $186.51 | 38% |