Burkes Pass Airbnb Market Analysis 2026: Short Term Rental Data & Vacation Rental Statistics in Canterbury, New Zealand
Is Airbnb profitable in Burkes Pass in 2026? Explore comprehensive Airbnb analytics for Burkes Pass, Canterbury, New Zealand to uncover income potential. This 2026 STR market report for Burkes Pass, based on AirROI data from February 2025 to January 2026, reveals key trends in the niche market of 20 active listings.
Whether you're considering an Airbnb investment in Burkes Pass, optimizing your existing vacation rental, or exploring rental arbitrage opportunities, understanding the Burkes Pass Airbnb data is crucial. Leveraging the low regulation environment is key to maximizing your short term rental income potential. Let's dive into the specifics.
Key Burkes Pass Airbnb Performance Metrics Overview
Monthly Airbnb Revenue Variations & Income Potential in Burkes Pass (2026)
Understanding the monthly revenue variations for Airbnb listings in Burkes Pass is key to maximizing your short term rental income potential. Seasonality significantly impacts earnings. Our analysis, based on data from the past 12 months, shows that the peak revenue month for STRs in Burkes Pass is typically December, while May often presents the lowest earnings, highlighting opportunities for strategic pricing adjustments during shoulder and low seasons. Explore the typical Airbnb income in Burkes Pass across different performance tiers:
- Best-in-class properties (Top 10%) achieve $4,872+ monthly, often utilizing dynamic pricing and superior guest experiences.
- Strong performing properties (Top 25%) earn $3,576 or more, indicating effective management and desirable locations/amenities.
- Typical properties (Median) generate around $2,386 per month, representing the average market performance.
- Entry-level properties (Bottom 25%) see earnings around $1,211, often with potential for optimization.
Average Monthly Airbnb Earnings Trend in Burkes Pass
Burkes Pass Airbnb Occupancy Rate Trends (2026)
Maximize your bookings by understanding the Burkes Pass STR occupancy trends. Seasonal demand shifts significantly influence how often properties are booked. Typically, Februarysees the highest demand (peak season occupancy), while May experiences the lowest (low season). Effective strategies, like adjusting minimum stays or offering promotions, can boost occupancy during slower periods. Here's how different property tiers perform in Burkes Pass:
- Best-in-class properties (Top 10%) achieve 76%+ occupancy, indicating high desirability and potentially optimized availability.
- Strong performing properties (Top 25%) maintain 64% or higher occupancy, suggesting good market fit and guest satisfaction.
- Typical properties (Median) have an occupancy rate around 50%.
- Entry-level properties (Bottom 25%) average 29% occupancy, potentially facing higher vacancy.
Average Monthly Occupancy Rate Trend in Burkes Pass
Average Daily Rate (ADR) Airbnb Trends in Burkes Pass (2026)
Effective short term rental pricing strategy in Burkes Pass involves understanding monthly ADR fluctuations. The Average Daily Rate (ADR) for Airbnb in Burkes Pass typically peaks in December and dips lowest during May. Leveraging Airbnb dynamic pricing tools or strategies based on this seasonality can significantly boost revenue. Here's a look at the typical nightly rates achieved:
- Best-in-class properties (Top 10%) command rates of $218+ per night, often due to premium features or locations.
- Strong performing properties (Top 25%) achieve nightly rates of $178 or more.
- Typical properties (Median) charge around $146 per night.
- Entry-level properties (Bottom 25%) earn around $118 per night.
Average Daily Rate (ADR) Trend by Month in Burkes Pass
Get Live Burkes Pass Market Intelligence 👇

Explore Real-time Analytics
Airbnb Seasonality Analysis & Trends in Burkes Pass (2026)
Peak Season (December, February, January)
- Revenue averages $4,263 per month
- Occupancy rates average 68.2%
- Daily rates average $183
Shoulder Season
- Revenue averages $2,442 per month
- Occupancy maintains around 49.3%
- Daily rates hold near $148
Low Season (May, June, August)
- Revenue drops to average $1,252 per month
- Occupancy decreases to average 27.0%
- Daily rates adjust to average $139
Seasonality Insights for Burkes Pass
- The Airbnb seasonality in Burkes Pass shows highly seasonal trends requiring careful strategy. While the sections above show seasonal averages, it's also insightful to look at the extremes:
- During the high season, the absolute peak month showcases Burkes Pass's highest earning potential, with monthly revenues capable of climbing to $4,769, occupancy reaching a high of 82.2%, and ADRs peaking at $200.
- Conversely, the slowest single month of the year, typically falling within the low season, marks the market's lowest point. In this month, revenue might dip to $862, occupancy could drop to 19.4%, and ADRs may adjust down to $135.
- Understanding both the seasonal averages and these monthly peaks and troughs in revenue, occupancy, and ADR is crucial for maximizing your Airbnb profit potential in Burkes Pass.
Seasonal Strategies for Maximizing Profit
- Peak Season: Maximize revenue through premium pricing and potentially longer minimum stays. Ensure high availability.
- Low Season: Offer competitive pricing, special promotions (e.g., extended stay discounts), and flexible cancellation policies. Target off-season travelers like remote workers or budget-conscious guests.
- Shoulder Seasons: Implement dynamic pricing that balances peak and low rates. Target weekend travelers or specific events. Offer slightly more flexible terms than peak season.
- Regularly analyze your own performance against these Burkes Pass seasonality benchmarks and adjust your pricing and availability strategy accordingly.
Best Areas for Airbnb Investment in Burkes Pass (2026)
Exploring the top neighborhoods for short-term rentals in Burkes Pass? This section highlights key areas, outlining why they are attractive for hosts and guests, along with notable local attractions. Consider these locations based on your target guest profile and investment strategy.
| Neighborhood / Area | Why Host Here? (Target Guests & Appeal) | Key Attractions & Landmarks |
|---|---|---|
| Burkes Pass Village | A charming rural village that's a gateway for travelers heading to the stunning landscapes of the MacKenzie region. It's popular for its historical significance and natural beauty. | Burkes Pass Heritage Centre, Aoraki / Mount Cook National Park, Lake Tekapo, Sir Edmund Hillary Alpine Centre, Mackenzie Sheep Dog Statue |
| Lake Tekapo | One of the most picturesque lakes in New Zealand, Tekapo offers breathtaking scenery and stargazing opportunities. It's a major attraction for tourists year-round. | Lake Tekapo, Church of the Good Shepherd, Tekapo Springs, Mackenzie Basin, Star gazing in Dark Sky Reserve |
| Twizel | Serving as a base for outdoor activities in the nearby national parks, Twizel attracts visitors seeking adventure and the serene beauty of the region. | Lake Ruataniwha, Twizel River, Ohau Ski Area, Mackenzie Region trails, Mackenzie Country |
| Mount Cook Village | Located at the foot of New Zealand's highest mountain, it's a hub for hikers and mountaineers looking to explore the majestic Aoraki/Mount Cook National Park. | Aoraki / Mount Cook, Hooker Valley Track, Mount Cook Museum, Sir Edmund Hillary Alpine Centre, Tasman Glacier |
| Tekapo Springs | A popular attraction featuring hot pools and activity options, attracting tourists looking for relaxation and adventure amidst stunning scenery. | Hot pools, Ice skating in winter, Snow tubing, Spa and wellness services, Lakeside walking trails |
| Mackenzie District | Known for its vast landscapes and stunning lakes, the Mackenzie District is a prime location for outdoor enthusiasts and nature lovers. | Aoraki / Mount Cook, Lake Pukaki, Mount John Observatory, The Church of the Good Shepherd, Scenic drives |
| Timaru | A larger town nearby that offers additional amenities and attractions, ideal for visitors looking for a mixture of urban and nature experiences. | Caroline Bay, Timaru Botanic Gardens, South Canterbury Museum, Aigantighe Art Gallery, C Bay Aquatic Park |
| Fairlie | A quaint town that acts as a portal to the stunning landscapes of the surrounding areas, attracting travelers exploring rural New Zealand. | Fairlie Heritage Museum, Mount Gerald Station, Nearby hiking trails, Local cafes, Scenic rural drives |
Understanding Airbnb License Requirements & STR Laws in Burkes Pass (2026)
While Burkes Pass, Canterbury, New Zealand currently shows low STR regulations, specific Airbnb license requirements might still exist or change. Always verify the latest short term rental regulations and Airbnb license requirements directly with local government authorities for Burkes Pass to ensure full compliance before hosting.
(Source: AirROI data, 2026, finding no licensed listings among those analyzed)
Top Performing Airbnb Properties in Burkes Pass (2026)
Benchmark your potential! Explore examples of top-performing Airbnb properties in Burkes Passbased on Trailing Twelve Month (TTM) revenue. Analyze their characteristics, revenue, occupancy rate, and ADR to understand what drives success in this market.
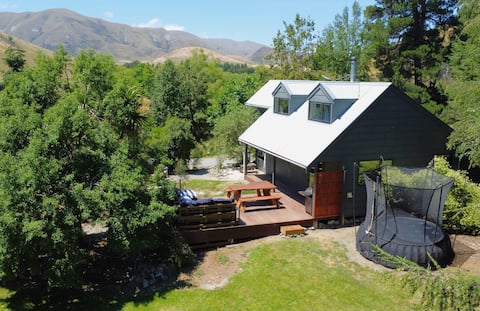
Garden & hot tub | 15 min to Lake Tekapo
Entire Place • 3 bedrooms
Alpine Cottage Burkes Pass - Tekapo
Entire Place • 4 bedrooms

New Alpine Views Burkes Pass - Tekapo
Entire Place • 3 bedrooms

"REHUA" New cottage - Burke's Pass - Tekapo
Entire Place • 3 bedrooms
New Alpine Views Burkes Pass - Tekapo
Entire Place • 3 bedrooms

High Country Farmstay - near Tekapo
Entire Place • 3 bedrooms
Note: Performance varies based on location, size, amenities, seasonality, and management quality. Data reflects the past 12 months.
Top Performing Airbnb Hosts in Burkes Pass (2026)
Learn from the best! This table showcases top-performing Airbnb hosts in Burkes Pass based on the number of properties managed and estimated total revenue over the past year. Analyze their scale and performance metrics.
| Host Name | Properties | Grossing Revenue | Stay Reviews | Avg Rating |
|---|---|---|---|---|
| Stephen | 3 | $144,726 | 371 | 4.96/5.0 |
| Tiny Away NZ | 4 | $75,382 | 79 | 4.78/5.0 |
| Beth | 1 | $57,140 | 123 | 4.92/5.0 |
| Dion & Lou | 2 | $55,917 | 166 | 4.86/5.0 |
| Damion | 1 | $47,859 | 304 | 4.89/5.0 |
| Megan | 4 | $38,863 | 40 | 4.74/5.0 |
| John | 1 | $23,342 | 120 | 4.85/5.0 |
| Logan | 1 | $22,967 | 153 | 4.70/5.0 |
| Michele | 1 | $20,044 | 227 | 4.94/5.0 |
| Dave | 2 | $9,360 | 348 | 4.78/5.0 |
Analyzing the strategies of top hosts, such as their property selection, pricing, and guest communication, can offer valuable lessons for optimizing your own Airbnb operations in Burkes Pass.
Dive Deeper: Advanced Burkes Pass STR Market Data (2026)
Ready to unlock more insights? AirROI provides access to advanced metrics and comprehensive Airbnb data for Burkes Pass. Explore detailed analytics beyond this report to refine your investment strategy, optimize pricing, and maximize your vacation rental profits.
Explore Advanced MetricsBurkes Pass Short-Term Rental Market Composition (2026): Property & Room Types
Room Type Distribution
Property Type Distribution
Market Composition Insights for Burkes Pass
- The Burkes Pass Airbnb market composition is heavily skewed towards Entire Home/Apt listings, which make up 85% of the 20 active rentals. This indicates strong guest preference for privacy and space.
- Looking at the property type distribution in Burkes Pass, House properties are the most common (55%), reflecting the local real estate landscape.
- Houses represent a significant 55% portion, catering likely to families or larger groups.
- The presence of 10% Hotel/Boutique listings indicates integration with traditional hospitality.
Burkes Pass Airbnb Room Capacity Analysis (2026): Bedroom Distribution
Distribution of Listings by Number of Bedrooms
Room Capacity Insights for Burkes Pass
- The dominant room capacity in Burkes Pass is 1 bedroom listings, making up 50% of the market. This suggests a strong demand for properties suitable for couples or solo travelers.
- Together, 1 bedroom and 3 bedrooms properties represent 85.0% of the active Airbnb listings in Burkes Pass, indicating a high concentration in these sizes.
- A significant 40.0% of listings offer 3+ bedrooms, catering to larger groups and families seeking more space in Burkes Pass.
Burkes Pass Vacation Rental Guest Capacity Trends (2026)
Distribution of Listings by Guest Capacity
Guest Capacity Insights for Burkes Pass
- The most common guest capacity trend in Burkes Pass vacation rentals is listings accommodating 2 guests (35%). This suggests the primary traveler segment is likely couples or solo travelers.
- Properties designed for 2 guests and 6 guests dominate the Burkes Pass STR market, accounting for 70.0% of listings.
- 40.0% of properties accommodate 6+ guests, serving the market segment for larger families or group travel in Burkes Pass.
- On average, properties in Burkes Pass are equipped to host 4.0 guests.
Burkes Pass Airbnb Booking Patterns (2026): Available vs. Booked Days
Available Days Distribution
Booked Days Distribution
Booking Pattern Insights for Burkes Pass
- The most common availability pattern in Burkes Pass falls within the 181-270 days range, representing 40% of listings. This suggests many properties have significant open periods on their calendars.
- Approximately 70.0% of listings show high availability (181+ days open annually), indicating potential for increased bookings or specific owner usage patterns.
- For booked days, the 91-180 days range is most frequent in Burkes Pass (35%), reflecting common guest stay durations or potential owner blocking patterns.
- A notable 35.0% of properties secure long booking periods (181+ days booked per year), highlighting successful long-term rental strategies or significant owner usage.
Burkes Pass Airbnb Minimum Stay Requirements Analysis
Distribution of Listings by Minimum Night Requirement
1 Night
13 listings
65% of total
2 Nights
1 listings
5% of total
30+ Nights
6 listings
30% of total
Key Insights
- The most prevalent minimum stay requirement in Burkes Pass is 1 Night, adopted by 65% of listings. This highlights the market's preference for shorter, flexible bookings.
- A strong majority (70.0%) of the Burkes Pass Airbnb data shows acceptance of very short stays (1-2 nights), indicating a dynamic, high-turnover market.
- A significant segment (30%) caters to monthly stays (30+ nights) in Burkes Pass, pointing to opportunities in the extended-stay market.
Recommendations
- Align with the market by considering a 1 Night minimum stay, as 65% of Burkes Pass hosts use this setting.
- Explore offering discounts for stays of 30+ nights to attract the 30% of the market seeking extended stays.
- Adjust minimum nights based on seasonality – potentially shorter during low season and longer during peak demand periods in Burkes Pass.
Burkes Pass Airbnb Cancellation Policy Trends Analysis (2026)
Limited
4 listings
20% of total
Flexible
3 listings
15% of total
Moderate
8 listings
40% of total
Firm
5 listings
25% of total
Cancellation Policy Insights for Burkes Pass
- The prevailing Airbnb cancellation policy trend in Burkes Pass is Moderate, used by 40% of listings.
- There's a relatively balanced mix between guest-friendly (55.0%) and stricter (25.0%) policies, offering choices for different guest needs.
Recommendations for Hosts
- Consider adopting a Moderate policy to align with the 40% market standard in Burkes Pass.
- Regularly review your cancellation policy against competitors and market demand shifts in Burkes Pass.
Burkes Pass STR Booking Lead Time Analysis (2026)
Average Booking Lead Time by Month
Booking Lead Time Insights for Burkes Pass
- The overall average booking lead time for vacation rentals in Burkes Pass is 67 days.
- Guests book furthest in advance for stays during December (average 106 days), likely coinciding with peak travel demand or local events.
- The shortest booking windows occur for stays in June (average 25 days), indicating more last-minute travel plans during this time.
- Seasonally, Winter (80 days avg.) sees the longest lead times, while Summer (37 days avg.) has the shortest, reflecting typical travel planning cycles.
Recommendations for Hosts
- Use the overall average lead time (67 days) as a baseline for your pricing and availability strategy in Burkes Pass.
- For December stays, consider implementing length-of-stay discounts or slightly higher rates for bookings made less than 106 days out to capitalize on advance planning.
- Target marketing efforts for the Winter season well in advance (at least 80 days) to capture early planners.
- Monitor your own booking lead times against these Burkes Pass averages to identify opportunities for dynamic pricing adjustments.
Popular & Essential Airbnb Amenities in Burkes Pass (2026)
Amenity Prevalence
Amenity Insights for Burkes Pass
- Essential amenities in Burkes Pass that guests expect include: Free parking on premises, Smoke alarm, Hot water. Lacking these (any) could significantly impact bookings.
- Popular amenities like Shampoo, Wifi, Kitchen are common but not universal. Offering these can provide a competitive edge.
- Warning: Wifi is not universally provided but is considered essential globally. Ensure reliable Wifi is offered.
Recommendations for Hosts
- Ensure your listing includes all essential amenities for Burkes Pass: Free parking on premises, Smoke alarm, Hot water.
- Prioritize adding missing essentials: Hot water.
- Consider adding popular differentiators like Shampoo or Wifi to increase appeal.
- Highlight unique or less common amenities you offer (e.g., hot tub, dedicated workspace, EV charger) in your listing description and photos.
- Regularly check competitor amenities in Burkes Pass to stay competitive.
Burkes Pass Airbnb Guest Demographics & Profile Analysis (2026)
Guest Profile Summary for Burkes Pass
- The typical guest profile for Airbnb in Burkes Pass consists of predominantly international visitors (71%), with top international origins including Australia, typically belonging to the Post-2000s (Gen Z/Alpha) group (50%), primarily speaking English or Chinese.
- Domestic travelers account for 29.0% of guests.
- Key international markets include New Zealand (29%) and Australia (22.3%).
- Top languages spoken are English (60%) followed by Chinese (13.3%).
- A significant demographic segment is the Post-2000s (Gen Z/Alpha) group, representing 50% of guests.
Recommendations for Hosts
- Focus marketing internationally, particularly towards travelers from Australia.
- Tailor amenities and listing descriptions to appeal to the dominant Post-2000s (Gen Z/Alpha) demographic (e.g., highlight fast WiFi, smart home features, local guides).
- Highlight unique local experiences or amenities relevant to the primary guest profile.
- Consider seasonal promotions aligned with peak travel times for key origin markets.
Nearby Short-Term Rental Market Comparison
How does the Burkes Pass Airbnb market stack up against its neighbors? Compare key performance metrics like average monthly revenue, ADR, and occupancy rates in surrounding areas to understand the broader regional STR landscape.
| Market | Active Properties | Monthly Revenue | Daily Rate | Avg. Occupancy |
|---|---|---|---|---|
| Lake Tekapo | 428 | $4,977 | $282.80 | 61% |
| Ben Ohau | 14 | $4,707 | $224.83 | 72% |
| Franz Josef Glacier | 23 | $3,435 | $194.79 | 64% |
| Dalefield | 14 | $3,194 | $310.72 | 43% |
| Franz Josef | 34 | $3,157 | $221.43 | 50% |
| Canterbury | 12 | $3,002 | $233.67 | 42% |
| Wānaka | 1,143 | $2,641 | $281.00 | 45% |
| Fox Glacier | 25 | $2,371 | $167.87 | 57% |
| Castle Hill Village | 16 | $2,294 | $182.78 | 44% |
| Twizel | 293 | $2,250 | $176.03 | 49% |