Papamoa Airbnb Market Analysis 2026: Short Term Rental Data & Vacation Rental Statistics in Bay of Plenty, New Zealand
Is Airbnb profitable in Papamoa in 2026? Explore comprehensive Airbnb analytics for Papamoa, Bay of Plenty, New Zealand to uncover income potential. This 2026 STR market report for Papamoa, based on AirROI data from February 2025 to January 2026, reveals key trends in the market of 254 active listings.
Whether you're considering an Airbnb investment in Papamoa, optimizing your existing vacation rental, or exploring rental arbitrage opportunities, understanding the Papamoa Airbnb data is crucial. Leveraging the low regulation environment is key to maximizing your short term rental income potential. Let's dive into the specifics.
Key Papamoa Airbnb Performance Metrics Overview
Monthly Airbnb Revenue Variations & Income Potential in Papamoa (2026)
Understanding the monthly revenue variations for Airbnb listings in Papamoa is key to maximizing your short term rental income potential. Seasonality significantly impacts earnings. Our analysis, based on data from the past 12 months, shows that the peak revenue month for STRs in Papamoa is typically December, while June often presents the lowest earnings, highlighting opportunities for strategic pricing adjustments during shoulder and low seasons. Explore the typical Airbnb income in Papamoa across different performance tiers:
- Best-in-class properties (Top 10%) achieve $5,164+ monthly, often utilizing dynamic pricing and superior guest experiences.
- Strong performing properties (Top 25%) earn $3,021 or more, indicating effective management and desirable locations/amenities.
- Typical properties (Median) generate around $1,626 per month, representing the average market performance.
- Entry-level properties (Bottom 25%) see earnings around $812, often with potential for optimization.
Average Monthly Airbnb Earnings Trend in Papamoa
Papamoa Airbnb Occupancy Rate Trends (2026)
Maximize your bookings by understanding the Papamoa STR occupancy trends. Seasonal demand shifts significantly influence how often properties are booked. Typically, Februarysees the highest demand (peak season occupancy), while June experiences the lowest (low season). Effective strategies, like adjusting minimum stays or offering promotions, can boost occupancy during slower periods. Here's how different property tiers perform in Papamoa:
- Best-in-class properties (Top 10%) achieve 77%+ occupancy, indicating high desirability and potentially optimized availability.
- Strong performing properties (Top 25%) maintain 59% or higher occupancy, suggesting good market fit and guest satisfaction.
- Typical properties (Median) have an occupancy rate around 34%.
- Entry-level properties (Bottom 25%) average 15% occupancy, potentially facing higher vacancy.
Average Monthly Occupancy Rate Trend in Papamoa
Average Daily Rate (ADR) Airbnb Trends in Papamoa (2026)
Effective short term rental pricing strategy in Papamoa involves understanding monthly ADR fluctuations. The Average Daily Rate (ADR) for Airbnb in Papamoa typically peaks in January and dips lowest during May. Leveraging Airbnb dynamic pricing tools or strategies based on this seasonality can significantly boost revenue. Here's a look at the typical nightly rates achieved:
- Best-in-class properties (Top 10%) command rates of $398+ per night, often due to premium features or locations.
- Strong performing properties (Top 25%) achieve nightly rates of $307 or more.
- Typical properties (Median) charge around $203 per night.
- Entry-level properties (Bottom 25%) earn around $120 per night.
Average Daily Rate (ADR) Trend by Month in Papamoa
Get Live Papamoa Market Intelligence 👇

Explore Real-time Analytics
Airbnb Seasonality Analysis & Trends in Papamoa (2026)
Peak Season (December, January, February)
- Revenue averages $3,142 per month
- Occupancy rates average 44.6%
- Daily rates average $241
Shoulder Season
- Revenue averages $2,367 per month
- Occupancy maintains around 39.6%
- Daily rates hold near $222
Low Season (June, July, August)
- Revenue drops to average $1,730 per month
- Occupancy decreases to average 30.4%
- Daily rates adjust to average $221
Seasonality Insights for Papamoa
- The Airbnb seasonality in Papamoa shows highly seasonal trends requiring careful strategy. While the sections above show seasonal averages, it's also insightful to look at the extremes:
- During the high season, the absolute peak month showcases Papamoa's highest earning potential, with monthly revenues capable of climbing to $3,343, occupancy reaching a high of 47.6%, and ADRs peaking at $252.
- Conversely, the slowest single month of the year, typically falling within the low season, marks the market's lowest point. In this month, revenue might dip to $1,604, occupancy could drop to 28.3%, and ADRs may adjust down to $214.
- Understanding both the seasonal averages and these monthly peaks and troughs in revenue, occupancy, and ADR is crucial for maximizing your Airbnb profit potential in Papamoa.
Seasonal Strategies for Maximizing Profit
- Peak Season: Maximize revenue through premium pricing and potentially longer minimum stays. Ensure high availability.
- Low Season: Offer competitive pricing, special promotions (e.g., extended stay discounts), and flexible cancellation policies. Target off-season travelers like remote workers or budget-conscious guests.
- Shoulder Seasons: Implement dynamic pricing that balances peak and low rates. Target weekend travelers or specific events. Offer slightly more flexible terms than peak season.
- Regularly analyze your own performance against these Papamoa seasonality benchmarks and adjust your pricing and availability strategy accordingly.
Best Areas for Airbnb Investment in Papamoa (2026)
Exploring the top neighborhoods for short-term rentals in Papamoa? This section highlights key areas, outlining why they are attractive for hosts and guests, along with notable local attractions. Consider these locations based on your target guest profile and investment strategy.
| Neighborhood / Area | Why Host Here? (Target Guests & Appeal) | Key Attractions & Landmarks |
|---|---|---|
| Papamoa Beach | A pristine and family-friendly local beach that attracts tourists all year round, perfect for water activities and relaxation with access to cafes and shops nearby. | Papamoa Beach, Papamoa Hills Regional Park, Fashion Island, The Papamoa Plaza, Dune Park |
| Golden Sands | A newer development with stunning views and modern amenities, appealing to families and young couples seeking a seaside getaway at a quieter beach. | Golden Sands Beach, Te Tumu, Coast Papamoa, Local parks and playgrounds, Walking trails along the coastline |
| Papamoa East | A growing residential area that offers a more relaxed and suburban feel, popular among families and those looking for quiet retreats close to the beach. | Pacific Coast Highway, Local cafes and shops, Papamoa East Beach, Nearby golf courses, Community parks |
| West End | A vibrant local community with a mix of residential and retail, ideal for those who enjoy being close to local life and the beach. | Papamoa Plaza, Local markets, Restaurants and cafes, Proximity to Tauranga, Walking distance to the beach |
| The Boulevard | A luxury beachfront area with high-end properties and upscale amenities, attracting those seeking a more lavish stay. | Beachfront properties, Local spa and wellness centers, Fine dining options, Beautiful walking paths along the beach, Easy access to water sports |
| Te Puke | Located just inland but close enough to Papamoa, it's known for its local kiwi fruit orchards and markets, providing a rural retreat with urban access. | Kiwi 360, Te Puke's Farmers' Market, Local parks, Nearby beaches, Café culture |
| Bayfair | Close to shopping and dining amenities, as well as beaches, making it a convenient location for diverse travelers. | Bayfair Shopping Centre, Mt Maunganui Beach, Local restaurants, Fitness and recreation facilities |
| Mount Maunganui | A renowned tourist destination just a short drive from Papamoa, famous for its stunning beach, surf culture, and mountain walks, drawing both domestic and international visitors. | Mount Maunganui Summit, Main Beach, Pilot Bay, Mount Maunganui Hot Pools, Shopping and cafes on Maunganui Road |
Understanding Airbnb License Requirements & STR Laws in Papamoa (2026)
While Papamoa, Bay of Plenty, New Zealand currently shows low STR regulations, specific Airbnb license requirements might still exist or change. Always verify the latest short term rental regulations and Airbnb license requirements directly with local government authorities for Papamoa to ensure full compliance before hosting.
(Source: AirROI data, 2026, based on 1% licensed listings)
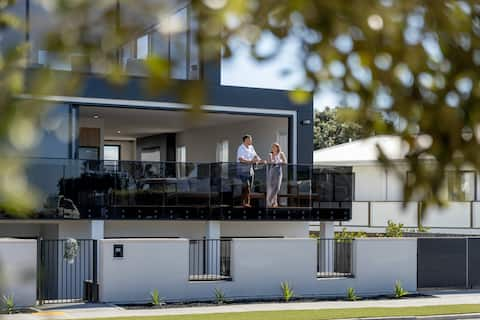
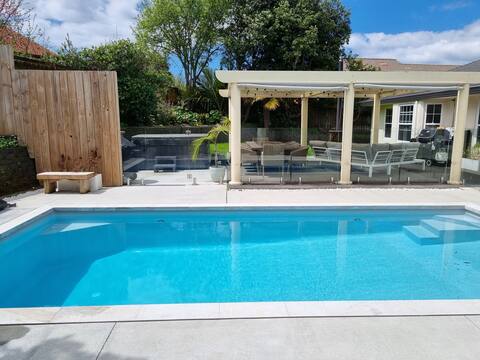
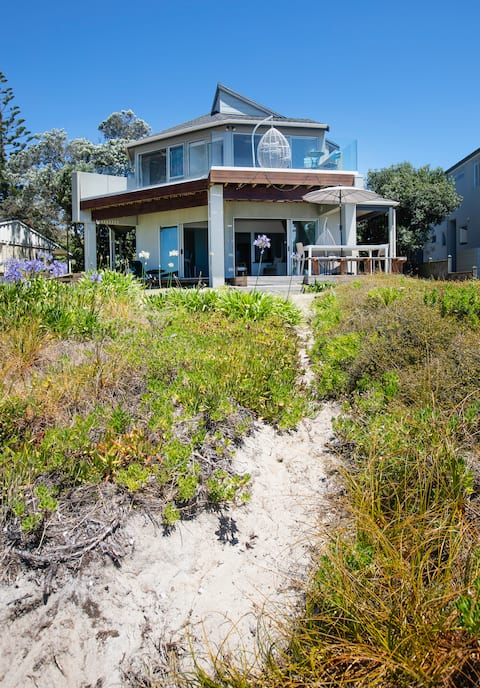
Top Performing Airbnb Properties in Papamoa (2026)
Benchmark your potential! Explore examples of top-performing Airbnb properties in Papamoabased on Trailing Twelve Month (TTM) revenue. Analyze their characteristics, revenue, occupancy rate, and ADR to understand what drives success in this market.

Beachfront Mediterranean Villa
Entire Place • 4 bedrooms

Spacious Oasis with Pool and Spa Pool
Entire Place • 5 bedrooms
Papamoa Coastal Oasis
Entire Place • 8 bedrooms
Family Fun in Papamoa
Entire Place • 4 bedrooms
The Beachhouse- absolute beachfront!
Entire Place • 4 bedrooms

Luxury Papamoa Beach | Pool | Spa | Pet Friendly
Entire Place • 4 bedrooms
Note: Performance varies based on location, size, amenities, seasonality, and management quality. Data reflects the past 12 months.
Top Performing Airbnb Hosts in Papamoa (2026)
Learn from the best! This table showcases top-performing Airbnb hosts in Papamoa based on the number of properties managed and estimated total revenue over the past year. Analyze their scale and performance metrics.
| Host Name | Properties | Grossing Revenue | Stay Reviews | Avg Rating |
|---|---|---|---|---|
| Chloe | 3 | $198,619 | 43 | 4.96/5.0 |
| Jessica | 6 | $166,989 | 628 | 4.73/5.0 |
| Beyonder | 5 | $166,170 | 221 | 4.90/5.0 |
| Kristin | 5 | $140,639 | 344 | 4.87/5.0 |
| Belinda | 1 | $133,068 | 26 | 4.88/5.0 |
| Rebecca | 1 | $127,252 | 12 | 4.83/5.0 |
| Kathryn | 2 | $107,867 | 134 | 4.93/5.0 |
| Stacey | 1 | $85,407 | 13 | 4.92/5.0 |
| Hayley | 4 | $83,273 | 62 | 4.95/5.0 |
| Ruby | 1 | $79,262 | 47 | 5.00/5.0 |
Analyzing the strategies of top hosts, such as their property selection, pricing, and guest communication, can offer valuable lessons for optimizing your own Airbnb operations in Papamoa.
Dive Deeper: Advanced Papamoa STR Market Data (2026)
Ready to unlock more insights? AirROI provides access to advanced metrics and comprehensive Airbnb data for Papamoa. Explore detailed analytics beyond this report to refine your investment strategy, optimize pricing, and maximize your vacation rental profits.
Explore Advanced MetricsPapamoa Short-Term Rental Market Composition (2026): Property & Room Types
Room Type Distribution
Property Type Distribution
Market Composition Insights for Papamoa
- The Papamoa Airbnb market composition is heavily skewed towards Entire Home/Apt listings, which make up 90.9% of the 254 active rentals. This indicates strong guest preference for privacy and space.
- Looking at the property type distribution in Papamoa, House properties are the most common (81.1%), reflecting the local real estate landscape.
- Houses represent a significant 81.1% portion, catering likely to families or larger groups.
- The presence of 6.3% Hotel/Boutique listings indicates integration with traditional hospitality.
- Smaller segments like outdoor/unique, unique stays (combined 1.6%) offer potential for unique stay experiences.
Papamoa Airbnb Room Capacity Analysis (2026): Bedroom Distribution
Distribution of Listings by Number of Bedrooms
Room Capacity Insights for Papamoa
- The dominant room capacity in Papamoa is 3 bedrooms listings, making up 34.6% of the market. This suggests a strong demand for properties suitable for families or small groups.
- Together, 3 bedrooms and 4 bedrooms properties represent 60.6% of the active Airbnb listings in Papamoa, indicating a high concentration in these sizes.
- A significant 64.1% of listings offer 3+ bedrooms, catering to larger groups and families seeking more space in Papamoa.
Papamoa Vacation Rental Guest Capacity Trends (2026)
Distribution of Listings by Guest Capacity
Guest Capacity Insights for Papamoa
- The most common guest capacity trend in Papamoa vacation rentals is listings accommodating 8+ guests (29.5%). This suggests the primary traveler segment is likely larger groups.
- Properties designed for 8+ guests and 6 guests dominate the Papamoa STR market, accounting for 55.5% of listings.
- 61.0% of properties accommodate 6+ guests, serving the market segment for larger families or group travel in Papamoa.
- On average, properties in Papamoa are equipped to host 5.4 guests.
Papamoa Airbnb Booking Patterns (2026): Available vs. Booked Days
Available Days Distribution
Booked Days Distribution
Booking Pattern Insights for Papamoa
- The most common availability pattern in Papamoa falls within the 271-366 days range, representing 57.1% of listings. This suggests many properties have significant open periods on their calendars.
- Approximately 84.3% of listings show high availability (181+ days open annually), indicating potential for increased bookings or specific owner usage patterns.
- For booked days, the 1-30 days range is most frequent in Papamoa (29.1%), reflecting common guest stay durations or potential owner blocking patterns.
- A notable 16.2% of properties secure long booking periods (181+ days booked per year), highlighting successful long-term rental strategies or significant owner usage.
Papamoa Airbnb Minimum Stay Requirements Analysis
Distribution of Listings by Minimum Night Requirement
1 Night
54 listings
21.3% of total
2 Nights
77 listings
30.3% of total
3 Nights
16 listings
6.3% of total
4-6 Nights
17 listings
6.7% of total
7-29 Nights
6 listings
2.4% of total
30+ Nights
84 listings
33.1% of total
Key Insights
- The most prevalent minimum stay requirement in Papamoa is 30+ Nights, adopted by 33.1% of listings. This highlights the market's preference for longer commitments.
- A significant segment (33.1%) caters to monthly stays (30+ nights) in Papamoa, pointing to opportunities in the extended-stay market.
Recommendations
- Align with the market by considering a 30+ Nights minimum stay, as 33.1% of Papamoa hosts use this setting.
- If feasible, allowing 1-night stays, especially midweek or during low season, could capture last-minute bookings, as only 21.3% currently do.
- Explore offering discounts for stays of 30+ nights to attract the 33.1% of the market seeking extended stays.
- Adjust minimum nights based on seasonality – potentially shorter during low season and longer during peak demand periods in Papamoa.
Papamoa Airbnb Cancellation Policy Trends Analysis (2026)
Super Strict 30 Days
2 listings
0.8% of total
Limited
3 listings
1.2% of total
Flexible
45 listings
17.9% of total
Moderate
87 listings
34.5% of total
Firm
98 listings
38.9% of total
Strict
17 listings
6.7% of total
Cancellation Policy Insights for Papamoa
- The prevailing Airbnb cancellation policy trend in Papamoa is Firm, used by 38.9% of listings.
- There's a relatively balanced mix between guest-friendly (52.4%) and stricter (45.6%) policies, offering choices for different guest needs.
- Strict cancellation policies are quite rare (6.7%), potentially making listings with this policy less competitive unless justified by high demand or property type.
Recommendations for Hosts
- Consider adopting a Firm policy to align with the 38.9% market standard in Papamoa.
- Using a Strict policy might deter some guests, as only 6.7% of listings use it. Evaluate if potential revenue protection outweighs possible lower booking rates.
- Regularly review your cancellation policy against competitors and market demand shifts in Papamoa.
Papamoa STR Booking Lead Time Analysis (2026)
Average Booking Lead Time by Month
Booking Lead Time Insights for Papamoa
- The overall average booking lead time for vacation rentals in Papamoa is 58 days.
- Guests book furthest in advance for stays during December (average 90 days), likely coinciding with peak travel demand or local events.
- The shortest booking windows occur for stays in June (average 33 days), indicating more last-minute travel plans during this time.
- Seasonally, Winter (68 days avg.) sees the longest lead times, while Spring (40 days avg.) has the shortest, reflecting typical travel planning cycles.
Recommendations for Hosts
- Use the overall average lead time (58 days) as a baseline for your pricing and availability strategy in Papamoa.
- For December stays, consider implementing length-of-stay discounts or slightly higher rates for bookings made less than 90 days out to capitalize on advance planning.
- Target marketing efforts for the Winter season well in advance (at least 68 days) to capture early planners.
- Monitor your own booking lead times against these Papamoa averages to identify opportunities for dynamic pricing adjustments.
Popular & Essential Airbnb Amenities in Papamoa (2026)
Amenity Prevalence
Amenity Insights for Papamoa
- Essential amenities in Papamoa that guests expect include: Wifi, Smoke alarm. Lacking these (any) could significantly impact bookings.
- Popular amenities like TV, Free parking on premises, Kitchen are common but not universal. Offering these can provide a competitive edge.
Recommendations for Hosts
- Ensure your listing includes all essential amenities for Papamoa: Wifi, Smoke alarm.
- Prioritize adding missing essentials: Wifi, Smoke alarm.
- Consider adding popular differentiators like TV or Free parking on premises to increase appeal.
- Highlight unique or less common amenities you offer (e.g., hot tub, dedicated workspace, EV charger) in your listing description and photos.
- Regularly check competitor amenities in Papamoa to stay competitive.
Papamoa Airbnb Guest Demographics & Profile Analysis (2026)
Guest Profile Summary for Papamoa
- The typical guest profile for Airbnb in Papamoa consists of primarily domestic travelers (77%), often arriving from nearby Auckland, typically belonging to the Post-2000s (Gen Z/Alpha) group (50%), primarily speaking English or Spanish.
- Domestic travelers account for 77.1% of guests.
- Key international markets include New Zealand (77.1%) and Australia (6.9%).
- Top languages spoken are English (72.5%) followed by Spanish (5%).
- A significant demographic segment is the Post-2000s (Gen Z/Alpha) group, representing 50% of guests.
Recommendations for Hosts
- Target domestic marketing efforts towards travelers from Auckland and Wellington.
- Tailor amenities and listing descriptions to appeal to the dominant Post-2000s (Gen Z/Alpha) demographic (e.g., highlight fast WiFi, smart home features, local guides).
- Highlight unique local experiences or amenities relevant to the primary guest profile.
- Consider seasonal promotions aligned with peak travel times for key origin markets.
Nearby Short-Term Rental Market Comparison
How does the Papamoa Airbnb market stack up against its neighbors? Compare key performance metrics like average monthly revenue, ADR, and occupancy rates in surrounding areas to understand the broader regional STR landscape.
| Market | Active Properties | Monthly Revenue | Daily Rate | Avg. Occupancy |
|---|---|---|---|---|
| Hot Water Beach | 27 | $2,949 | $257.55 | 50% |
| Tikitere | 15 | $2,599 | $238.84 | 48% |
| Hamurana | 28 | $2,555 | $170.74 | 50% |
| Lake Tarawera | 35 | $2,411 | $302.59 | 38% |
| Te Kūiti | 17 | $2,391 | $126.21 | 59% |
| Waiheke | 580 | $2,274 | $338.47 | 32% |
| Hahei | 104 | $2,241 | $260.25 | 39% |
| Ngongotahā | 79 | $2,152 | $194.15 | 44% |
| Okere Falls | 32 | $2,118 | $246.61 | 37% |
| Rotorua | 689 | $2,021 | $160.41 | 47% |