Lake Tarawera Airbnb Market Analysis 2026: Short Term Rental Data & Vacation Rental Statistics in Bay of Plenty, New Zealand
Is Airbnb profitable in Lake Tarawera in 2026? Explore comprehensive Airbnb analytics for Lake Tarawera, Bay of Plenty, New Zealand to uncover income potential. This 2026 STR market report for Lake Tarawera, based on AirROI data from February 2025 to January 2026, reveals key trends in the niche market of 35 active listings.
Whether you're considering an Airbnb investment in Lake Tarawera, optimizing your existing vacation rental, or exploring rental arbitrage opportunities, understanding the Lake Tarawera Airbnb data is crucial. Leveraging the low regulation environment is key to maximizing your short term rental income potential. Let's dive into the specifics.
Key Lake Tarawera Airbnb Performance Metrics Overview
Monthly Airbnb Revenue Variations & Income Potential in Lake Tarawera (2026)
Understanding the monthly revenue variations for Airbnb listings in Lake Tarawera is key to maximizing your short term rental income potential. Seasonality significantly impacts earnings. Our analysis, based on data from the past 12 months, shows that the peak revenue month for STRs in Lake Tarawera is typically February, while August often presents the lowest earnings, highlighting opportunities for strategic pricing adjustments during shoulder and low seasons. Explore the typical Airbnb income in Lake Tarawera across different performance tiers:
- Best-in-class properties (Top 10%) achieve $7,344+ monthly, often utilizing dynamic pricing and superior guest experiences.
- Strong performing properties (Top 25%) earn $4,350 or more, indicating effective management and desirable locations/amenities.
- Typical properties (Median) generate around $2,129 per month, representing the average market performance.
- Entry-level properties (Bottom 25%) see earnings around $1,286, often with potential for optimization.
Average Monthly Airbnb Earnings Trend in Lake Tarawera
Lake Tarawera Airbnb Occupancy Rate Trends (2026)
Maximize your bookings by understanding the Lake Tarawera STR occupancy trends. Seasonal demand shifts significantly influence how often properties are booked. Typically, Februarysees the highest demand (peak season occupancy), while August experiences the lowest (low season). Effective strategies, like adjusting minimum stays or offering promotions, can boost occupancy during slower periods. Here's how different property tiers perform in Lake Tarawera:
- Best-in-class properties (Top 10%) achieve 77%+ occupancy, indicating high desirability and potentially optimized availability.
- Strong performing properties (Top 25%) maintain 53% or higher occupancy, suggesting good market fit and guest satisfaction.
- Typical properties (Median) have an occupancy rate around 31%.
- Entry-level properties (Bottom 25%) average 17% occupancy, potentially facing higher vacancy.
Average Monthly Occupancy Rate Trend in Lake Tarawera
Average Daily Rate (ADR) Airbnb Trends in Lake Tarawera (2026)
Effective short term rental pricing strategy in Lake Tarawera involves understanding monthly ADR fluctuations. The Average Daily Rate (ADR) for Airbnb in Lake Tarawera typically peaks in February and dips lowest during November. Leveraging Airbnb dynamic pricing tools or strategies based on this seasonality can significantly boost revenue. Here's a look at the typical nightly rates achieved:
- Best-in-class properties (Top 10%) command rates of $618+ per night, often due to premium features or locations.
- Strong performing properties (Top 25%) achieve nightly rates of $435 or more.
- Typical properties (Median) charge around $267 per night.
- Entry-level properties (Bottom 25%) earn around $179 per night.
Average Daily Rate (ADR) Trend by Month in Lake Tarawera
Get Live Lake Tarawera Market Intelligence 👇

Explore Real-time Analytics
Airbnb Seasonality Analysis & Trends in Lake Tarawera (2026)
Peak Season (February, April, December)
- Revenue averages $4,330 per month
- Occupancy rates average 48.3%
- Daily rates average $320
Shoulder Season
- Revenue averages $3,422 per month
- Occupancy maintains around 38.9%
- Daily rates hold near $307
Low Season (May, June, August)
- Revenue drops to average $2,055 per month
- Occupancy decreases to average 22.7%
- Daily rates adjust to average $319
Seasonality Insights for Lake Tarawera
- The Airbnb seasonality in Lake Tarawera shows highly seasonal trends requiring careful strategy. While the sections above show seasonal averages, it's also insightful to look at the extremes:
- During the high season, the absolute peak month showcases Lake Tarawera's highest earning potential, with monthly revenues capable of climbing to $4,793, occupancy reaching a high of 54.4%, and ADRs peaking at $335.
- Conversely, the slowest single month of the year, typically falling within the low season, marks the market's lowest point. In this month, revenue might dip to $1,596, occupancy could drop to 17.1%, and ADRs may adjust down to $290.
- Understanding both the seasonal averages and these monthly peaks and troughs in revenue, occupancy, and ADR is crucial for maximizing your Airbnb profit potential in Lake Tarawera.
Seasonal Strategies for Maximizing Profit
- Peak Season: Maximize revenue through premium pricing and potentially longer minimum stays. Ensure high availability.
- Low Season: Offer competitive pricing, special promotions (e.g., extended stay discounts), and flexible cancellation policies. Target off-season travelers like remote workers or budget-conscious guests.
- Shoulder Seasons: Implement dynamic pricing that balances peak and low rates. Target weekend travelers or specific events. Offer slightly more flexible terms than peak season.
- Regularly analyze your own performance against these Lake Tarawera seasonality benchmarks and adjust your pricing and availability strategy accordingly.
Best Areas for Airbnb Investment in Lake Tarawera (2026)
Exploring the top neighborhoods for short-term rentals in Lake Tarawera? This section highlights key areas, outlining why they are attractive for hosts and guests, along with notable local attractions. Consider these locations based on your target guest profile and investment strategy.
| Neighborhood / Area | Why Host Here? (Target Guests & Appeal) | Key Attractions & Landmarks |
|---|---|---|
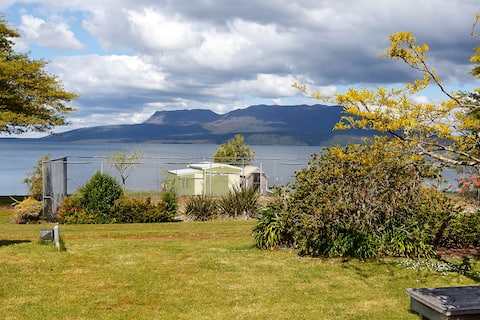
| Lake Tarawera | A stunning natural lake known for its scenic beauty, warm thermal springs, and outdoor activities. Ideal for nature lovers and those seeking a peaceful retreat close to Rotorua. | Lake Tarawera Boardwalk, Tarawera Falls, Hot Water Beach, Buried Village of Te Wairoa, Tarawera Trail, Cooking Lake Events |
| Murupara | A small town near the northern end of Lake Tarawera, offering access to local culture and outdoor adventures. Great for travelers looking for a more authentic Kiwi experience. | Murupara Railway Station, Rotoiti Nature Recovery Project, Te Urewera National Park, Local markets, Hiking opportunities |
| Rotorua | Close to Lake Tarawera, Rotorua is famous for its geothermal activity and Maori culture. Attracts many tourists interested in these unique experiences. | Te Puia, Rotorua Lake, Agrodome, Redwoods Treewalk, Polynesian Spa, Rotorua Museum |
| Te Whaiti | A charming rural area with beautiful landscapes and outdoor activities, perfect for those looking to escape city life while still being close to Lake Tarawera. | Te Whaiti Valley, Hiking trails, Scenic views, Local flora and fauna, Nature photography opportunities |
| Eastern Bay of Plenty | Lesser-known yet beautiful coastal areas offering beaches and nature activities. Attractive to guests wanting a more off-the-beaten-path experience. | Otarawairere Beach, Whakatāne River, Ohiwa Harbour, Local seafood restaurants, Whirinaki Te Pua-a-Tāne Conservation Park |
| Okere Falls | Located near the Kaituna River, popular for white-water rafting and adventure sports. Great for thrill-seekers and outdoor enthusiasts. | Okere Falls, Kaituna River Rafting, Biking trails, Fishing spots, Local camping areas |
| Ngongotahā | A suburb of Rotorua with beautiful lakeside views and close to various attractions, suitable for families and outdoor lovers. | Ngongotahā Stream, Agrodome, Lakeside parks, Fishing spots, Maori cultural experiences |
| Hamurana | A picturesque village located on the northern shores of Lake Rotorua with a laid-back vibe, suitable for peaceful stays and nature walks. | Hamurana Springs, Lake Rotorua, Nature walks, Picnic areas, Scenic landscapes |
Understanding Airbnb License Requirements & STR Laws in Lake Tarawera (2026)
While Lake Tarawera, Bay of Plenty, New Zealand currently shows low STR regulations, specific Airbnb license requirements might still exist or change. Always verify the latest short term rental regulations and Airbnb license requirements directly with local government authorities for Lake Tarawera to ensure full compliance before hosting.
(Source: AirROI data, 2026, finding no licensed listings among those analyzed)
Top Performing Airbnb Properties in Lake Tarawera (2026)
Benchmark your potential! Explore examples of top-performing Airbnb properties in Lake Tarawerabased on Trailing Twelve Month (TTM) revenue. Analyze their characteristics, revenue, occupancy rate, and ADR to understand what drives success in this market.
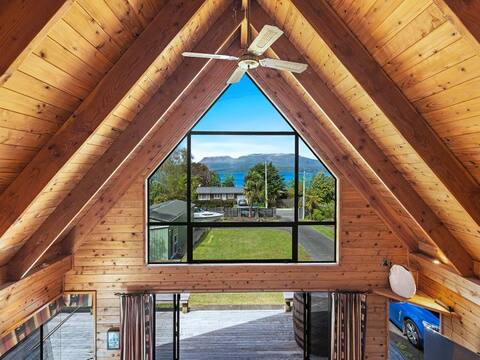
Lakefront Tarawera Bliss
Entire Place • 5 bedrooms

Lake Tarawera spacious home, path down to the lake
Entire Place • 6 bedrooms

Tarawera luxury lakeside, spa, stunning views
Entire Place • 3 bedrooms
Spacious home at Lake Tarawera, nr boat launch
Entire Place • 4 bedrooms

"Mana Sarovar"-indoor/outdoor flow, fabulous views
Entire Place • 4 bedrooms

~ the hunting huts~ a fresh take on the kiwi bach
Entire Place • 4 bedrooms
Note: Performance varies based on location, size, amenities, seasonality, and management quality. Data reflects the past 12 months.
Top Performing Airbnb Hosts in Lake Tarawera (2026)
Learn from the best! This table showcases top-performing Airbnb hosts in Lake Tarawera based on the number of properties managed and estimated total revenue over the past year. Analyze their scale and performance metrics.
| Host Name | Properties | Grossing Revenue | Stay Reviews | Avg Rating |
|---|---|---|---|---|
| Angela | 9 | $357,387 | 270 | 4.78/5.0 |
| Rosalie | 1 | $102,633 | 32 | 4.94/5.0 |
| Norman | 3 | $70,570 | 72 | 4.86/5.0 |
| Glenn | 1 | $48,433 | 130 | 4.91/5.0 |
| David | 1 | $47,032 | 49 | 4.94/5.0 |
| Ryan | 1 | $44,332 | 17 | 5.00/5.0 |
| Steve | 2 | $38,629 | 172 | 4.75/5.0 |
| Lamees | 1 | $31,070 | 70 | 4.90/5.0 |
| Bronwyn | 1 | $28,898 | 702 | 4.96/5.0 |
| Mandy | 1 | $28,654 | 42 | 4.98/5.0 |
Analyzing the strategies of top hosts, such as their property selection, pricing, and guest communication, can offer valuable lessons for optimizing your own Airbnb operations in Lake Tarawera.
Dive Deeper: Advanced Lake Tarawera STR Market Data (2026)
Ready to unlock more insights? AirROI provides access to advanced metrics and comprehensive Airbnb data for Lake Tarawera. Explore detailed analytics beyond this report to refine your investment strategy, optimize pricing, and maximize your vacation rental profits.
Explore Advanced MetricsLake Tarawera Short-Term Rental Market Composition (2026): Property & Room Types
Room Type Distribution
Property Type Distribution
Market Composition Insights for Lake Tarawera
- The Lake Tarawera Airbnb market composition is heavily skewed towards Entire Home/Apt listings, which make up 91.4% of the 35 active rentals. This indicates strong guest preference for privacy and space.
- Looking at the property type distribution in Lake Tarawera, House properties are the most common (88.6%), reflecting the local real estate landscape.
- Houses represent a significant 88.6% portion, catering likely to families or larger groups.
- The presence of 5.7% Hotel/Boutique listings indicates integration with traditional hospitality.
- Smaller segments like others, unique stays (combined 5.8%) offer potential for unique stay experiences.
Lake Tarawera Airbnb Room Capacity Analysis (2026): Bedroom Distribution
Distribution of Listings by Number of Bedrooms
Room Capacity Insights for Lake Tarawera
- The dominant room capacity in Lake Tarawera is 3 bedrooms listings, making up 28.6% of the market. This suggests a strong demand for properties suitable for families or small groups.
- Together, 3 bedrooms and 4 bedrooms properties represent 51.5% of the active Airbnb listings in Lake Tarawera, indicating a high concentration in these sizes.
- A significant 62.9% of listings offer 3+ bedrooms, catering to larger groups and families seeking more space in Lake Tarawera.
Lake Tarawera Vacation Rental Guest Capacity Trends (2026)
Distribution of Listings by Guest Capacity
Guest Capacity Insights for Lake Tarawera
- The most common guest capacity trend in Lake Tarawera vacation rentals is listings accommodating 8+ guests (51.4%). This suggests the primary traveler segment is likely larger groups.
- Properties designed for 8+ guests and 6 guests dominate the Lake Tarawera STR market, accounting for 65.7% of listings.
- 71.4% of properties accommodate 6+ guests, serving the market segment for larger families or group travel in Lake Tarawera.
- On average, properties in Lake Tarawera are equipped to host 6.2 guests.
Lake Tarawera Airbnb Booking Patterns (2026): Available vs. Booked Days
Available Days Distribution
Booked Days Distribution
Booking Pattern Insights for Lake Tarawera
- The most common availability pattern in Lake Tarawera falls within the 271-366 days range, representing 51.4% of listings. This suggests many properties have significant open periods on their calendars.
- Approximately 85.7% of listings show high availability (181+ days open annually), indicating potential for increased bookings or specific owner usage patterns.
- For booked days, the 31-90 days range is most frequent in Lake Tarawera (40%), reflecting common guest stay durations or potential owner blocking patterns.
- A notable 14.3% of properties secure long booking periods (181+ days booked per year), highlighting successful long-term rental strategies or significant owner usage.
Lake Tarawera Airbnb Minimum Stay Requirements Analysis
Distribution of Listings by Minimum Night Requirement
1 Night
4 listings
11.4% of total
2 Nights
19 listings
54.3% of total
30+ Nights
12 listings
34.3% of total
Key Insights
- The most prevalent minimum stay requirement in Lake Tarawera is 2 Nights, adopted by 54.3% of listings. This highlights the market's preference for shorter, flexible bookings.
- A strong majority (65.7%) of the Lake Tarawera Airbnb data shows acceptance of very short stays (1-2 nights), indicating a dynamic, high-turnover market.
- A significant segment (34.3%) caters to monthly stays (30+ nights) in Lake Tarawera, pointing to opportunities in the extended-stay market.
Recommendations
- Align with the market by considering a 2 Nights minimum stay, as 54.3% of Lake Tarawera hosts use this setting.
- If feasible, allowing 1-night stays, especially midweek or during low season, could capture last-minute bookings, as only 11.4% currently do.
- A 2-night minimum appears standard (54.3%). Consider this for weekends or peak periods.
- Explore offering discounts for stays of 30+ nights to attract the 34.3% of the market seeking extended stays.
- Adjust minimum nights based on seasonality – potentially shorter during low season and longer during peak demand periods in Lake Tarawera.
Lake Tarawera Airbnb Cancellation Policy Trends Analysis (2026)
Flexible
7 listings
20% of total
Moderate
10 listings
28.6% of total
Firm
14 listings
40% of total
Strict
4 listings
11.4% of total
Cancellation Policy Insights for Lake Tarawera
- The prevailing Airbnb cancellation policy trend in Lake Tarawera is Firm, used by 40% of listings.
- A majority (51.4%) of hosts in Lake Tarawera utilize Firm or Strict policies, indicating a market where hosts prioritize booking security.
Recommendations for Hosts
- Consider adopting a Firm policy to align with the 40% market standard in Lake Tarawera.
- Using a Strict policy might deter some guests, as only 11.4% of listings use it. Evaluate if potential revenue protection outweighs possible lower booking rates.
- Regularly review your cancellation policy against competitors and market demand shifts in Lake Tarawera.
Lake Tarawera STR Booking Lead Time Analysis (2026)
Average Booking Lead Time by Month
Booking Lead Time Insights for Lake Tarawera
- The overall average booking lead time for vacation rentals in Lake Tarawera is 78 days.
- Guests book furthest in advance for stays during January (average 130 days), likely coinciding with peak travel demand or local events.
- The shortest booking windows occur for stays in July (average 31 days), indicating more last-minute travel plans during this time.
- Seasonally, Winter (111 days avg.) sees the longest lead times, while Summer (42 days avg.) has the shortest, reflecting typical travel planning cycles.
Recommendations for Hosts
- Use the overall average lead time (78 days) as a baseline for your pricing and availability strategy in Lake Tarawera.
- For January stays, consider implementing length-of-stay discounts or slightly higher rates for bookings made less than 130 days out to capitalize on advance planning.
- Target marketing efforts for the Winter season well in advance (at least 111 days) to capture early planners.
- Monitor your own booking lead times against these Lake Tarawera averages to identify opportunities for dynamic pricing adjustments.
Popular & Essential Airbnb Amenities in Lake Tarawera (2026)
Amenity Prevalence
Amenity Insights for Lake Tarawera
- Essential amenities in Lake Tarawera that guests expect include: Free parking on premises, Heating. Lacking these (any) could significantly impact bookings.
- Popular amenities like Dishes and silverware, TV, Smoke alarm are common but not universal. Offering these can provide a competitive edge.
Recommendations for Hosts
- Ensure your listing includes all essential amenities for Lake Tarawera: Free parking on premises, Heating.
- Prioritize adding missing essentials: Heating.
- Consider adding popular differentiators like Dishes and silverware or TV to increase appeal.
- Highlight unique or less common amenities you offer (e.g., hot tub, dedicated workspace, EV charger) in your listing description and photos.
- Regularly check competitor amenities in Lake Tarawera to stay competitive.
Lake Tarawera Airbnb Guest Demographics & Profile Analysis (2026)
Guest Profile Summary for Lake Tarawera
- The typical guest profile for Airbnb in Lake Tarawera consists of primarily domestic travelers (66%), often arriving from nearby Auckland, typically belonging to the Post-2000s (Gen Z/Alpha) group (50%), primarily speaking English or French.
- Domestic travelers account for 66.3% of guests.
- Key international markets include New Zealand (66.3%) and Australia (11.4%).
- Top languages spoken are English (54.3%) followed by French (11.7%).
- A significant demographic segment is the Post-2000s (Gen Z/Alpha) group, representing 50% of guests.
Recommendations for Hosts
- Target domestic marketing efforts towards travelers from Auckland and Wellington.
- Tailor amenities and listing descriptions to appeal to the dominant Post-2000s (Gen Z/Alpha) demographic (e.g., highlight fast WiFi, smart home features, local guides).
- Highlight unique local experiences or amenities relevant to the primary guest profile.
- Consider seasonal promotions aligned with peak travel times for key origin markets.
Nearby Short-Term Rental Market Comparison
How does the Lake Tarawera Airbnb market stack up against its neighbors? Compare key performance metrics like average monthly revenue, ADR, and occupancy rates in surrounding areas to understand the broader regional STR landscape.
| Market | Active Properties | Monthly Revenue | Daily Rate | Avg. Occupancy |
|---|---|---|---|---|
| Tikitere | 15 | $2,599 | $238.84 | 48% |
| Hamurana | 28 | $2,555 | $170.74 | 50% |
| Te Kūiti | 17 | $2,391 | $126.21 | 59% |
| Ngongotahā | 79 | $2,152 | $194.15 | 44% |
| Okere Falls | 32 | $2,118 | $246.61 | 37% |
| Rotorua | 689 | $2,021 | $160.41 | 47% |
| Mourea | 14 | $1,943 | $212.24 | 40% |
| Taupō | 1,004 | $1,942 | $212.13 | 40% |
| Karapiro | 40 | $1,865 | $206.22 | 37% |
| Rotoiti | 10 | $1,813 | $232.31 | 32% |